INTRODUCTION
Concrete knowledge of the stock structure of exploited species is essential for proper assessment and management of fish stocks. Several approaches have been adopted to examine the stock structure of marine organisms, including the studies of the distribution and abundance of life-history stages, marks and tags, morphological characters, allozyme, and DNA markers. From all stock discrimination techniques available, the analysis of morphological measurements is one of the most commonly used methods (Cadrin, 2000).
Morphological variation between stocks can provide a basis for stock structure, and may be more applicable for studying short-term, environmentally induced variation (Begg et al., 1999). For phenotypic characters, a multivariate analysis has a greater chance of detecting complex changes than univariate methods
(Zelditch et al., 1992) and the use of the box-truss distance has resulted in more accurate classification of individuals than traditional methods (Strauss and Bookstein, 1982). However, most of the morphological variability in a set of multivariate characters is due to the specimen size (Junquera and Perez-Gandaras, 1993), and a size correction procedure such as multiple-group principal components analysis (MGPCA) (Thorpe, 1988) or the related method, Burnaby’s size-adjusted discriminant analysis is required to avoid misinterpretation of the results (Cadrin, 2000).
The common mackerel (Scomber japonicus) is a pelagic species that is found in temperate and subtropical waters of the Atlantic, Indian and Pacific Oceans. Near East Asia, the common mackerel is mainly distributed in the Japan Sea, East China Sea, and adjacent waters of Taiwan (Tzeng, 1988; Hiyama et al., 2002). Four countries (Japan, Korea, China and Taiwan) exploit 1 College of Liberal Education, Shu-Te University, Kaohsiung County 824, Taiwan.
2 Institute of Oceanography, National Taiwan University, Taipei 106, Taiwan. * Corresponding author. E-mail: tdtzeng@mail.stu.edu.tw
Morphological Variation in the Common Mackerel
(
Scomber japonicus) off Taiwan
Tzong-Der Tzeng1* and Shean-Ya Yeh2
(Received, May 1, 2007; Accepted, June 15, 2007) ABSTRACT
Variation in morphological characters was used to elucidate the stock structure of Scomber japonicus off Taiwan. Three samples including 139 individuals were collected from the south of the East China Sea (SECS), the waters off eastern Taiwan (ET), and the north of the South China Sea (NSCS). A total of 16 measurements were measured for each individual and size-standardized by multiple-group principal components analysis. The resulting measurements were tested with a canonical variate analysis, and clustered three samples into two groups: one included the SECS and ET samples, and the other the NSCS. Randomization tests showed that morphological difference between two groups was significant. There appear to be two morphologically distinguishable stocks of this species off Taiwan, but further verification of the stock structure may be essential.
this resource intensively, and biomass of common mackerel has decreased (Hiyama et al., 2002).
Morphological and allozyme data had been used to examine the population structure of common mackerels off Taiwan (Lin, 1998). The results showed that there were significant differences among some pairs of S. japonicus samples off Taiwan, though author considered these differences might be derived from sampling errors. However, to obtain more reliable result, the analyzing techniques should be improved. The objective of this study is to examine the differences of morphological characters to elucidate the stock structure of S. japonicus in the waters around Taiwan.
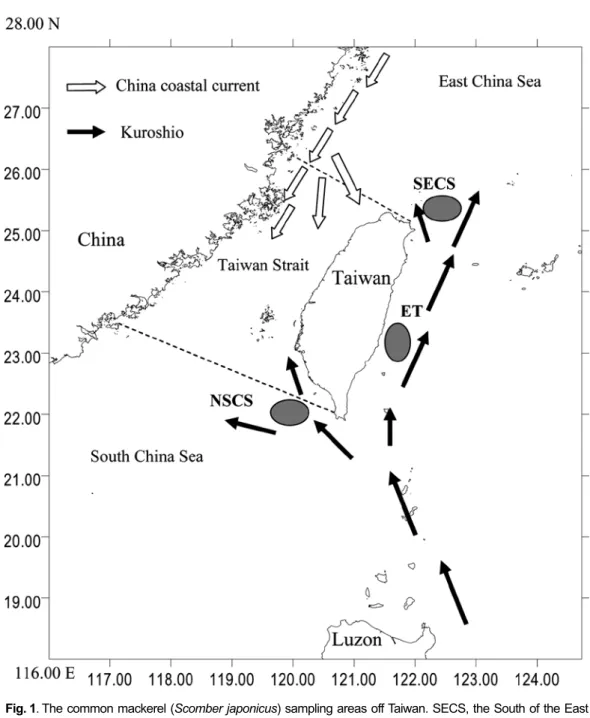
MATERIALS AND METHODS Three samples were collected from the south of the East China Sea (SECS), the waters off eastern Taiwan (ET) and the north of the South China Sea (NSCS) during February and May 2003 (Table 1 and Fig. 1). Following Tzeng (2004), we used Truss method (Strauss and Bookstein, 1982) to measure 15 morphological characters for each specimen: distance between the tip of mandible and the insertion of the first dorsal fin (MFDF), distance between the insertions of the first dorsal and pelvic fins (FDPF), distance between the tip of mandible and the insertion of the pelvic fin (MPF), distance between the insertions of the first and second dorsal fins (FSDF), distance between the insertions of the second dorsal and anal fins (SDAF), distance between the insertions of the pelvic and anal fins (PAF), distance between the insertions of the
first dorsal and anal fins (FDAF), distance between the insertions of the pelvic and the second dorsal fins (PSDF), distance between the insertions of the second dorsal fin and the fifth superior finlet (SDFFSF), distance between the insertions of the fifth superior and inferior finlets (FSIF), distance between the insertions of anal fin and the fifth inferior finlet (AFFIF), distance between the insertions of the second dorsal fin and the fifth inferior finlet (SDFFIF), distance between the insertions of anal fin and the fifth superior finlet (AFFSF), distance between the insertion of the fifth superior finlet and the fork of caudal fin (FSFFCF), distance between the insertion of the fifth inferior finlet and the fork of caudal fin (FIFFCF). An addition character of fork length (FL) was also measured. All characters were measured to the nearest 0.01 mm, except FL to the nearest 0.1 cm.
MGPCA was used to remove the influence of size from the raw data. The first principal component obtained is usually considered to be a vector describing size, while the remaining components relate to shape. The method of Corti et al. (1988) was used to examine the information on size contained in all components. In this method the relation coefficients of fork length were calculated, as an independent measure of size, on all principal components.
To obtain a size-free shape analysis, the component score from the MGPCA size vector was excluded in sequent analysis. The resulting measurements were analyzed using canonical variate analysis (CVA) to discriminate among samples. Morphological differences between three samples were tested using a randomization test (Solow,
Table 1. Sampling area and its code, sample size, the mean and range of fork length (FL, cm)
of Scomber japonicus off Taiwan
Sampling area Area code Sample size Range of FL Mean of FL
South of the East China Sea
SECS 54 20.8-28.5 24.92
Waters off
eastern Taiwan ET 53 21.5-28.2 24.91
North of the
1990). All specimens were randomly assigned to one of two samples. The new data set was then analyzed by discriminant analysis, and the cross-validation estimator (Pc) estimated. This estimator measured the proportion of individuals that were misclassified. Resampling was performed
1000 times, each with a different random permutation. This randomization test assesses the significance of misclassification rate by comparing the proportion of individuals (Po) that have been misclassified in the original data set to the proportion misclassified (Pc) in each randomized data Fig. 1. The common mackerel (Scomber japonicus) sampling areas off Taiwan. SECS, the South of the East
set. The proportion (P) of Pc values that are < Po was calculated. This P value can be interpreted in the same way as conventional tests of significance.
RESULT
The MGPCA run on the 16 characters in the three samples produced a clear “size” vector (with coefficients of similar magnitude and sign) associated with the largest eigenvalue (Table 2). The remaining components were considered as “shape” vectors (with coefficients of different magnitude and sign). The alternative measure of size (fork length) is highly correlated with the “size” component (r = 0.88), i.e. the first multiple group principal component (MGPC 1), and is uncorrelated with the “shape” components, i.e. MGPC 2-16 (Table 2), thereby confirming this interpretation of the components.
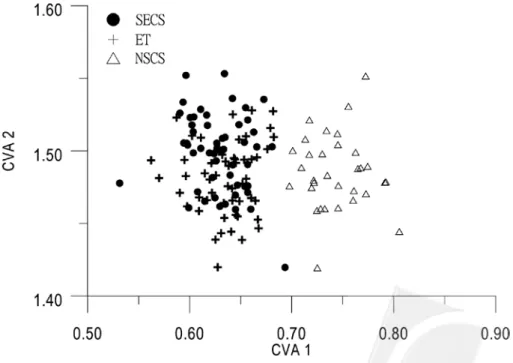
The first and second canonical variables obtained from CVA contribute 97% and 2% to the total variance respectively, and
explain the majority of the total variance. A plot of all specimens on the first two canonical scores is shown in Fig. 2; there is a noticeable overlap of individuals from the SECS and ET but all NSCS individuals are clearly separated from the SECS and ET specimens.
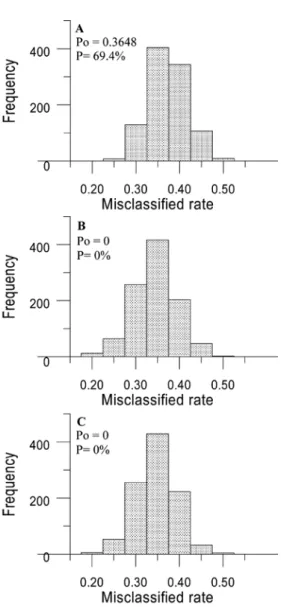
Three histograms of the 1000 values of the misclassification rate (Pc) between three samples are shown in Fig. 3. The value of Po between samples from the SECS and ET is 0.3648, which is a typical value in the randomization distribution (Fig. 3A). The P value is 69.4%, indicating that the morphological variation between SECS and ET samples is not significant. The Po values between the SECS and NSCS samples, and the ET and NSCS samples were 0. This Po value is extreme in magnitude compared with 1000 misclassification rates resulting from corresponding permuted data sets (Fig. 3B and 3C). The P value is 0, indicating that the morphological differences between the SECS and NSCS and the ET and NSCS samples are significant.
Fig. 2. Plot of the first two canonical variables for Scomber japonicus samples from the south of the East China Sea (SECS), the offshore waters of eastern Taiwan (ET) and the north of the South China Sea (NSCS).
Ta bl e 2. T he 1 6 ei ge nv ec to rs a nd e ig en va lu es , p er ce nt ag e of v ar ia nc e ex pl ai ne d by e ac h ei ge nv al ue a nd re la tio n co ef fic ie nt s (r) b et w ee n fo rk le ng th a nd 1 6 pr in cip le c om po ne nt s co re s ob ta in ed fr om M G PC A fo r S co m be r j ap on ic us o ff Ta iw an Ei ge nv ec to r Va ria bl e 1 2 3 4 5 6 7 8 9 10 11 12 13 14 15 16 M FD F 0. 21 1 -0 .0 36 -0 .0 62 0. 20 9 0. 31 9 -0 .0 72 0. 43 4 -0 .1 38 0. 18 6 0. 26 2 0. 43 8 0. 24 3 -0 .0 01 -0 .4 10 0. 18 1 0. 18 5 FD PF 0. 25 1 -0 .4 74 -0 .2 30 -0 .1 80 0. 48 7 0. 03 4 0. 06 7 0. 41 9 -0 .3 44 -0 .2 22 -0 .0 46 0. 10 6 -0 .0 40 0. 07 0 -0 .1 35 -0 .0 03 M PF 0. 21 5 -0 .0 40 0. 18 5 0. 19 6 0. 28 0 -0 .0 07 0. 42 6 -0 .2 69 0. 10 9 0. 06 0 -0 .3 82 -0 .4 18 0. 04 6 0. 43 3 -0 .0 16 0. 13 3 FS D F 0. 27 6 0. 22 2 0. 16 2 0. 22 1 0. 39 3 -0 .3 43 -0 .5 80 0. 01 2 0. 18 4 -0 .1 56 -0 .0 01 -0 .0 24 -0 .3 35 0. 00 5 0. 11 5 0. 05 4 SD AF 0. 29 3 -0 .3 21 -0 .4 12 -0 .4 53 -0 .1 15 0. 06 3 -0 .1 91 -0 .3 10 0. 37 5 0. 20 7 -0 .0 32 -0 .1 84 -0 .1 89 -0 .0 01 0. 14 9 -0 .0 86 PA F 0. 25 0 0. 07 4 -0 .2 70 0. 45 6 -0 .2 35 -0 .5 99 0. 03 6 0. 08 2 0. 09 9 -0 .3 36 -0 .0 43 0. 09 0 -0 .2 63 0. 04 8 0. 12 4 0. 08 1 FD AF 0. 26 3 0. 06 3 -0 .1 41 0. 26 1 -0 .0 68 0. 11 7 -0 .2 97 0. 10 7 -0 .4 46 0. 67 2 0. 04 7 -0 .1 50 0. 15 7 0. 09 7 0. 02 5 0. 08 4 PS D F 0. 27 0 -0 .0 09 -0 .1 12 0. 10 3 0. 02 1 0. 02 8 -0 .2 28 -0 .2 75 0. 13 2 -0 .2 34 -0 .0 83 0. 07 6 0. 64 4 -0 .2 15 -0 .4 62 0. 11 4 SD FF SF 0. 26 7 -0 .1 51 0. 21 7 -0 .0 09 -0 .2 80 -0 .1 37 0. 06 9 -0 .3 16 -0 .4 79 -0 .3 01 0. 29 9 -0 .3 72 -0 .2 19 -0 .2 33 -0 .0 57 0. 00 9 FS IF 0. 26 2 0. 59 5 -0 .4 76 -0 .1 86 -0 .1 34 -0 .3 83 0. 28 4 0. 19 4 -0 .0 72 0. 11 2 -0 .0 46 -0 .0 81 0. 01 8 0. 04 3 -0 .0 33 0. 00 8 AF FI F 0. 24 3 -0 .1 21 0. 27 2 0. 03 1 -0 .2 92 -0 .0 89 0. 10 8 0. 39 5 0. 31 7 0. 23 9 -0 .0 40 0. 00 1 -0 .2 81 -0 .0 94 -0 .5 80 0. 05 7 SD FF IF 0. 25 0 -0 .2 10 0. 23 9 0. 00 5 -0 .2 65 -0 .1 49 -0 .0 06 0. 41 6 0. 19 3 -0 .1 34 0. 01 9 -0 .1 49 0. 43 3 -0 .0 14 0. 54 7 0. 05 3 AF FS F 0. 25 3 -0 .1 10 0. 13 5 -0 .0 57 -0 .2 62 -0 .2 29 0. 02 9 -0 .2 64 -0 .1 76 0. 02 5 -0 .1 74 0. 70 4 -0 .0 62 0. 33 2 0. 10 3 0. 16 1 FS FF C F 0. 21 3 0. 29 5 0. 32 1 -0 .3 92 0. 12 4 0. 35 8 0. 02 2 0. 01 4 -0 .1 43 0. 07 4 -0 .0 40 0. 05 9 -0 .0 48 -0 .4 53 0. 14 4 0. 10 9 FI FF C F 0. 21 5 0. 26 9 0. 26 4 -0 .3 54 0. 11 2 0. 34 3 -0 .0 27 0. 01 9 0. 08 4 -0 .0 42 0. 56 9 0. 03 0 0. 11 1 0. 44 2 -0 .1 01 -0 .0 14 FL 0. 24 0 0. 03 8 0. 09 7 0. 15 1 0. 04 1 0. 00 3 0. 09 6 -0 .0 52 -0 .0 09 0. 05 3 -0 .0 63 0. 12 2 0. 06 1 -0 .0 44 0. 01 5 -0 .0 93 Ei ge nv al ue 0. 05 63 0. 00 18 0. 00 15 0. 00 13 0. 00 10 0. 00 07 0. 00 05 0. 00 03 0. 00 03 0. 00 02 0. 00 02 0. 00 01 0. 00 01 0. 00 1 0. 00 0 0. 00 0 % v ar ia nc e 0. 86 43 0. 02 85 0. 02 44 0. 02 11 0. 01 59 0. 01 20 0. 00 80 0. 00 61 0. 00 50 0. 00 35 0. 00 32 0. 00 25 0. 00 18 0. 00 15 0. 00 11 0. 00 04 r 0. 88 0. 32 0. 24 -0 .1 8 0. 00 0. 06 0. 07 -0 .0 5 0. 08 0. 05 0. 23 0. 10 .0 0 -0 .0 2 -0 .0 5 -0 .1 6
DISCUSSION
The result obtained from CVA reveals that three samples were clustered into two different groups. One included the SECS
and ET samples, and the other the NSCS. The randomization test indicates that the morphological variation between these two groups is significant. There appear to be two morphologically distinguishable stocks of common mackerel off Taiwan.
Although morphological studies have been proved valuable in providing insight into the discrimination of marine stocks, several factors may confound the analytical result of morphological relationship between geographical populations (Kinsey et al., 1994), e.g. allometric growth. In this study we attempted to minimize variances caused by possible parameters through the use of size adjustment technique and narrowing the differences of size among specimens. Restricting samples comparisons to specific range of body length may ignore ontogenetic variation within samples, and this information may be essential for significant portrayal of morphological differences between samples. However, this effect may be not significant in this study, because the body lengths of individuals used in each sample were not all equal.
Morphological features of an individual are not autonomous; changes in diverse aspects of morphology are coordinated (Zelditch et al., 1992). Therefore, unless specific characters are known to have a genetic basis, multivariate analysis of a set of phenotypic characters is regarded as a more appropriate method than the use of a single character for determining morphological relationships between populations (Thorpe, 1983).
To obtain reliable result of stock discrimination by morphological variation, sample size must be large enough (Junquera and Perez-Gandaras, 1993). Harris (1975) indicates that if the number of individuals minus the number of variables is greater than 30, then the sample can be considered large. This criterion was met in this study, and therefore the numbers of fish used in this study were adequate for this purpose.
Currents or water masses play an important role in the spatial distribution, movement and isolation of pelagic fish stocks (Tzeng, 1988). As the warm and Fig. 3. Frequency distribution of 1000
misclassifica-tion rate (Pc) estimated from (A) SECS and ET, (B) SECS and NSCS, and (C) ET and NSCS permuted samples. Po stands for the misclassification rate estimated from the original data set. P is the proportion of Pc < Po among 1000 permutations. SECS, the South of the East Chins Sea; ET, Eastern Taiwan; NSCS, the north of the South China Sea.
high-saline Kuroshio reaches the steep east-west continental shelf break in the East China Sea, it turns east and then northeast, with a minor part of the Kuroshio running over the shelf of the East China Sea (Hsueh et al., 1992). The cold and low-saline China coastal current flows from the north to the south and spreads to the northern Taiwan (Wu, 1982). These two currents may restrict the common mackerel not school migrating southward from the East China Sea into the Taiwan Strait, and concentrate on the waters of northeastern Taiwan. However, the path of Kuroshio from the east of Taiwan to the southern part of the East China Sea moves seaward in the spring and summer, and shoreward in the fall and winter (Sun, 1987). This seasonal shift of Kuroshio may allow a few individuals of common mackerel to migrate southward along eastern coast of Taiwan. As explained above, the Kuroshio and China coastal currents may explain the lack of morphological differences between the SECS and ET samples. However, a portion of the Kuroshio flows into Taiwan Strait along southwestern coast of Taiwan, and this branch may prevent mixing of individuals from NSCS and ET, and leading to the development from different morphological characters. The sampling areas in this paper were mostly overlaid by Kuroshio water masses, but the north and south of Taiwan were also covered by China coastal water and the water masses of the South China Sea, respectively. Differences in water masses between sampling areas may be partly responsible for the morphological variation.
Variation in morphological characters may be affected by environment factors. Stock identification, therefore, based on morphological characters must be confirmed by genetic evidence to verify that the morphological differences reflect some degree of reproductive isolation rather that simply environmental differences (Pepin and Carr, 1992). Therefore, further verification of the stock structure for common mackerel off Taiwan may be essential.
ACKNOWLEDGEMENTS
We would like to express appreciation to our staff, Demersal Research Center, Institute of Oceanography, National Taiwan University, for assistance in collecting samples.
REFERENCES
Begg, G. A., K. D. Friedland and J. B. Pearce. (1999). Stock identification and its role in stock assessment and fisheries management: an overview. Fish. Res., 43: 1-8.
Cadrin, X. (2000). Advances in morphometric identification of fishery stock. Rev. Fish. Bio.
Fish., 10: 91-112.
Corti, M., R. S. Thorpe, L. Sola, V. Sbordoni and S. Cataudella (1988). Multivariate morphometrics in aquaculture: a case study of six stocks of the common carp (Cyprinus carpio) from Italy. Can. J. Fish. Aquat. Sci.,
45: 1548-1554.
Harris, R. J. (1975). A primer of multivariate statistics. Academic Press, 332 pp.
Hiyama, Y., M. Yoda and S. Ohshimo (2002). Stock size fluctuations in chub (Scomber japonicus) in the East China Sea and the Japan/East Sea. Fish. Oceanogr., 11(6):
347-353.
Hsueh, Y., J. Wang and C. S. Chern (1992). The intrusion of the Kuroshio across the continental shelf northeast of Taiwan. J.
Geophys. Res., 97: 14323-14320.
Junquera, S. and G. Perez-Gandaras (1993). Population diversity in Bay of Biscay anchovy (Engraulis encrasicolus L. 1785) as revealed by multivariate analysis of morphometric and meristic characters. ICES J. Mar. Sci., 50:
383-391.
Kinsey, S. T., T. Orsoy, T. M. Bert and B. Mahmoudi (1994). Population structure of the Spanish sardine Sardinella aurita: natural morphological variation in a genetically homogenous population. Mar. Biol., 118:
309-317.
Lin, Y. Y. (1998). Population genetic structure of Scomber australasicus and Scomber japonicus fisheries resources. Master thesis of Institute of Oceanography, National Taiwan University, 59pp. (In Chinese with English
abstract)
Pepin, P. and S. M. Carr (1992). Morphological, meristic, and genetic analysis of stock structure in juvenile Atlantic cod (Gadus morhua) from the Newfoundland shelf. Can.
J. Fish. Aquat. Sci., 52: 1924-1933.
Solow, A. R. (1990). A randomization test for misclassification probability in discriminant analysis. Ecology, 71: 2379-2382.
Strauss, R. E. and F. L. Bookstein (1982). The truss: body from reconstruction in morpho-metrics. Syst. Zool., 31: 113-135.
Sun, X. (1987). Analysis of the surface path of the Kuroshio in the East China Sea. In Essays on the investigation of Kuroshio (X. Sun, ed.). Ocean Press, Beijing, 1-14.
Thorpe, R. S. (1983). A biometric study of the effects of growth on the analysis of geographical variation: tooth number in Green geckos (Reptilia: Phelsuma). J. Zool., 201:
13-26.
Thorpe, R. S. (1988). Multiple group principal components analysis and population differentiation. J. Zool. Lond., 216: 37-40.
Tzeng, T. D. (2004). Morphological variation between populations of spotted mackerel (Scomber australasicus) off Taiwan. Fish.
Res., 68: 45-55.
Tzeng, W. N. (1988). Availability and population structure of spotted mackerel, Scomber australasicus, in the adjacent waters of Taiwan. Acta Oceanogr. Taiwanica, 19:
132-145.
Wu, B. (1982). Some problems on circulation study in Taiwan Strait. Taiwan Strait, 1: 1-7.
Zelditch, M. L., F. L. Bookstein and B. L. Lundrigan (1992). Ontogeny of integrated skull growth in the cotton rat Sigmodon fulviventer.
台灣附近海域產白腹鯖
(Scomber japonicus)之
形態形質變異
曾宗德1*.葉顯椏2 (2007年5月1日收件;2007年6月15日接受) 利用多變量形態形質的變異研析台灣附近海域產白腹鯖之系群結構。本研究分別於 東海南部(SECS)、台灣東部水域(ET)及南海北部(NSCS)等三海域,共採集139尾樣本用 於分析。各樣本魚先以框架法(Truss method)量測16個形態形質;再利用多群主成份分析法(Multiple-group principal components analysis)來移除樣本大小差異對分析之影響;
校正後之資料則使用直交變值分析法(Canonical variate analysis)加以分析,結果顯示三
個地區可分為兩個群集;一含SECS及ET兩樣本;一含NSCS樣本。另置換排列分析法 (Randomization test)檢定兩群集間之形態形質變異為顯著。由以上結果顯示,台灣附近海 域可能出現有兩個不同形態的系群存在,但此結果需進一步加以驗証。 關鍵詞:白腹鯖,形態變異,大小校正,族群結構。 1 私立樹德科技大學 通識教育學院 自然科學組,高雄縣 824,台灣 2 國立台灣大學 海洋研究所 生物及漁業組 台北 106,台灣 * 通訊作者