國
立
交
通
大
學
應用化學系分子科學碩士班
碩
士 論 文
飛秒雷射誘發胺基酸與蛋白質於氣液介面結晶化之研究
Femtosecond Laser-Induced Crystallization of Amino Acid
and Protein at the Air/Solution Interface
研 究 生:劉 宗翰 (Tsung-Han Liu)
指導教授:增原 宏 博士 (Dr. Hiroshi Masuhara)
飛秒雷射誘發胺基酸與蛋白質於氣液介面結晶化
Femtosecond Laser-Induced Crystallization of Amino Acid
and Protein at the Air/Solution Interface
研 究 生:劉宗翰
Student:Tsung-Han Liu
指導教授:增原宏 博士
Advisor:Dr. Hiroshi Masuhara
國立交通大學
應用化學系分子科學碩士班
碩士論文
A Thesis
Submitted to M. S. Program
Institute of Molecular Science
Department of Applied Chemistry
National Chiao Tung University
in partial Fulfillment of the Requirements
for the Degree of
Master
in
Molecular Science
July 2011
Hsinchu, Taiwan, Republic of China
i
飛秒雷射誘發胺基酸與蛋白質於氣液介面結晶化之研究
研究生:劉宗翰 指導教授:增原宏 博士
國立交通大學
應用化學系分子科學碩士班
摘要
使用雷射誘使結晶化的發生已成為現今取得分子結晶相當重要的技術,
特別是已於 2002 年被成功示範的飛秒雷射誘使結晶化技術,現正往蛋白質
結晶迅速發展。當高強度的雷射脈衝被聚焦於過飽和水溶液之中,水的多
光子吸收現象發生,並對周圍環境產生機械性壓力波,最後致使溶質結晶。
於本研究中,我們探討飛秒雷射參數如脈衝能量、脈衝頻率與聚焦位置對
結晶化與取得結晶的影響,並示範利用聚焦雷射於溶液表面可有效提升分
子結晶的機率。
在第一部分,我們示範飛秒雷射誘發甘胺酸過飽和溶液結晶化並檢驗雷
射參數與結晶機率、結晶形貌和晶相的關係。脈衝能量與頻率的依存性實
驗結果顯示結晶形貌與數量主要是由水的多光子吸收現象引發的空穴氣泡
產生頻率所決定。此外,藉由聚焦雷射脈衝於空氣溶液介面可大幅增進結
ii
晶機率,其原因被推斷可能為甘胺酸分子於介面的分子吸附,並依此推論
以我們所知首次成功示範使用單發雷射脈衝誘發甘胺酸單晶的產生。
於第二部分,我們以類似上述的方式示範飛秒雷射誘發於蛋白質結晶學
中最標準的酵素與蛋白質-溶菌酶過飽和溶液結晶化。我們發現相較於聚焦
雷射在溶液液滴中與自然結晶的條件下,聚焦雷射在溶液液滴的空氣溶液
介面可顯著地增進結晶機率。另從各條件下取得之結晶的 X-ray 繞射分析結
果可得知其晶格結構並無差異。儘管有研究指出蛋白質會吸附於溶液表面
且會致使蛋白質變性,但實驗結果顯示鹽析效應可穩定蛋白質於溶液介面
的結構,而相關的當代研究亦支持此結果。
目前的研究結果表示於飛秒雷射誘發結晶化中使用雷射照射溶液表面
可改善現存的結晶技術。分子在溶液表面成核的初期階段的進一步光譜動
態研究可望從此結晶方法建立新穎的表面/介面分子科學。
iii
Femtosecond Laser-Induced Crystallization of
Amino Acid and Protein at the Air/Solution Interface
Student: Tsung-Han Liu Advisor: Dr. Hiroshi Masuhara
M. S. Program
Institute of Molecular Science
Department of Applied Chemistry
National Chiao Tung University
Abstract
Laser-induced crystallization is now becoming an indispensable technique to obtain
molecular crystal. Particularly, femtosecond (fs) laser-induced crystallization was
demonstrated in 2002 and is developing especially toward protein crystallization technique.
When an intense fs laser pulse is focused into a supersaturated solution, multiphoton
absorption of solvent occurs and induces mechanical stress to the surrounding area, which
results in crystallization of solute. In this study, we explore how fs laser parameters such as
pulse energy, repetition rate, and focal position affect crystallization and obtained crystals,
and then demonstrate that solution surface irradiation of fs laser pulses can improve molecular
crystallization probability drastically.
Firstly, fs laser induced crystallization of glycine from the supersaturated solution is
demonstrated and relations among laser parameters and crystallization probability, crystal
iv
show that the frequency of cavitation bubble generation induced by multiphoton absorption of
water mainly determines crystal morphology and number. Furthermore, significant increase of
crystallization probability is also demonstrated by focusing fs pulses at the air/solution
interface, whose mechanism may be ascribed to molecular adsorption at the interface. Based
on the inference, we have succeeded in single glycine crystal formation induced by single fs
pulse irradiation for the first time as far as we know.
Secondly, we demonstrate fs laser induced crystallization of lysozyme as the most
standard enzyme and protein in protein crystallography in the similar manner to glycine. It is
revealed that irradiation at the air/solution interface of the solution droplet much improved the
crystallization probability, compared with that of fs laser irradiation inside the solution and
that of spontaneous crystallization. X-ray diffraction analysis of the obtained crystals clarified
that crystal structure was the same under each crystallization condition. It is known that
protein can be adsorbed and be localized at the solution surface leading to the denaturation.
However, this result indicates that the salting-out effect can stabilize the structure even at the
surface, which is contemporarily reported in elsewhere.
The present result clearly shows that utilizing solution surface irradiation in the fs
laser-induced crystallization sharpens the existent crystallization technique. Further
spectroscopic dynamics study on the early stage of molecular nucleation occurring at the
surface is promising to establish novel interface/surface molecular science from this
v
Acknowledgement
Firstly, I would like to sincerely express my appreciation to Prof. Hiroshi Masuhara
(Department of Applied Chemistry and Institute of Molecular Science, National Chiao Tung
University) for supervising my research works during these two years. I feel so fortunate to
have met him and his team, and have a chance to be one of his first students in Taiwan. Prof.
Masuhara is always patient and willing to share opinions with me. I really learned a lot from
his thinking way and attitude.
I deeply appreciate Dr. Takayuki Uwada (Department of Applied Chemistry and Institute
of Molecular Science, National Chiao Tung University) and his direction. Dr. Uwada has
given many lectures related to my research work, and is always willing and eager to assist me
in conducting experiments and give comments on scientific writing. I am much indebted to
him for his great help.
I wish to thank Prof. Atsushi Miura, Dr. Anwar Usman, Dr. Ken-ichi Yuyama
(Department of Applied Chemistry and Institute of Molecular Science, National Chiao Tung
University) and Prof. Teruki Sugiyama (Instrument Technology Research Center, National
Applied Research Laboratories). Prof. Miura takes care of not only laboratory affairs but also
daily lives of students. Dr. Usman helped me a lot from the initial stage of my study about
crystallization. Dr. Yuyama participated in several meeting with students, and accordingly
gave some appropriate comments. Prof. Sugiyama gave countless specific comments and
advices on crystallization.
vi
(Faculty of Science and Engineering, Kinki University, Japan), Prof. Yaw-Kuen Li
(Department of Applied Chemistry and Institute of Molecular Science, National Chiao Tung
University), Prof. Chun-Jung Chen and Mr. Ting-Wei Jiang (Life Science Group, Scientific
Research Division, National Synchrotron Radiation Research Center and Department of
Physics, National Tsing Hua University). With their indispensible contributions to the related
works, this master thesis becomes more complete and fruitful.
Many thanks to senior members inclusive of Ms. Wen-Yu Lee, Mr. Ping-Yu Hee and Ms.
Jing-Ru Tu, my classmate Mr. Chong-Wei Huang, and junior members inclusive of Mr.
Shun-Fa Wang, Mr. Wei-Yi Chiang, Mr. Tsu-Wei Hsu, Ms. Ling-Ting Huang, Mr. Yan-Hua
Huang and Mr. Ching-Hsu Tseng whose accompany with me and help me a lot in LBNS Lab.
I will certainly cherish the pleasant memories with all the members in LBNS Lab.
Thanks to Prof. Youichiroh Hosokawa, Ms. Kurisu, Mr. Iino (Graduate School of
Materials Science, Nara Institute of Science and Technology, Japan), and former NAIST
members inclusive of Dr. Rungsimanon, Dr. Maezawa, Mr. Ishiguro, Mr. Hiraoka and Ms.
Matsui. We had two workshops and exchanged opinions frequently.
Finally, I would like to express my appreciation to my parents. Although I was not good
at physics in senior high school, I accidentally entered Department of Electrophysics. After I
minored in applied chemistry, they recognized my decision to change major from physics to
physical chemistry from master course and support me until now. In fact, after master course
vii
Table of Contents
摘要 ... i
Abstract ... iii
Acknowledgement ... v
Table of Contents ... vii
List of Figures ... x
List of Tables ... xiv
Chapter 1 Introduction ... 1
1.1 Introduction to conventional crystallization methods ... 4
1.2 Introduction to crystallization process ... 6
1.3 Light-induced crystallization ... 8
1.3.1 Photochemical reaction-induced nucleation ... 8
1.3.2 Kerr effect-induced nucleation ... 9
1.3.3 Laser trapping crystallization ... 10
1.3.4 Molecular assembling induced by optical trapping ... 12
1.3.5 Femtosecond laser-induced crystallization ... 12
1.4 Motivation ... 13
Chapter 2 Principle ... 14
Chapter 3 Experiment ... 23
3.1 Experimental setup ... 23
3.1.1 Femtosecond laser light source ... 23
viii
3.1.3 Confocal Raman microspectroscopic system ... 28
3.1.4 Surface tension measurement ... 29
3.1.5 X-ray diffraction ... 31
3.2 Sample preparation ... 32
3.2.1 Supersaturated glycine aqueous solution... 32
3.2.2 Supersaturated lysozyme aqueous solution ... 33
3.2.2.1 Acetic acid-sodium acetate buffer aqueous solution ... 33
3.2.2.2 Supersaturated lysozyme aqueous solution ... 33
Chapter 4 Glycine Crystallization ... 35
4.1 Introduction ... 35
4.2 Results... 37
4.2.1 Pulse energy dependence ... 38
4.2.2 Repetition rate dependence ... 39
4.2.3 Focal position dependence ... 41
4.2.4 Concentration dependence ... 43
4.2.5 Exposure time dependence ... 44
4.2.6 Characterization ... 45
4.2.6.1 Confocal Raman microspectroscopic measurement ... 46
4.2.6.2 Mass spectrometry ... 47
4.2.6.3 X-ray Analysis ... 48
4.3 Discussion ... 49
4.3.1 Pulse energy dependence ... 49
4.3.2 Repetition rate dependence ... 50
4.3.3 Focal position dependence ... 52
ix
Chapter 5 Application to Protein ... 54
5.1 Introduction ... 54
5.2 Results... 56
5.2.1 Focal position dependence ... 56
5.2.2 Crystallization agent concentration dependence... 58
5.2.3 Characterization ... 59
5.2.3.1 X-ray analysis ... 60
5.3 Surface tension measurement... 65
5.4 Discussion ... 66
5.5 Summary ... 68
Chapter 6 Conclusion ... 69
Chapter 7 Spectroscopic Investigation on Tsunami Crystallization and Role of Interface, and Future Scope ... 71
x
List of Figures
Chapter 1 Introduction
Fig. 1.1 Vapor diffusion for protein crystallization. (a) hanging drop method (b) sitting drop
method ... 6
Fig. 1.2 Schematic illustration of crystal formation from a disordered medium to a highly
ordered phase ... 6
Fig. 1.3 Schematic illustration of the formation of ordered crystalline nuclei as a result of the
superposition of a density and a structure fluctuations ... 7
Fig. 1.4 (a) Mechanism of the photochemically induced nucleation of lysozyme (b)
enhancement of protein crystallization by a photochemical reaction ... 8
Fig. 1.5 Diagram showing the ray optics of a spherical Mie particle trapped in water by the
highly convergent light of a single-beam gradient force trap... 10
Chapter 2 Principle
Fig. 2.1 Schematic illustration of multiphoton absorption ... 18
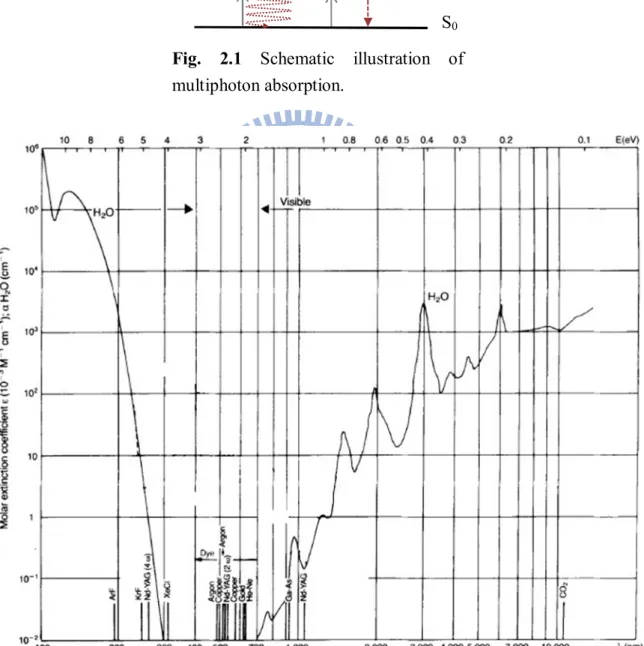
Fig. 2.2 Absorption coefficient spectrum of water, together with the wavelength positions of
the most widely used lasers ... 18
Fig. 2.3 Gibbs free energy versus specific volume of a pure substance for several temperatures
starting at the saturation temperature up to the spinodal temperature ... 19
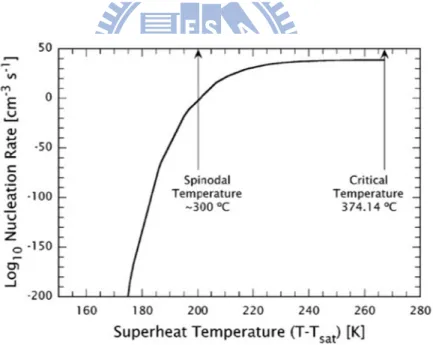
Fig. 2.4 Variation of vapor bubble nucleation rate with superheat temperature ... 19
Fig. 2.5 Schematic illustration of laser tsunami in water ... 19
Fig. 2.6 Plasma, shock wave, and cavitation bubble produced by Nd:YAG laser pulses of
xi
Fig. 2.7 Experimentally determined shock wave pressure ... 20
Fig. 2.8 Hydrophone signals measured at a distance of 10 mm from the emission center of the shock waves ... 20
Fig. 2.9 The diameter of the cavitation bubble in water as a function of time ... 21
Fig. 2.10 Spatially limited transient pressure generated by femtosecond laser can induce molecular nucleation in supersaturated solution ... 21
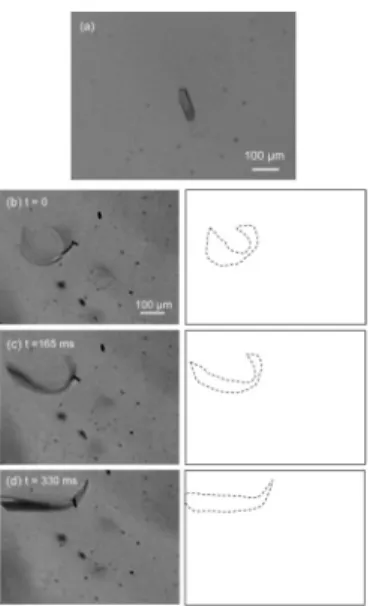
Fig. 2.11 Microscopic images of generated anthracene crystals (a) and a growth process of a bending film-like crystal created at the surface of a large laser-induced bubble (b-d) ... 22
Chapter 3 Experiment Fig. 3.1 Picture of mode-locked Ti:sapphire laser, Tsunami ... 24
Fig. 3.2 Absorption and emission spectra of Ti:sapphire ... 25
Fig. 3.3 The mode-locking principle in Tsunami ... 25
Fig. 3.4 Picture of Ti:sapphire regenerative amplifier system, Spitfire Pro ... 25
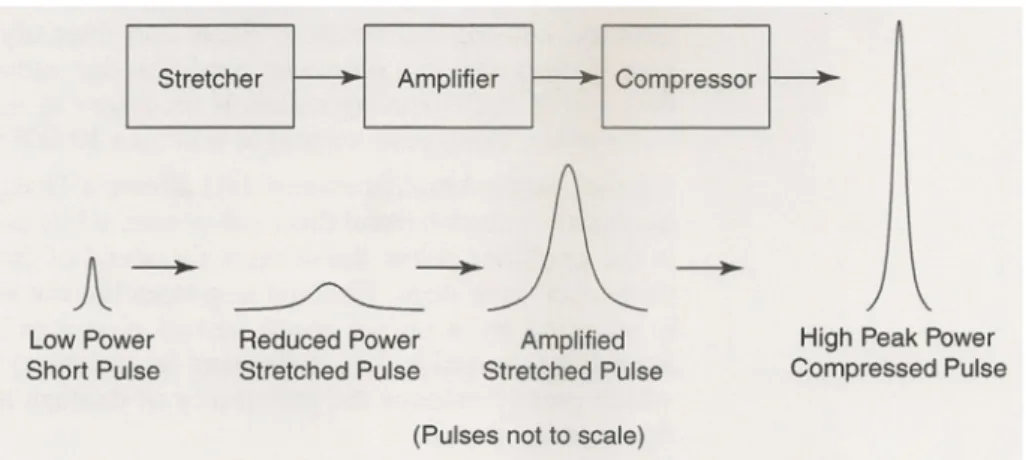
Fig. 3.5 The schematic illustration of CPA principle ... 26
Fig. 3.6 Laser light source and microscopic system for crystallization ... 27
Fig. 3.7 Picture of inverted microscope and other attachments ... 27
Fig. 3.8 Reflectance spectrum of the dichroic mirror used in the inverted microscope ... 27
Fig. 3.9 Transmittance spectrum of the objective lens used in the inverted microscope ... 28
Fig. 3.10 Illustration of the du Noüy ring method ... 30
Fig. 3.11 Illustration of the capillary method ... 30
Fig. 3.12 Picture of 1.5 ml glass bottle with 0.5 ml glycine solution inside ... 32
Fig. 3.13 Picture of crystallization plate ... 34
Chapter 4 Glycine Crystallization Fig. 4.1 The chemical structure of glycine ... 35
xii
Fig. 4.2 The shapes of (a) -polymorph and (b) -polymorph glycine crystals ... 36
Fig. 4.3 Pulse energy (J/pulse) dependence on glycine crystallization probability (%). ... 38
Fig. 4.4 The CCD image of cavitation bubble generation ... 39
Fig. 4.5 (a) Crystallization probability (%) and crystal morphology dependence on repetition
rate (Hz). (b) Images obtained from CCD camera. (c) Picture taken by general camera. ... 40
Fig. 4.6 The crystallization probability (%) depending on the repetition rate (Hz) at the
air/solution interface or glass/solution interface. ... 42
Fig. 4.7 The crystallization probability (%) depending on the distance from the air/solution
interface (mm). ... 42
Fig. 4.8 The crystallization probability (%) depending on the repetition rate (Hz) at 3.0 M, 3.5
M and 4.0M ... 43
Fig. 4.9 The crystals obtained with different exposure times... 45
Fig. 4.10 (a) Raman image of obtained multiple crystals (b) Raman spectrum of obtained
glycine crystal ... 46
Fig. 4.11 Mass spectra of standard sample and laser-induced crystal ... 47
Fig. 4.12 Glycine molecules in one unit cell. (Single crystal case) ... 49
Fig. 4.13 Illustration to explain the morphology difference because of the different repetition
rates ... 50
Chapter 5 Application to Protein
Fig. 5.1 Three-dimensional conformation of hen egg white lysozyme (HEWL) ... 55
Fig. 5.2 The lysozyme crystal shape ... 55
Fig. 5.3 Crystallization probabilities and crystal images of lysozyme under spontaneous
crystallization, irradiation inside the solution and irradiation at the air/solution interface (NaCl
conc.: 10 mg/ml) ... 57
xiii
irradiation inside the solution and irradiation at the air/solution interface (NaCl conc.: 10, 20,
30 mg/ml) ... 58
Fig. 5.5 The reconstructed lysozyme molecular structures from the X-ray analysis data under different laser conditions (NaCl conc.: 10 mg/ml) ... 64
Fig. 5.6 Electron density distribution of one of -helices under different laser conditions (NaCl conc.: 10 mg/ml)... 64
Fig. 5.7 Electron density distribution of one of disulfide bonds under different laser conditions (NaCl conc.: 10 mg/ml)... 64
Fig. 5.8 Lysozyme concentration (mg/ml) dependence on surface tension ... 65
Fig. 5.9 NaCl concentration (mg/ml) dependence on surface tension ... 65
Fig. 5.10 Conformation changes of protein take place at interfaces... 66
Fig. 5.11 Salting out can keep lysozyme molecules refolding and can localize them even at the air/solution interface ... 67
xiv
List of Tables
Chapter 4 Glycine Crystallization
Table 4.1 The lattice constants and R-factors of glycine crystals with different
morphologies…...………...49
Chapter 5 Application to Protein
Table 5.1 The lattice constants of lysozyme crystals under various experimental
1
Chapter 1
Introduction
Laser light is regarded as a monochromatic light source showing high energy density
with high degree of spatial and temporal coherence. Laser beam can be focused to a very tiny
spot, and can be delivered at a large distance with extremely low divergence [1]. Therefore,
laser exhibits high potential and has been applied widely in diverse fields inclusive of physics,
chemistry, material science and so on. Undoubtedly, laser also plays an essential role in
various contemporary and interdisciplinary studies.
As one of laser applications, photoetching, an essential technique for microfabrications,
was first demonstrated when a pulsed ultraviolet excimer laser light with high enough
intensity was irradiated at a surface of organic polymer film and some morphological changes
were induced [2, 3]. Laser ablation was given to describe this phenomenon induced by pulse
laser irradiation at a solid material with intensity higher than a threshold [4]. If laser ablation
takes place in liquid or gaseous phase, the phenomenon is usually described as optical
breakdown. In fact, optical breakdown can be generated in water when focused femtosecond
2
transition of water from liquid to gas gives transient mechanical stress. The optical breakdown
has been employed for biological applications such as cellular surgery [6, 7], and the
consequent mechanical stress is applied to cellular arrangement or micropatterning [8] and
nanoparticle injection to single cells [9]. Nowadays, the application of optical breakdown has
been expanding to the studies on crystallization and crystal growth and has received much
attention [10-13].
Crystal is a solid material composed of atoms, molecules or even macromolecules which
are three-dimensionally arranged in a long-range order, and crystallization is the process from
atoms or molecules to a crystal. Making crystal is not only an important technique for
purification and separation, but also an indispensable process in determining crystal structures
both of inorganic solid-state materials and biological molecular crystals at atomic resolution
with X-ray diffraction analysis [14].
Among the biological macromolecules inclusive of proteins, nucleic acids and
carbohydrates, proteins constitute the largest group. Enzymes are the most diverse class of
proteins because nearly every chemical reaction in a cell requires a specific enzyme. In order
to understand cellular processes or design new structure-based drugs or pharmacological
3
and other macromolecules are undoubtedly vital [15, 16]. X-ray diffraction of crystals and
nuclear magnetic resonance (NMR) are two widely-used techniques for the structural
determination of macromolecules at atomic resolution. While NMR does not require protein
crystals and provides more detailed information on the dynamics of the molecule in question,
it can be used only for biopolymers with molecular weight of less than 30,000. X-ray
crystallography can be applied to compound with molecular weight up to at least 106. For
many proteins, the difference is decisive in favor of X-ray diffraction [15]. Accordingly, a
major challenge to the full exploitation of X-ray diffraction technique is that the protein must
first be crystallized [16].
Protein crystallization is mainly a trial-and-error procedure in which protein is slowly
precipitated from its solution, so obtaining suitable single crystals is the least understood step
in the X-ray structural analysis of a protein [15]. As a matter of fact, there are still some
additional requirements for the crystallinity and size of the crystals if precise analysis results
are more likely to be obtained [17]. Moreover, since crystallization is a rate-limiting step from
single molecules to a crystal for some proteins such as membrane proteins which can be
attributed to inherent protein flexibility and to conformational inhomogeneity, it is also
necessary to shorten the crystallization time and elevate the crystallization possibility
4
techniques have received much attention and have been proposed continually to try to satisfy
the present situation.
1.1 Introduction to conventional crystallization methods
Because amino acids are polar molecules, most of them can be dissolved well in water
rather than organic solvent. Accordingly, water is often used as solvent in crystallization. In an
aqueous solution at pH near isoelectric point, amino acids are in zwitterionic form, and their
zwitterionic property is still kept in crystal. For crystallization, general methods such as
cooling down saturated solution slowly, evaporating saturated solution slowly with adding
polar solvent such as alcohol, adding poor solvent into saturated solution, and adjusting pH to
lower the solubility of the solution are often used. If crystals with high quality are more likely
to be obtained, slow crystal growth at low supersaturated degree is preferred [14].
The history of protein crystal growth can be traced back about more than 150 years ago.
The first observed protein crystallization was published by Hünefeld in 1840, and the protein
was hemoglobin from earthworm. The crystals were obtained when the blood of an
earthworm was pressed between two slides of glass and allowed to dry very slowly. The
above description revealed that protein crystals can be obtained by controlling evaporation of
5
dehydration which is one of the most acceptable concepts until now. Other conventional
methods such as temperature variation under otherwise constant conditions, the use of salt or
organic solvents as precipitating or crystallizating agents, and the use of metal ions were also
developed in the following decades [19].
The oldest crystallization technique is batch method which has been used for proteins
and nucleic acids crystallization for over 150 years and is regarded as one of the most reliable
crystallization methods. Batch method is attractive and convenient because of its inherent
simplicity and reproducibility. It requires nothing more than direct mixing of an unsaturated
protein solution with a precipitant solution and waiting for a period of time until spontaneous
nucleation commences. For instance, lysozyme, the most widely studied protein for protein
crystallization, is easily crystallized by batch method [19].
The most commonly used technique for protein crystallization is vapor diffusion
inclusive of hanging drop and sitting drop methods. Both of these two methods contain
sample solution and reservoir solution, and require a closed environment. At the early stage,
the sample solution has insufficient precipitate concentration for crystallization. After vapor
diffusion of solvent from sample solution to reservoir solution takes place and vice versa, the
6
Fig. 1.2 Schematic illustration of crystal formation from a
disordered medium to a highly ordered phase [20]. amounts of solution are quite different between these two [14].
1.2 Introduction to crystallization process
Fig. 1.2 shows a schematic illustration of crystal formation from a disordered medium.
Compared with the final crystal phase, the initial disordered phase has higher free energy.
Crystallization starts from nucleation, in which a tiny embryo of a highly ordered phase with
lower free energy is formed. Nucleation seldom takes place spontaneously at unsaturated
concentration since it is relatively difficult for molecules to overcome some energy barriers
between these two phases. However, at high enough supersaturation, the energy barriers
decrease and the initial state becomes unstable, so that a tiny fluctuation can lead to the
Fig. 1.1 Vapor diffusion for protein crystallization. (a) hanging drop
method (b) sitting drop method
7
appearance of the new phase [20].
An illustration of phase separation during nucleation in detail is shown in Fig. 1.3. There
are two possible pathways from individual molecules to nucleation. When the size of
molecule accumulation increases to a critical size, the ordered nucleus forms and starts to
form crystal. On the other hand, dense liquid droplet or liquid-liquid phase separation
formation can be observed if the size of molecule accumulation continuously increases [20].
Fig. 1.3 Schematic illustration of the formation of ordered
crystalline nuclei as a result of the superposition of a density and a structure fluctuations [20].
8
1.3 Light-induced crystallization
Light-induced crystallization can be realized with various light sources through different
mechanisms such as photochemical and nonphotochemical (or photophysical) processes. The
used light source can be Xe lamp, continuous wave laser or pulse laser at different
wavelengths ranged from UV region to NIR region.
1.3.1 Photochemical reaction-induced nucleation
Okutsu et al. have reported photochemical reaction-induced nucleation of anthracene
[21], hen egg-white lysozyme (HEWL) [22], thaumatin [23], and ribonuclease A (RNaseA)
[24]. In the lysozyme crystallization experiment, they exposed UV light (wavelength; 280,
300 and 400 nm) from Xe short arc lamp (wavelength; 200-800 nm, USHIO UXL-300D) to
Fig. 1.4 (a) Mechanism of the photochemically induced
nucleation of lysozyme (b) enhancement of protein crystallization by a photochemical reaction [22].
9
supersaturated but metastable lysozyme solution and produced photochemical intermediate
(Fig. 1.4). Since the photoproduct has lower solubility in mother solution, it works as a
nucleus and triggers crystallization eventually [22]. Okutsu et al. gave a representative
demonstration of photochemical reaction-induced nucleation. However, it is not known for
sure how radical formation affects the purity of the obtained protein crystal.
1.3.2 Kerr effect-induced nucleation
Garetz et al. discovered that intense nanosecond NIR laser pulses (pulse duration; 20 ns,
repetition rate; 10 Hz, wavelength; 1.06 m) can induce nucleation of urea solution in 1996.
This phenomenon was named as nonphotochemical laser-induced nucleation (NPLIN).
Because it was observed that the initially forming needle-shaped crystals tend to be aligned
parallel to the electric field vector of the light, they proposed that the electric field-induced
realignment of urea molecules results in cluster formation and this mechanism is known as the
optical Kerr effect [25]. Nucleation of glycine [26] was also demonstrated, and the polymorph
of glycine was controlled by changing polarization of laser beam [27] or by additionally
10
1.3.3 Laser trapping crystallization
Continuous wave (CW) laser-induced crystallization has been developed very fast
recently. Fig. 1.5 shows the principle of laser trapping. When a highly focused laser beam
passes through sphere-like medium with a greater refractive index from surrounding, the
sphere-like medium acts like a weak positive lens and it will be moved toward the focal point
by a substantial net backward trapping force [29]. In laser trapping crystallization, tightly
focused CW NIR laser beam is employed to gather molecules or clusters, forming a high
concentration area at the focal spot, where the nucleation is eventually achieved. Since laser
trapping is actually a dynamic process against diffusion of trapped molecules or clusters from
the focal spot, in order to reach stable laser trapping condition, laser irradiation at a certain
point for a period of time is necessary. Therefore, selecting laser wavelength at which both of
solvent and solute have merely no absorption is quite important. Photons at NIR wavelength
Fig. 1.5 Diagram showing the ray optics of a spherical Mie
particle trapped in water by the highly convergent light of a single-beam gradient force trap [29].
11
have lower energy and can be less absorbed by biological molecules or systems. However,
water as a common solvent is not applicable since it has vibrational absorption over 1000 nm
[30]. The absorption of water generates a serious problem in temperature elevation which
increases the solubility of solution, and crystallization becomes more difficult. In order to
solve this problem, it is necessary to replace water with deuterated water (heavy water) as
solvent in this crystallization method.
Sugiyama et al. has firstly demonstrated crystallization of glycine by an intense focused
CW-YVO4 laser beam (wavelength; 1064 nm) at the air/solution interface. It was observable
by a CCD camera that the glycine crystal grew from focus to a certain size within a few
seconds [31]. Furthermore, Rungsimanon et al. have investigated the method to control
glycine phase by tuning laser power. It was found that the competing result between photon
pressure and temperature elevation at a certain high laser power led to the probability increase
to find -polymorph glycine crystal, which is not available under ambient conditions [32]. On
the other hand, Yuyama et al. have demonstrated the preparation of a millimeter-scale dense
liquid droplet of glycine induced by laser trapping effect. After focusing a CW NIR laser
beam at the glass/solution interface of a thin film of its supersaturated heavy water solution
and forming the droplet, they found that crystallization starts immediately just after the focal
12
possibly the early stage of the multistep crystallization process and plays an important role in
photon pressure-induced crystallization of glycine [33].
1.3.4 Molecular assembling induced by optical trapping
Tsuboi et al. reported that the aggregation of lysozyme as nucleus induced by optical
trapping in solution can trigger nucleation [34]. They also observed the assembling of amino
acids (glycine, proline, serine and alanine) induced by laser trapping in solution, and
considered that the observed glycine assembling may be experimentally verified as a
precursor for the crystal nucleus by Sugiyama et al. [35]. The differences between inducing
molecular aggregation as nucleus and forming a local high concentration area by trapping
laser are the focal position and the necessary time for observation. Molecular assembling is
induced in solution and takes several hours for observation, whereas laser trapping
crystallization can only be achieved at the air/solution interface and the crystal grows within
several seconds.
1.3.5 Femtosecond laser-induced crystallization
Femtosecond laser-induced crystallization of HEWL was firstly demonstrated in 2003 by
13
tosylate) [11], anthracene [13] and glucose isomerase (GI) [36] crystallizations were also
reported in following years. The mechanism will be introduced in detail in Chapter 2.
1.4 Motivation
In this work, we have focused on femtosecond laser-induced crystallization and tried to
clarify how laser parameters inclusive of pulse energy, repetition rate, focal position and
exposure time affect the crystallization probability, crystal morphology and crystalline phase.
Firstly, we demonstrated glycine crystallization since glycine crystal shows several
polymorphs and is well-studied in the field of crystal chemistry [14]. Then we applied our
obtained results to lysozyme crystallization since lysozyme is also a representative protein in
protein crystallography [19]. It is expected to sharpen present crystallization techniques with
optimizing laser parameters and simultaneously establish a remarkable milestone to study
molecular dynamics of femtosecond laser-induced crystallization under appropriate
14
Chapter 2
Principle
The mechanism of femtosecond laser-induced crystallization is completely different
from other methods because only this technique triggers nucleation by multiphoton absorption
of solvent leading to optical breakdown and is less related with solute. Firstly, principle of
multiphoton absorption is explained with its schematic illustration in Fig. 2.1. Since the
energy of a single photon is not enough to excite a molecule from the ground state to a higher
electronic state, the molecule can be excited only by absorbing more than one photons
simultaneously and the energy difference between the two states is equal to the sum of the
energy of the photons. Figure 2.2 reveals that water has much higher absorption in UV region
due to electronic transition than in visible and NIR region due to vibrational overtone
absorption [37], so it supports that water molecule are excited by photons at 800 nm through
multiphoton absorption.
By focusing intense laser into water, multiphoton absorption of water occurs, and leads
to optical breakdown of water giving vigorous evaporation if the superheated condition is
15
rapid than the rate of energy consumed by vaporization and normal boiling, the liquid water is
driven to a metastable superheated state. The liquid can remain metastable until the spinodal
temperature is reached. By viewing a plot of the Gibbs free energy versus specific volume at
ambient pressure as shown in Fig. 2.3, unique features of the spinodal temperature can be
appreciated. At the spinodal temperature, the equilibrium between saturated liquid state and
saturated vapor state becomes extremely unstable, so the liquid undergoes spinodal
decomposition, a spontaneous process by which a thermodynamically unstable liquid relaxes
toward equilibrium. The superheated liquid transits to the vapor phase via spinodal
decomposition spontaneously. The generated vapor bubbles grow with increasing temperature,
and eventually stop growing and collapse at the maximum spinodal temperature just below
the critical temperature [38].
Although optical breakdown can be achieved in various common solvents such as water,
deuterated water and some organic solvents, water is still chosen as the best solvent for
crystallization in this study since water is easier to be obtained with much less cost, is more
environmentally friendly and always plays an important role in biological systems. Different
from laser trapping crystallization method in which deuterated water has been used as solvent
to prevent from temperature elevation induced by continual 1064 nm CW laser irradiation, it
16
crystallization. Moreover, the wavelength of femtosecond laser can be adjusted to 800 nm at
which it is well-known that neither water nor biological molecules such as amino acids and
proteins have strong vibrational overtone absorption. Therefore, femtosecond laser is regarded
as an appropriate light source to deal with biological molecules or systems such as proteins,
cells and tissues which usually contains large amount of water and has been widely applied
[30].
When an intense femtosecond laser light is focused into water, multiphoton absorption of
water induces nonlinear phenomena such as shockwaves, cavitation bubbles, and jet flow
formations in water (Fig. 2.5) [5]. These nonlinear phenomena were also described as laser
tsunami. A real image of optical breakdown of water was shown in Fig. 2.6 while it was
induced by picosecond laser irradiation but not femtosecond laser irradiation. Trace of shock
wave propagation and cavitation bubble generation can be clearly observed, and the spatial
and temporal intensity decays of local transient pressure induced by shock wave were also
recorded as shown in Fig. 2.7 and Fig. 2.8, respectively [39].
Lord Rayleigh discussed the collapse behavior of a spherical cavity in a homogeneous
incompressible liquid and established a mathematical model to calculate time-dependent radii
17
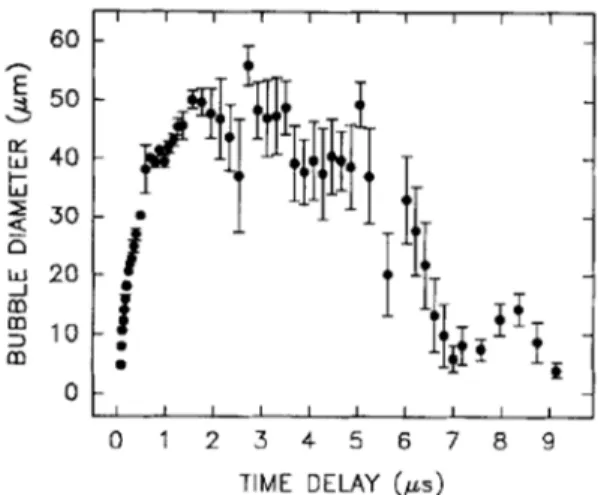
cavitation bubbles generated by femtosecond laser pulses, and compared the results with
theoretical calculations derived by L. Rayleigh (Fig. 2.9) [41].
Laser tsunami as local physical perturbations in supersaturated solutions has been
utilized to trigger the nucleation by increasing local concentration as shown in Fig. 2.10
[10-13, 36]. Since the duration time of femtosecond laser pulse is too short to accumulate heat
near focal point, it is considered that femtosecond laser-induced crystallization takes place
under constant temperature.
Recently, high-speed and high-resolution photography have also been used to investigate
laser-induced cavitation bubble behavior and the subsequent nucleation of crystals. The
bubble size expanding and shrinking periodically is called Rayleigh bubble. In order to
discuss the importance of Rayleigh bubble to crystallization, Murai et al. increased the
viscosity of lysozyme solution by adding agarose gel against protein diffusion from the focal
point and recorded the conformation change of bubbles. They successfully observed the
formation of locally high concentration region induced by bubble conformation change
leading to elevate crystallization probability around the surface of bubble [42, 43]. Nakamura
et al. previously observed film-like crystal formation of anthrathene along with the bubble
18
Another supporting evidence is that Soare et al. observed ring-shaped optical disturbance
which originates from refractive index change induced by crystal nuclei formation after
collapse of cavitation bubble [44].
Fig. 2.1 Schematic illustration of
multiphoton absorption.
S0
S1
Fig. 2.2 Absorption coefficient spectrum of water, together with the
19
Shock waves Cavitation bubbles Focusing femtosecond laser
Fig. 2.5 Schematic illustration of laser tsunami
in water.
Fig. 2.3 Gibbs free energy versus specific volume of a pure substance for several
temperatures starting at the saturation temperature, Tsat, where the liquid and gaseous
states are in equilibrium, up to the spinodal temperature, Tspin. Note that the local
minimum corresponding to the liquid phase disappears at the spinodal temperature, effectively forcing conversion of the substance to the vapor phase [37].
20
Fig. 2.7 Experimentally determined shock wave pressure after pulses of 30 ps duration
with 50 J and 1 mJ energy. The numbers indicate the local slope of the curves [38].
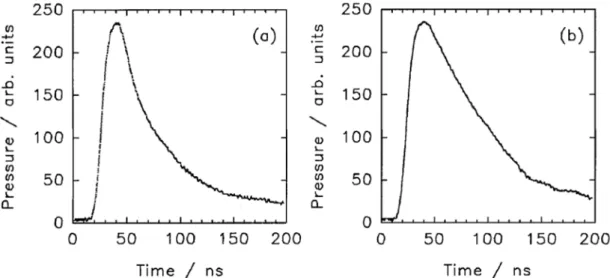
Fig. 2.8 Hydrophone signals measured at a distance of 10 mm from the emission
center of the shock waves. The respective values of laser pulse duration and energy are (a) 30 ps, 50 J; (b) 30 ps, 1 mJ [38].
Fig. 2.6 Plasma, shock wave, and cavitation bubble produced by Nd:YAG laser pulses
of different duration and energy: (a) 30 ps, 50 J; (b) 30 ps,1 mJ. All pictures were taken 44 ns after the optical breakdown [38].
21
Fig. 2.9 The diameter of the cavitation bubble in water as a
function of time. The laser fluence is 9 J/cm2 [40].
Fig. 2.10 Spatially limited transient pressure generated by
femtosecond laser can induce molecular nucleation in supersaturated solution.
22
Fig. 2.11 Microscopic images of generated anthracene crystals at a pulse energy of 6.7
J/pulse (a) and a growth process of a bending film-like crystal created at the surface of a large laser-induced bubble at a pulse energy of 16.5 J/pulse (b-d) [13].
23
Chapter 3
Experiment
3.1 Experimental setup
3.1.1 Femtosecond laser light source
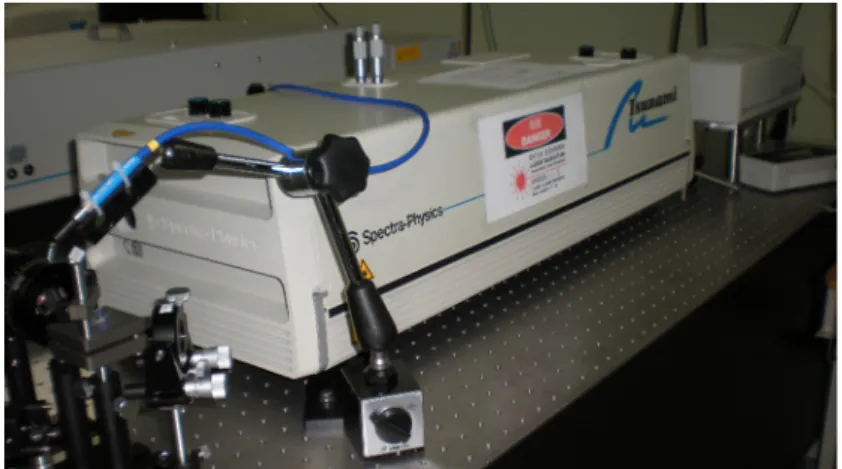
Amplified Ti:sapphire femtosecond laser which is composed of a mode-locked
Ti:sapphire laser and Chirp Pulse Amplification (CPA) was used as the light source in this
study. A mode-locked Ti:sapphire laser light (wavelength; 700-900 nm, repetition rate; 80
MHz, pulse duration; 160 fs, Tsunami, Spectra Physics) was generated when it was pumped
by a continuous wave solid-state visible laser (wavelength; 532 nm, Millenia Pro, Spectra
Physics) at about 7 W and was controlled by an electronics module (Model 3955, Spectra
Physics). A prism sequence and a slit were used for dispersion control and wavelength
selection, respectively. Spectral information of the output laser light was provided by a fiber
optic spectrometer (USB4000, Ocean Optics). After full width at half maximum (FWHM) of
the spectrum and central wavelength of the laser light were determined to be about 12 nm and
800 nm simultaneously, the laser light was amplified by a Ti:sapphire regenerative amplifier
24
Since self-focusing, a nonlinear optical effect in which an intense light beam modifies
the refractive index of the material it is passing through, takes place and causes permanent
damage to the Ti:sapphire crystal, it is necessary to limit the peak power of a pulse below 10
GW/cm2 during amplification. Therefore, CPA was applied to the system to amplify pulse
beyond the peak power and to keep the power density far below the damage threshold of the
crystal. CPA was accomplished in the following three steps (Fig. 3.5). The first step stretched
the seed pulse supplied from a stable and mode-locked femtosecond laser to about 104 times.
Stretching the pulse reduces its peak energy, which greatly reduces the probability of damage
to the crystal at the same time. The second step amplified the stretched pulse by passing it
through the Ti:sapphire regenerative amplifier. Finally, a set of dispersive optics was used to
recompress the stretched, amplified pulse as close as possible to its original duration and high
peak power compressed pulse was generated.
Fig. 3.1 Picture of mode-locked Ti:sapphire laser,
25
Fig. 3.2 Absorption and emission spectra of
Ti:sapphire.
Fig. 3.3 The mode-locking principle in Tsunami.
Fig. 3.4 Picture of Ti:sapphire regenerative amplifier
26
3.1.2 Experimental setup
The experimental setup is shown in Fig. 3.6. Linearly polarized femtosecond laser pulses
from femtosecond laser (wavelength; 800 nm, pulse duration; 160 fs, Spitfire Pro, Spectra
Physics) were introduced to an inverted microscope (IX-71, Olympus) through an objective
lens (10×, N.A. 0.25, PlanN, Olympus). Pulse energy was adjusted by using a half-wave plate,
a polarizing beam splitter, and a variable neutral density filter, and was measured after an
objective lens by energy meter (842-PE, Spectra Physics). The repetition rate of femtosecond
laser pulse train was controlled by a Pockels Cell. The crystal formation and crystal
morphology were observed with a digital CCD camera (CV-S3200N, JAI) attached to the
microscope. All the experiments were carried out at room temperature (22 ̊C). [45]
27
Fig. 3.6 Laser light source and microscopic system for crystallization.
Fig. 3.7 Picture of inverted microscope and other attachments.
Fig. 3.8 Reflectance spectrum of the dichroic mirror used in the inverted microscope
28
3.1.3 Confocal Raman microspectroscopic system
Confocal Raman microspectroscopic measurement was performed to characterize the
crystalline phase of obtained crystals with a confocal unit coupled optical inverted microscope
(FV300, Olympus). Raman signals were obtained by exposing 532 nm DPSS laser beam (40
mW, JLW-532-200, SLOC) through a line filter and an objective lens (10×, N.A. 0.25, PlanN,
Olympus) to the crystals placed on the microscope stage, and were recorded by a CCD
camera combined with polychromator with a 150 gr/mm grating (polychromator; SpectraPro
2300i, CCD camera; PIXIS400, Princeton instruments) after passing through a confocal
aperture (500 m). By fast laser scanning a certain detecting two-dimensional area of the
obtained crystals with a Galvano mirror unit, Raman images were also recorded.
Fig. 3.9 Transmittance spectrum of the objective lens used in the inverted
29
3.1.4 Surface tension measurement
Surface tension is a property of a liquid surface that allows it to resist an external force.
In the bulk of the liquid, each molecule is pulled equally in every direction by neighboring
liquid molecules, resulting in a net force of zero. The molecules at the surface do not have
other molecules on all sides of them and therefore are pulled inwards. This creates some
internal pressure and forces liquid surfaces to contract to the minimal area. Similar to surface
tension, molecular adsorption is related to surface energy. In a bulk material, all the bonding
requirements of the constituent molecules of the material are filled. The molecules on the
surface experience a bonding deficiency because of the dissymmetric surrounding. Therefore,
it is energetically favorable for them to attract adsorbates.
The du Noüy ring method, a relatively simple method with much higher precision
proposed by the French physicist Pierre Lecomte du Noüy in 1925 [46], is applied to measure
surface tension of sample solution here. As Fig. 3.10 shows, a hanging and relatively
immobile thin platinum ring (diameter of wire 2r; 0.3 mm, diameter of ring 2R; 13.5 mm,
Narika) connected with an electronic balance (minimum weight; 0.1 mg, CP124S, Sartorius)
from the bottom is submersed in a solution on a stage, and then the height of the stage is
slowly decreased at a constant speed. As the ring is almost pulled out of the liquid, the
30
the liquid. The following is the formula:
γ = ………....………(3.1)
W. D. Harkins and H. F. Jordan considered that the shape of liquid film is strongly
dependent on the radius of the ring, the radius of the wire, the density of the solution and the
surface tension, compared with the maximum force F obtained by both the ring method and
the capillary method (Fig. 3.11 [47]), and suggested that the obtained surface tension with
ring method should be modified by a correction factor (R3/V, R/r) [48]. Therefore, the real
surface tension is shown as the following formula:
γ = , ………(3.2)
Fig. 3.10 Illustration of the du Noüy ring
method
.
Fig. 3.11 Illustration of the capillary
31
3.1.5 X-ray diffraction
X-rays as electromagnetic waves are diffracted by a crystal in many directions.
Following Bragg’s law, constructive interference of X-rays scattered by a crystal occurs in a
few specific directions. These diffraction data inclusive of intensities and phases in reciprocal
space can derive the dimensions of the unit cell and the molecular structure in real space
through Fourier transform. In fact, X-rays are mainly scattered by the electrons but not nuclei
in the atoms. Therefore, a primitive data of electron density distribution is firstly obtained
from the diffraction pattern. After repeating fitting the atomic model and refinement again and
again, molecular structure at atomic scale can be reconstructed [15].
Particle accelerators as synchrotrons and storage rings are the most powerful X-ray
sources, and they are profitably used by protein X-ray crystallographer for data collection on
weakly diffracting specimens such as very tiny crystals or crystals with extremely large unit
cells. Synchrotrons are facility for circulating electrically charged particles at nearly the speed
of light. The particles are injected into the storage ring directly from a linear accelerator or
through a booster synchrotron. When the particle beam changes direction, the electrons or
positrons are accelerated toward the center of the ring, emit electromagnetic radiation, and
consequently lose energy. This energy loss is compensated by a radiofrequency input at each
32
which is two orders of magnitude stronger than a conventional X-ray tube. Another advantage
is the low divergence of the beam resulting in sharper diffraction spots [15].
3.2 Sample preparation
3.2.1 Supersaturated glycine aqueous solution
Glycine (99.0%, Lot. No. LTF4344, Wako Pure Chemical) in the form of white powder
was used without further purification. Deionized water as solvent was filtrated with a syringe
filter (pore size; 0.22 m, SLGV 013 SL, Millipore) before dissolving glycine. 1.5 ml glass
bottle (Nichiden Rika Glass) (Fig. 3.12) as container was cleaned by plasma cleaner (ATTO,
diener electronic). 0.5 ml of supersaturated glycine aqueous solution was prepared at 3.0 M,
3.5 M and 4.0 M (Csat= 3.0 M [49]) in glass bottle with cap screwed on. The solution was
slowly heated up from room temperature to 60 ̊C in water bath at heating rate 5 ̊C per hour
until glycine was completely dissolved, and was cooled down to room temperature
spontaneously.
Fig. 3.12 Picture of 1.5 ml glass bottle
33
3.2.2 Supersaturated lysozyme aqueous solution
3.2.2.1 Acetic acid-sodium acetate buffer aqueous solution
Filtrated deionized water was also used as solvent here. 200 mM acetic acid solution was
prepared by adding 120 l acetic acid (99.8%, Sigma-Aldrich) into 10 ml water. On the other
hand, 200 mM sodium acetate solution was prepared by adding 0.164 g sodium acetate
(Sigma-Aldrich) into 10 ml water. 2.9 ml acidic solution and 2.1 ml basic solution are mixed
and diluted with 5 ml water. Finally, the obtained solution was 100 mM acetic acid-sodium
acetate aqueous solution used as buffer solution and its pH was about 4.5 measured by pH
meter (pHi 510, Beckman Coulter) [50].
3.2.2.2 Supersaturated lysozyme aqueous solution
Lysozyme from egg white or hen egg white lysozyme (HEWL) (for Biochemistry, Lot.
No. PEK3768, Wako Pure Chemical) in the form of white powder was used without further
purification. Supersaturated lysozyme solution was prepared with buffer solution at 40 mg/ml
at room temperature. After lysozyme was completely dissolved in buffer solution, sodium
chloride (>99.9%, FSA Laboratory Supplies) as a crystallization agent was added to slightly
decrease protein solubility. The pH of prepared solution was not much changed after
34
crystallized successfully at pH around 4.5 [19, 51]. The solution was dropped into wells
fabricated on a plastic crystallization plate (VDX48 Plate with sealant, Hampton) (Fig. 3.13)
with 50 l in each well sealed with glass coverslip (Matsunami).
35
Chapter 4
Glycine Crystallization
4.1 Introduction
It is well-known that protein is a biological macromolecule composed of 20 common
amino acids. Glycine, NH2CH2COOH, is a common amino acid with lowest molecular weight
and simplest structure (Fig. 4.1), and has been repeatedly studied in the field of crystal
chemistry.
Glycine crystal shows three polymorphs inclusive of two monoclinic with
centrosymmetric space groups (, s.gr. P21/n, and , s.gr. P21) and one trigonal with
non-centrosymmetric space group (, s.gr. P31) [52-54]. The shape difference between - and
-polymorph glycine crystals can be clearly distinguished in Fig. 4.2. Many groups have
employed glycine as a standard sample to laser-induced crystallization methods. It can be
36
expected that the detailed study on femtosecond laser-induced glycine crystallization will be
more helpful to understand the laser parameters effect by comparison with such previous
work.
Usually, commercially available glycine powder contains mixture of - and
-polymorphs. The polymorph content obtained from different chemical companies or even
just different packages of the same company ranges from with admixture of to with
admixture of . -polymorph crystal is the most thermodynamically stable among these three
polymorphs, but spontaneous crystallization gives -polymorph under almost every
experimental condition. Crystal of -polymorph is preferentially obtained under relatively
severe conditions such as using acid and base water solutions, using heavy water solution, and
adding compounds that inhibit the growth of -glycine like hexafluoravaline. However, based
on our experimental result, it is still difficult to prepare -polymorph crystal under using
Fig. 4.2 The shapes of (a) -polymorph and (b)
37
heavy water as solvent. In fact, the success of crystallizing -polymorph seems to depend
much more on the presence of the seeds of this polymorph in the powder used for preparing a
saturated solution, than on the solvent used. To obtain -polymorph crystal, ethanol should be
used to precipitate this form from a saturated water solution. However, a mixture of the -
and the -polymorphs can be always obtained [52, 54].
The transformations among these three polymorphs are very complicated [52]. Although
-polymorph is quite stable at room temperature, it transforms to -polymorph after several
months. The transformation rate is highly dependent on the humidity of environment. High
humidity accelerates the transformation rate. -polymorph prefers to transform to - but not
-polymorph under high humidity but can be preserved well in dried environment.
-polymorph also transforms to -polymorph with heating below 100 ̊C or mechanical shocks
such as crush. -polymorph is quite stable at room temperature, but it transforms to
-polymorph at 165 ̊C. And reverse transformation does not take place immediately even after
-polymorph is cooled down to room temperature [14, 53].
4.2 Results
The possibilities of crystallization were recorded as crystallization probability here. The
38
total number of samples done at the same condition. Experiment was repeated 10 times under
each condition. In order to confirm that the crystals are obtained by femtosecond laser
irradiation rather than spontaneous crystallization, several blank samples under each condition
were prepared for reference simultaneously.
4.2.1 Pulse energy dependence
Pulse energy dependence of glycine crystallization probability is shown in Fig. 4.3. Laser
pulse train was focused at the solution/glass interface, which was actually about several tens
Fig. 4.3 Pulse energy (J/pulse) dependence on glycine crystallization probability
(%). Repetition rate, exposure time, sample concentration and focal position are 1 kHz, 10 minutes, 4.0 M and several tens m from the bottom of the bottle, respectively.
39
m above the interface, to avoid laser ablation of glass. Cavitation bubble generation
threshold is confirmed by a CCD camera (Fig. 4.4). With increasing the pulse energy,
crystallization probability increased, while it showed a threshold of crystallization around 2.5
J/pulse, which was in good agreement with that of cavitation bubble generation.
4.2.2 Repetition rate dependence
Crystallization probability and crystal morphology dependence on repetition rate of
irradiated femtosecond laser pulse train are recorded in Fig. 4.5. Pulse energy, irradiation time,
and focal position were fixed to 100 J per pulse, 10 minutes and at the solution/glass
interface, respectively. After waiting for several hours from femtosecond laser pulses
irradiation, we successfully obtained glycine crystals in the glass bottle.
It is found that the crystallization probability increased with the repetition rate and it
Fig. 4.4 The CCD image of cavitation bubble generation.
When the pulse energy is 2.5 J per pulse, cavitation bubbles are generated around the focal point.
40
Fig. 4.5 (a) Crystallization probability (%) and crystal morphology dependence on
repetition rate (Hz). (b) Images obtained from CCD camera. (c) Picture taken by general camera. Pulse energy, exposure time, sample concentration and focal position are 100 J per pulse, 10 minutes, 4.0 M and several tens m from the bottom of the bottle, respectively.
Single crystal Multiple crystal Powder-like crystal (c) (b) (a)
became saturated to 100 % above 250 Hz. On the contrary, at low repetition rate less than 5
Hz, crystals could not be obtained. In addition, it was confirmed that crystal morphology
exhibited a strong correlation with the repetition rate (Fig. 4.5 (b) and (c)). At lower repetition
rates, transparent single crystals with prismatic morphology floating on the solution were
obtained frequently. The size of the single crystals was roughly 5×4×3 mm3. Besides,
powder-like crystals were more likely to be observed at higher repetition rates. These
powder-like crystals are quite many, small, and uniform sized (mean size; 50×20×10 m3).
41
middle rates around 50 Hz.
It is also found that crystal formation period was closely related to crystal morphology.
In this experiment, single crystal formation took at least 3 to 4 days to be observed. However,
the formation period was dramatically shortened as the size of crystal decreased. Powder-like
crystal formation could be observed during pulse irradiation.
4.2.3 Focal position dependence
The result of focal position dependence is shown in Fig. 4.6. Pulse energy, irradiation
time, and focal position were fixed to 100 J per pulse, 10 minutes and at the air/solution
interface, respectively. Compared with the result of repetition rate dependence at the
solution/glass interface, it was observed that the crystallization probability was significantly
improved even at relatively low repetition rates such as 5 Hz and powder-like crystals were
always obtained during laser irradiation when we irradiated the laser light at the air/solution
interface.
In order to confirm the interface effect, the focal position was shifted from the
solution/glass interface to the air/solution one with 1 mm step (Fig. 4.7). The solution
42
focal positions with 1 mm interval. As the result, it is found that the crystallization probability
is improved upon both air/solution and glass/solution interfaces irradiation whereas the
probability is higher at the air/solution irradiation. In contrast to their interface irradiation, the
Fig. 4.7 The crystallization probability (%) depending on the distance from the
air/solution interface (mm). Repetition rate, pulse energy, exposure time and sample concentration are 25 Hz, 100 J per pulse, 10 minutes and 4.0 M, respectively.
Air/solution interface
Solution/glass interface
Fig. 4.6 The crystallization probability (%) depending on the repetition rate (Hz) at
the air/solution interface or glass/solution interface. Pulse energy, exposure time and sample concentration are 100 J per pulse, 10 minutes and 4.0 M, respectively.
43
irradiation inside the solution suppressed the probability in spite of relatively higher
probability at the position closer to air/solution interface. Therefore, we conclude that
utilizing interface can improve crystallization probability in femtosecond laser induced
crystallization and the irradiation at air/solution interface is more efficient.
4.2.4 Concentration dependence
From the view point of crystallography, it is well-known that the quality of the crystal in
low supersaturated solution is much higher than that in highly supersaturated solution, which
has been recognized in the conventional crystallization methods [31]. Therefore, it is expected
to obtain crystals at relatively lower saturated concentration.
Fig. 4.8 The crystallization probability (%) depending on the repetition rate (Hz) at
3.0 M, 3.5 M and 4.0M. Repetition rate and exposure time are 50 J per pulse and 10 minutes, respectively.
44
Glycine solutions at lower supersaturated concentration and even saturated concentration
(Csat=3.0 M) were irradiated by laser focused at the air/solution interface and the
solution/glass interface. Concentration dependence at three different repetition rates is
presented in Fig. 4.8. It is found that it is possible to get crystals even at lower concentration
(3.5 M) when we irradiated laser pulses at the air/solution interface at 50 and 100 Hz, and the
crystallization probability is apparently higher. However, it is difficult to form crystal when
we irradiated laser pulses at the solution/glass interface at the same repetition rates. Compared
with the case at saturated concentration (3.0 M), it is still difficult to crystallize at neither the
air/solution interface nor the solution/glass interface at even higher repetition rate such as 100
Hz.
4.2.5 Exposure time dependence
Since the crystallization probability reached such a high enough value when we
irradiated laser pulse at the air/solution interface, we tried to reduce the laser irradiation time.
It was expected to simplify the conditions and finally achieve single crystal formation by
single laser pulse, which is the simplest and the most ideal condition to study the molecular
dynamics of femtosecond laser-induced crystallization.
![Fig. 1.2 Schematic illustration of crystal formation from a disordered medium to a highly ordered phase [20]](https://thumb-ap.123doks.com/thumbv2/9libinfo/8759710.207900/22.892.199.741.186.340/schematic-illustration-crystal-formation-disordered-medium-highly-ordered.webp)
![Fig. 1.3 Schematic illustration of the formation of ordered crystalline nuclei as a result of the superposition of a density and a structure fluctuations [20]](https://thumb-ap.123doks.com/thumbv2/9libinfo/8759710.207900/23.892.344.557.510.889/schematic-illustration-formation-ordered-crystalline-superposition-structure-fluctuations.webp)