An Effective Request Distribution Mechanism For Improving Load Balance in Web Server System
8
0
0
全文
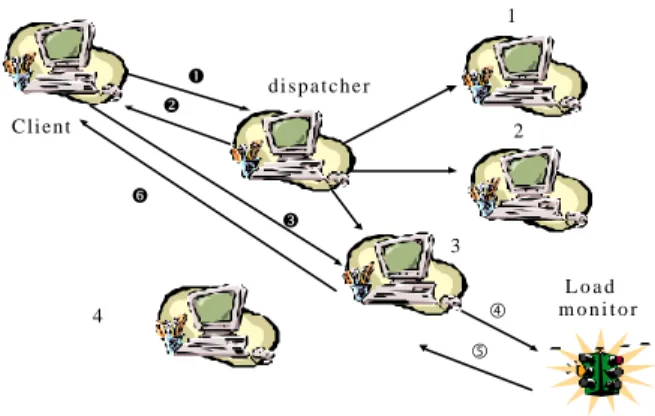
(2) similar to existing infrastructure in the web server environment except a simple process called “ load monitor”, which is used to estimate the load of the server and trigger content adaptation procedure, running on web server. In our system design, we consider a page as a basic unit for replication. For every page, we create several additional adapted pages with various degree of sensitivity to resources by off-line and store them in the same server together. If we have to create additional page in another server for load balance, these adapted pages have to be created there together. 1 Œ v. Ni(t) = 2 Ni(t − 1 ) − Ni(t − 2 ),Ni(t) ≥ 0. 2. Ci. z w. Ci. 3 „. 4. (3 - 1). Despite the simplicity of this formula, it is enough to predict an approximate total access frequency of documents [11]. So we can estimate the number of replicas for document i in according to formula 3-2.. dispatcher. Client. adjust the time period to more short value. But, dissimilar to dynamic replication, estimation of popularity in our policy is based on access frequency prediction. In other words, we can calculate the access frequency in the next period based on statistics collected in the past and the present periods. The popularity of document on the next period can be expressed as a simple linear function shown below [11]: Let Ni be the access number of document i, t be the time period, and Ci(t) be the number of replicas for document i at period time t. For document i, we have. Load monitor. Ci. Ci. (t ) = ( t ) ≥. 1. ( t ) =. Ci Ci. ( t − 1 ) × Ni Ni ( t − 2 ). ( t ). (3. - 2). and ( t ) ( t ). , if Ci ( t ) − Ci ( t ) ≥ , otherwise. 0 .5. …. 3.2 Data Placement Scheme Figure 2.1 System Architecture. 3.PROBABILISTIC DISPATCHING WITH CONTENT ADAPTING METHOD. 3.1 Popularity-based replication We often create additional replicas for content in order to evenly spread massive traffic among servers. However, the entire web sites replication is not a practical approach due to without considering popularities of documents. Hence, documents should be replicated as their popularities to meet the actual requirements. By access log, we can gather statistics of access frequencies of documents and distinguish the popular documents from the cold documents. The more popular a document becomes, the more replicas it should be kept in servers, and vice versa. In [6-8], the concept of demand-based document dissemination was proposed. Basically, it creates additional replicas for a document in another server only when the access frequency of the document is beyond a definite threshold. They can be viewed as “ dynamic replication technique”. However, they usually impose overhead of collecting access behavior information. Therefore, we adopt alternative technique called Period Adjustment Policy [9-11]. Its basic idea is that we can adjust the number of replicas within an appropriate time period (e.g. every day or every two days). The reason is that the popularities of documents may not change very dramatically every day or every two days. If the popularities of documents change dramatically, we can. The goal of our system design is to balance workloads among servers. To achieve this goal, we can take advantage of the predicted access frequency of documents. If we can spread documents among servers such that the accumulative access frequency of documents are the same across all servers, then all servers may have equivalent workloads within a time period. Assumed we have M documents with predicted access frequencies, N1(t) , N2(t), …., NM(t), and corresponding replicas, C1(t), C2(t),…, CM(t). Because document i has Ci replicas which are marked as i1 , i2 , … iC , access frequency of a replica can be calculated and equal with others by formula 3-3.. Ni1(t) = Ni 2 (t ) = .........= NiC(t ) = Ni / Ci (t ),. (3 - 3). We can employ these replicas as follows: First, we sort all replicas of documents in a decreasing order based on their access frequencies and create a list for the sorting result. Second, a replica is extracted from the list and placed on a server based on two principles. One is to choose a server which current accumulative access frequency is the least of all servers. And the other is never to place identical replicas on a server. After placing a replica on a server, the accumulative access frequency of this server will be added by the access frequency of placed replica. The procedure halts until the list is empty. By this way, all servers will have equivalent accumulative access frequencies in a period. Because elapsed time for serving a request varies with size of requested documents, accumulative access frequency of a server couldn’t represent the accurate estimate of workloads on the server. For more accurate estimate of workloads, we must take the effects on size of documents into account. That is, we have to redefine the new access frequency of a document i , Nnewi(t), as formula 3-4, where Si is the size of document i.. N new i ( t ) = Ni ( t ) × Si ,. (3 - 4) 2.
(3) For example, we assume that there are five documents existed on our system. Their access frequency, number of replicas, and access frequency for replica are listed in Table 3-1. We can take Figure 3-1 to explain how to evenly spread these replicas among servers. The symbol sij denotes the jth replicas for the document i. We can create a list, NS21, NS22, NS11, NS12, NS13, NS14, NS31, NS32, NS41, NS51, which is sorted in a decreasing order according to access frequency of replica. We can clearly see why the 'S13' is placed in server 1. Before placing the 'S13', the accumulative access frequencies of server1, server 2, server 3, server 4, are 0.15, 0,15, 0.1, 0.1, respectively. According to the first principle of our scheme, the sever 3, which has the least accumulative access frequency of all servers, should be chosen to place 'S13'. Because 'S12', the identical replica of document 1, has been placed in server 3, in order to follow the second principle, we choose server 1 to place 'S13'. After the placement of all replicas, we can show that all servers have equivalent workloads (0.25, 0.25, 0.25, 0.25). The result of this procedure is recorded in the placement table within the dispatcher as shown in Table 3-2. Access Frequency. Replicas. Access Frequency of Replicas. 3.3 Job Scheduling Policy Basically, job scheduling is used to distribute incoming requests among servers. It is one of the most important techniques for web server system and affects the load distribution deeply [2-3]. In [2], the dispatcher distributes requests among servers based on dispatching probabilities of documents. In order to avoid the dispatcher from becoming the bottleneck and to simplify the complexity of system design, we propose a viable policy called dispatching probability policy enhanced from [2]. In this policy, the dispatcher will spread incoming requests to an appropriate server based on pre-computed dispatching probabilities recorded in dispatching table. The construction of the dispatching table is based on the placement table. For example, if a requested document is 3, then the probabilities of dispatching server 1 or 2 are both 0.5. The dispatcher generates a random number c and dispatch the request to server 1 if c is smaller than 0.5. On the other hand, if the range of c is between 0.5 and 1, the request will be distributed to server 2. Our job scheduling policy needs not to keep the latest load statuses of all servers in a record all the time, so it can avoid massive communication traffic and is easy to implement.. S1. 0.4. 4. 0.1. S2. 0.3. 2. 0.15. 3.4 Content Adaptation Policy. S3. 0.2. 2. 0.1. S4. 0.05. 1. 0.05. S5. 0.05. 1. 0.05. Since our approach is to equalize the average accumulative access frequency for each server over a large period of time, we can’t ensure load balance in any moment within this period. In other words, the skew access arrival rates for documents may bring about burst traffic in the system and overload a subset of web servers. In order to reduce the impacts on burst traffic, we adopt the concept of content adaptation approach in our system design [1].. Table 3-1 Access frequencies of documents. Server 1. Server 2. Server 3. Server 4. 0.15 (s21). 0.15 (s22). 0.1 (s11). 0.1 (s12). 0.1 ( s13). 0.1 ( s14). 0.1 (s31). 0.1 (s32). 0.05 (s4). 0.05 ( s5). Load 0.25. Load 0.25. Lines of words a A text file b. 1(5) 5(10). Object A (symbol) (Text) Load 0.25. Load 0.25. A small icon c A JPEG file d. 3(1) 7(9). Object B (symbol) (Picture). Figure 3-2 An example for item selections Figure 3-1 An example of data placement. Server 1. Sever 2. Server 3. Server 4. Document 1 0.1. 0.1. 0.1. 0.1. Document 2 0.15. 0.15 0.1. 0.1. Document 3 Document 4. 0.05. Document 5. 0.05. Table 3-2. Placement table. We can create several adapted pages for every page in advance and store them in the same server together. That is, every of those pages can be chosen to respond a specific document request. As shown in Figure 3-2, a web page may be composed of a text file and a picture. We create 3 additional adapted pages for it in advance. They are (a,c), (a,d) and (b,c), where symbols in the parentheses represent selected items. Content Adaptation technique can efficiently reduce the impacts on burst traffic due to the probabilistic dispatching policy. However, it is critical that how to select an appropriate one from those adapted pages when server is overloaded. Each page may have different size and resource weight value. Therefore, we can give an identity number for all adapted or non-adapted pages based on both of their size and resource weighted value. The 3.
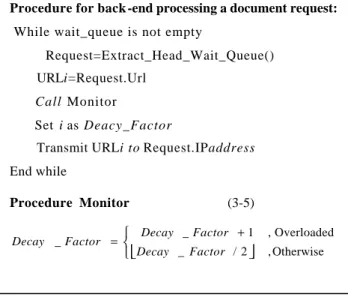
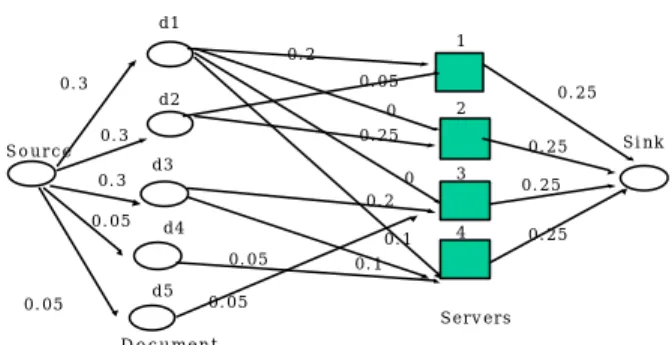
(4) larger an identify number of a page is, the more possessions of resources of the page has. The page which consists of a text of file and a JPEG file will be set as 4 due to the larger size and weight value (size is 12 and weight value is 19). The size of the page composed of lines of words and a JPEG picture is equal to the size of the page composed of a text file and a small icon. However, the former has the larger weight value, so its identity number, 3, will be larger than the identity number of the latter, 2. For every back-end server, it possesses a decay factor called i. The decay factor is an integer variable and is used to control the section of pages. For example, if a requested document is /home/adela.html, back-end server will view it as /home/adelai.html and interpret i as 4 if server is not overloaded. Conversely, if resource of the server is exhausted nearly, i can be interpreted as 1 and /home/adela1.html will be responded to a client request. But, how to select an appropriate page from the adapted pages affects the performance of the load reduction greatly. Here, we adopt the concept of flow control in the TCP network to control the size of transmitted page. That is, the monitor module estimates the load of servers every second, by which the decay factor will be either half or added one[17]. The procedure is shown in Figure 3-3. By formula 3-5, we find that overloaded server will transmit a page where its identity number is half of decay factor to a client. This ensures that the overloaded server can reduce size of transmitted page fast and cope with burst traffic efficiently. However, in order to avoid the impacts on unpredicted burst traffic, back-end servers would rather transmit a page that its size and weight value are growing slowly to a client even if server is not overloaded. It can reduce the frequency that a server becomes overloaded from normal status due to skew access rates. Procedure for back -end processing a document request: While wait_queue is not empty Request=Extract_Head_Wait_Queue() URLi=Request.Url Call Monitor Set i as Deacy_Factor Transmit URLi to Request.IPaddress End while Procedure Monitor. (3-5). Decay _ Factor + 1 Decay _ Factor = Decay _ Factor / 2 . , Overloaded , Otherwise. Figure 3-3 Procedure of back-end server 3.5 Re-calculating dispatching table We can reorganize the configurations of deployment of documents in the next period. However, the movement of documents incurs substantial I/O operations and affects the availability of the system. Hence, we would like to reduce. the overhead of reconfiguration of data distribution when the popularities of documents are changed. Fortunately, we can achieve this goal by adjusting the dispatching probabilities on the dispatching table. We can demonstrate a network-flow model for the mapping of data placement problem. As shown in figure 3-4, the flow arcs from the source to a document represent the predicted access frequency for the corresponding document, the flow arcs from documents to servers represent the access frequencies of replica stored in server, and flow arcs from documents to sink represent the accumulative access frequency for servers. The result of mapping is equivalent to the result of Table 3-2.. d1 1. 0.1 0.15. 0.4. 0.25. d2. 0.1. 2. 0.1. 3. 0.15. 0.3. 0.25. Source d3 0.2 0.05. 0.25. 0.1 d4 0.05. 0.1. 0.1. 4. Sink. 0.25. d5 0.05 0.05. Servers Document. Figure 3-4 A network flow for data distribution. If the access frequencies of document 1 and 2 are both changed as 0.3, we can achieve load balance without reconfiguration of data distribution by modifying the dispatching table. We can take advantage of the network-flow model and map our problem domain to the maximal-flow and minimal-cost problem domain. The maximal-flow and minimal-cost problem can be defined as follows : Given a G=(N, A) be a network with a cost cij and a capacity u ij associated with every arc (i,j) ∈ A. To minimize the cost function Z(x), where Z(x)=∑ cij * xij ,for 0⊆ xij ⊆uij . That is to say, we will find a maximal flow such that the defined cost is minimal. Our problem is how to rebalance load without movement of documents when access frequencies of documents are changed. If we view the initial data dis tribution as a network model, we can solve our problem by running a maximal flow with minimal cost problem. As shown in figure 3-5, we expect that every server should have equivalent accumulative access frequency, 0.25, for the sake of balance. However, it is probably unable to find a solution that access frequency of each server is 0.25. Hence, in order to find an optimal solution, we adopt the concept of least square error in linear algebra that the difference between the found solution and the ideal solution is minimal [13]. Hence, we can define our cost function as formula 3-6: 1 ,∀ i , j = sin k Z ( x ) = ∑ ( Cij * Xij − 1 / N ) 2 , Cij = 0 , Otherwise . (3 - 6). In formula 3-6, 1/N is an ideal solution, so we denote Xij as optimal solution if the square of its cost function is minimal. After running the maximal flow and minimal cost, we obtain the new dispatching probability and the new dispatching table listed in Table 3-3. 4.
(5) d1 1. 0.2 0.05. 0.3 d2 Source. 0.25 2. 0. 0.3. 0.25 d3. 0.25 0. 3. 0.1. 4. 0.3. Sink. 0.25. 0.2 0.05. d4 0.05 d5. 0.05. 0.25. 0.1. 0.05 Servers. Document. is the number of nodes and E is number of edges. Hence, in the worst case that each document has N replicas, the comp utation complexity of our algorithm is O((N+D)N2D2), which is approximate to O(N3D2), where N is the number of servers and D is the number of documents. Basically, if number of documents is enormous, the complexity is expensive. However, it has not been a serious problem due to the performance improvement of processing unit. Compared the processing overhead of this algorithm with the overhead of displacement of documents, this algorithm may have less cost and is acceptable.. Figure 3-5 Network model with changed capacity 3.6 Overall procedures of our system design. Document 1. Server 1. Sever 2. Server 3. Server 4. 0.667. 0. 0. 0.333. (0.2/0.3) Document 2. 0.167. Start. (0.1/0.3) 0.833. 0. Popularity calculation. 0 Calculating Overhead of Data placement. (0.05/0.3) (0.25/0.3) Document 3. Document 4. 0. 0. 0. 0. 0.667. 0.333. (0.2/0.3). (0.1/0.3). 0. 1 (0.05/0.05). 0. 0. 1. 0. Yes. No. Overload ?. Decay/2. Initial ?. Yes. Updating Decay factor. No Yes Re-calculating dispatching probability. No Decay++. monitor. Data placement. Job dispatching table setup. Selecting content. Query dispatcher. (0.05/0.05). To Client client. Dispatching. Server 1. … ... Document 5. displacement overhead is expensive ?. Server n. Table 3-3 New dispatching Table Figure 3-7 Overall flowchart of our system design Algorithm 2:. Find a maximal flow with minimal cost Input: Let G=(N,A) is a network model where a cost c ij and a capacity u ij associated with every arc (i,j) is belong to A. New access frequencies of documents: P Number of Servers: N Number of Documents D A threshold integer: S Output: New dispatching table T such that every server has equivalent workloads. Program: for any arc (i,j) is belong to A Cij = 1 end for for q=1 to ∞ flow=Maxmial_Flow_by_Ford_Fulkerson() Z(x)=S(cijxij-1/N)2 ,j =sink if Z(x) <=S begin output flow to T halt end if end for Figure 3 - 6 A l g o r i t h m f o r m a x i m a l f l o w a n d m i n i m a l c o s t Thus, we can give a formal algorithm as shown in Figure 3-6. The optimal computation complexity of traditional maximal flow problem is O(VE2) [12], where V. Here, we put all schemes in our system design together. The overall flowchart of our system design is shown in Figure3-7. Every time period, we can adjust the number of replicas according to their popularity or just modify the dispatching table by solving the network maximal-flow and minimal cost problem. It depends on the overhead of displacement of replicas. If the overhead of displacement of replicas is expensive, we would rather adopt the former, and vice versa. Besides, the content adaptation scheme will reduce the impact of probabilistic dispatching scheme. Hence, combining probabilistic dispatching with content adaptation scheme is an efficient method to improve load balance in the web server system.. 4. PERFORMANCE EVALUATIONS. Here, we will give the performance evaluations of our scheme compared with other schemes such as " NCSA [16]" and " Two-Tier RR [3]" in some detail. These performance gains, cache hit rates, rejected probability and maximum request capacity are evaluated and analyzed, from which some distinguished features of our method can be explored. 4.1 Simulation Parameters 5.
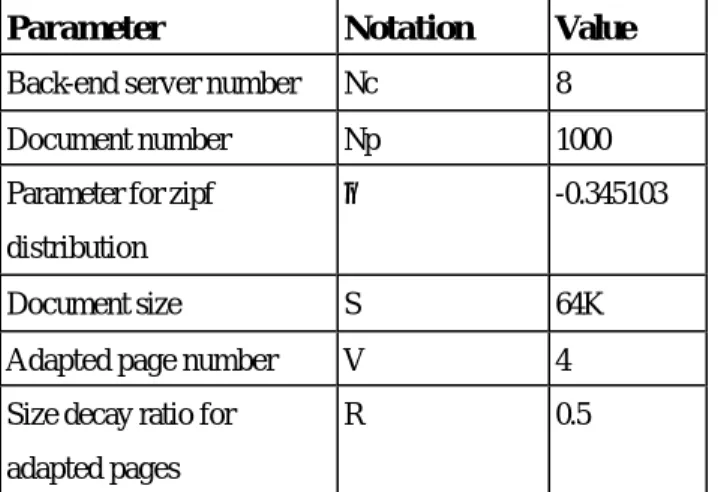
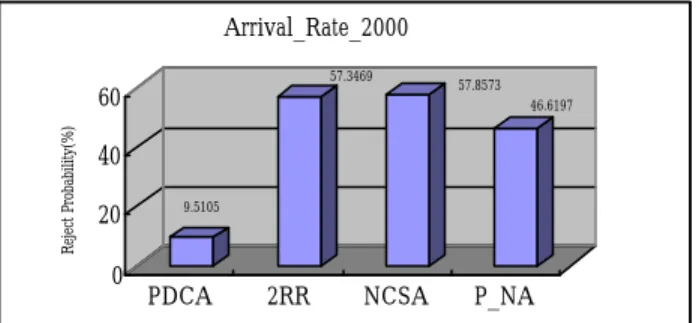
(6) In general, SpecWeb is the industry standard benckmark for measuring web server performance [15]. Basically, it generates a finite number of HTTP requests which retrieve different length files according to a particular file size distribution. However, the variation of data size generated by SpecWeb is so extreme that loses the generality. In order to reduce extreme variation of data size, we refer the average data size evaluated from [14] and set document size as 64k, which is approximate to the average data size generated by SpecWeb. Besides, the document popularity is simulated based on actual workload on several popular web sites[14]. That is, we will set zipf parameter so as to meet a 90/10 access skew in www environment. Several parameters will be given or defined appropriately for our simulation. They are listed below briefly. i)Number of requests: this denotes the number of requests to arrive per second. We will evaluate this value in 400, 500, 600, 700, 800, 1000, and 2000. ii)Trigger content adaptation threshold: this denotes the value determining if a server is overloaded or not. If the proportion of the number of waiting requests compared to the server capacity is beyond this value, we claim that server is overloaded and back-end servers will send an adapted document to clients. We will evaluate this value in 0.8. iii)Memory size: this denotes the maximal number of items that can be cached in memory. We will set it as 32 by default. Other parameters are shown in Table 4-1.. Parameter. Notation. Value. Back-end server number. Nc. 8. Document number. Np. 1000. Parameter for zipf. θ. -0.345103. As shown in Figure 4-2, the performance of reject probability of PDCA is much superior to others due to its high hit rate. Besides, 2RR is better than NCSA due to its more even request distribution among servers. However, 2RR rejects a subset of requests when arrival rate are 800 and 1000 respectively for their low hit rate. In order to observe the circumstance of overloaded mode, we set arrival number as 2000 per second. Besides, we disable our content adaptation policy to observe how adaptation to reduce the impacts on massive traffic. It is marked as "P_NA". As shown in Figure 4-3, PDCA has very lower reject probability compared with others. It is because that our adaptation policy can efficiently decrease the length of waiting queue such that newly coming requests has higher probability to be accepted. It is clearly that NCSA is very close to 2RR due to their resource are exhausted. However, in "P_NA", the popular document requests are distributed to a particular subset of servers. This improves the hit rate of these servers and causes that rejected probability of P_NA is much lower than that of NCSA and 2RR. But, we can find that the difference between PDCA and P_NA is very obvious (about 37%). That is, with cooperation of content adaptation policy, the rejected probability can be decreased significantly in overloaded mode. Figure 4-4 shows maximal requests respectively. Because transmitted documents are adapted, we can find that PDCA has the smaller latency and larger maximal requests than others. Similarly, P_NA is better than 2RR and NCSA for higher hit rate. NCSA is the worst due to its unevenly load distribution. hit rate 1. distribution 64K. Size decay ratio for. V R. 0.4. 4. 2RR. 0.2. 0.5. 0. adapted pages. 400. Figure 4-1 Hit rate comparison in normal mode 40 30.0538. 30. 19.4514. 0. 0 0. 600. 400. 0. 0. 0. 0 0. PDCA. 14.7031. 3.9274. 10 0. 25.1569. 13.1446 9.0921. 20. 500. Reject Probability(%). We will compare PDCA with other schemes under two different modes, normal mode and overloaded mode. Normal mode means that arrival requests number is below the capacity of system. On the other hand, overloaded mode means that arrival requests number is beyond the system capacity. The circumstance of overloaded mode occurs frequently in popular web sites and is worthy of our analysis. Based on the server capacity set by our simulation environment, we view it as normal mode if request arrival number is below 1000. Otherwise, we view it as overloaded mode. Figure 4-1 shows the hit rate comparison in normal mode. It is clearly that PDCA is much better than others. This is because that PDCA has smaller data set for each server than that of 2RR and NCSA. 2RR is very close to NCSA due to common data set stored in servers.. 800. Request arrival rate. Table 4-1 Simulation Parameter 4.2 Preliminary Performance Evaluations. 600. 2RR 0.0259 0. 0. 1000. Adapted page number. NCSA. 0.6. hit rate. 800. S. 700. Document size. PDCA. 0.8. NCSA PDCA. NCSA. Arrival Rate. Figure 4-2 Reject Probability Comparisons in normal mode. 6.
(7) Arrival_Rate_2000 57.3469. 57.8573. Reject Probability(%). 60. 46.6197. 40. 0. In the future, we may enhance our method to the following cases. i) More accurate access behavior prediction. ii) Those heterogeneous web servers in the system. And iii) Attaching server push technique.. 9.5105. 20. PDCA. 2RR. NCSA. P_NA. Maximal Stream. Figure 4-3 Reject Probability Comparison in overload mode 2000. 2000. 1500. 1813. 1067 853. 842. 1000 500 0. Ideal. performance of web servers indeed. Besides, our evaluations also show that our content adaptation policy can provide a higher QoS than any of other schemes in overloaded mode.. PDCA P_NA NCSA. 2RR. Arrival_Rate_2000. Figure 4-4 Maximal Stream Comparison in overload mode. 6. REFERENCES [1] T.F. Abdelzaher, Nina Bhatti," Web Server QoS Management by Adaptive Content Delivery", 7th International Workshop on Quality of Service, pp.216-225, 1999. [2] B.Narendran et al, " Data Distribution Algorithms for Load Balanced Fault-Tolerant Web Access", Proc. of 16th Symposium on Reliable Distributed Systems, pp.97-106, Oct,1997. [3] V. Cardellini, M. Colajanni, P.S.Yu, "Dynamic Load Balancing on Web-Server Systems", IEEE internet computing, vol.3, issue.3, pp.28-39, May-June, 1999. [4] Daniel M.Dias ,William Kish, Rajat Mukherjee ,Renu Tewari, " A Scalable and Highly Available Web Server", Proc. of Compcon '96, pp.85-92, Feb,1996.. 5. CONCLUDING REMARKS. In this paper, we have described an effective load distribution method with popularity-based replication and content adaptation techniques. We also build a simulation environment to evaluate the performance of our methods and compared with other methods in some detail. In summary, the main features of our techniques are listed below. i)A popularity-based replication concept is introduced. According to the popularity of the document, we assign it the different number of replicas. With pre-computing access probability and replicas of documents, we also propose a data placement scheme such that all servers may have equivalent workloads within a specific period. ii) An efficient load distributing policy, named “ Probabilistic Dispatching with Content Adaptation” is proposed. It distributes load among servers based on pre-computing access probability. It is unnecessary to communicate with back-end servers frequently such that system design and implementation is simplified. In order to reduce the impact of burst traffic due to probabilistic load distribution, content adaptation scheme is proposed. We find that our content adaptation scheme not only cooperates our load distribution policy but also guarantees QoS of overloaded servers. iii) The evaluations show that our scheme has better performance than 2RR and mirror in normal mode. Even in overloaded mode, our scheme without content adaptation function is also much better than them. Hence, we ensure that load distribution should be determined by requested documents and our scheme improves the load balance and. [5] Michael Rabinovich, Amit Aggarwal, "RaDaR: a scalable architecture for a global Web hosting service", ACM Computer Networks, vol.31, pp.1545-1561, July, 1999. [6] Azer Bestvaros, " Demand-based Document Dissemination to Reduce Traffic and Balance Load in Distributed Information Systems", Proc. of 7th IEEE Symposium on Parallel and Distributed Processing, pp.338-345, 1995. [7] Vivek S. Pai, Mohi Aron, and Gaurav Banga, "Locality-Aware Request Distribution in cluster-based Network Servers", Proc. of the 8th International Conference on Architectural Support for Programming Languages and Operating Systems, pp.1-12, 1998. [8] R. Vingralek, Y. Breitbart, and G. Weikum, " SNOWBALL: Scalable Storage on Networks of Workstations with Balanced Load", ACM Distributed and Parallel Database, vol.6, pp.117-156, May,1998. [9] W.S. Huang, An Effective Data Placement Scheme For Supporting Fault-Tolerance in Distributed Video Server Environment, Master Thesis, CSIE, NCTU, June, 1999. [10] Edith Cohen et al., " Efficient Algorithms for Predicting Requests to Web Servers", Proc. of INFOCOM '99, pp.284-293, 1999. [11] Thomas D. C et al., " Popularity-Based Assignment of Movies to Storage Devices in a Video-on-Demand system". Multimedia Systems, Vol.2, No.6, pp.280-287, January, 1995. 7.
(8) [12] H. Cormen et al, Introduction to Algorithms, McGraw-Hill Book Company, pp.579-599, 1989. [13] Steven J. Leon, Linear algebra with applications, Prentice-Hall, pp.233-241. [14] Andy Myers, Peter Dinda, and Hui Zhang, " Performance Characteristics of Mirror Servers on the Internet", Proc. of IEEE INFOCOM '99, vol.1, pp.304-312, 1999. [15] The Workload for the SPECweb96 Benchmark, http://www.specbench.org /osg/ web96/workload.html [16] Kwan, T.T et al, " NCSA's World Web Server: design and performance", IEEE Computer Vol. 28, Issues 11, pp.68-74, Nov, 1995.Helen Meng., Senis Busayapongchai, and Victor Zue, et al. “WHEELS: A Conversational System in the Automobile Classification Domain,” ICSLP ’96 Vol. 1. pp. 542-545, 1996. [17] William Stallings, ”Data and Computer Communications”, Fifth Editions, Prentice Hall International Editions.. 8.
(9)
數據

+3
相關文件
• To introduce the use of the LPF as a tool for planning the school English Language curriculum; and
Understanding and inferring information, ideas, feelings and opinions in a range of texts with some degree of complexity, using and integrating a small range of reading
Writing texts to convey information, ideas, personal experiences and opinions on familiar topics with elaboration. Writing texts to convey information, ideas, personal
Robinson Crusoe is an Englishman from the 1) t_______ of York in the seventeenth century, the youngest son of a merchant of German origin. This trip is financially successful,
fostering independent application of reading strategies Strategy 7: Provide opportunities for students to track, reflect on, and share their learning progress (destination). •
Strategy 3: Offer descriptive feedback during the learning process (enabling strategy). Where the
Now, nearly all of the current flows through wire S since it has a much lower resistance than the light bulb. The light bulb does not glow because the current flowing through it
Writing texts to convey simple information, ideas, personal experiences and opinions on familiar topics with some elaboration. Writing texts to convey information, ideas,
• Flux ratios and gravitational imaging can probe the subhalo mass function down to 1e7 solar masses. and thus help rule out (or
