行政院國家科學委員會專題研究計畫 成果報告
呂宋海峽的鋒面系統與海洋生產力(台菲國際合作計畫)
計畫類別: 個別型計畫
計畫編號: NSC93-2119-M-002-034-
執行期間: 93 年 10 月 01 日至 94 年 11 月 30 日
執行單位: 國立臺灣大學海洋研究所
計畫主持人: 劉倬騰
共同主持人: 許明光
計畫參與人員: Eileen Peñ;aflor, Laura David, Cesar Villanoy, 粘
慶熙, 王迪慰
報告類型: 精簡報告
報告附件: 國際合作計畫研究心得報告
處理方式: 本計畫可公開查詢
Monsoonal bloom of phytoplankton in Luzon Strait
Eileen Peñaflor1, Laura David1, Cesar Villanoy1, Ching-Hsi Nan2, Dee-Way Wang2, Cho-Teng Liu2 1
Marine Science Institute, University of the Philippines, Diliman, Quezon City 2
Institute of Oceanography, National Taiwan University, Taipei
Abstract
The Luzon Strait experiences a seasonal surge of phytoplankton based on ocean color data. To examine the timing and position of the bloom, daily MODIS-derived chlorophyll data (2002-2005) were acquired and analyzed. Supporting data such as MODIS-derived SST and TSS, Quickscat wind data, river discharge, and bathymetry were also obtained and processed in order to investigate the possible driving forces behind the bloom occurrence. Results show that chlorophyll concentration in the Luzon Strait dramatically increases during NE monsoon reaching to approximately 2.0 mg/m3. Highest chlorophyll concentration is observed at the western slope of the Luzon Strait that possibly spreads westward in the northern SCS. This monsoonal phenomenon is due to upwelling, which is strongly associated with the intense Kuroshio penetration during this season and the complicated topography of the Luzon Strait. The northward movement of Luzon coastal current, the southward flow of cold water from East China Sea, and positive wind stress curl could also contribute to this occurrence. The influence of Cagayan River, however, is only limited to the northwest tip of Luzon.
1. Introduction
The Luzon Strait is the main channel through which effective water exchange between the Western Pacific Ocean and the South China Sea (SCS) occurs. The strait has a width of about 350 km (Farris and Wimbush, 1996) and has a sill depth of 1900 m (Liu et
al., 2002; Chen et al., 2003). Figure 1 shows the location of Luzon Strait. The other
channels surrounding the SCS are either too narrow or too shallow to allow effective interaction with its surrounding waters (Metzger and Hurlburt, 2001a).
Fig.1. Map showing the South China Sea and Luzon Strait. Data extracted from National Geophysical Data Center ETOPO2-2 minute global relief.
The presence of fronts is evident in Luzon Strait (Wang et al., 2001). Large differences in the water column characteristics and the transition from the SCS to Pacific characteristics can be observed as fronts separate the two waters. These fronts in the Luzon Strait are associated with the presence of the northward flowing Kuroshio moving from the east of Luzon to the east of Taiwan.
This northward flowing current has been found to intrude into the SCS through the Luzon Strait. Studies have shown that the Kuroshio from the West Philippine Sea (WPS) penetrates the northern SCS through the deepest channels in the southern part of the Luzon Strait: the Balintang Channel and south of Babuyan Island (Centurioni, et al., 2004; Metzger and Hurlburt, 2001b). This brings in Kuroshio’s top 300 m water westward along the continental slope south of China (Shaw & Chao, 1994). The intrusion, which is occasionally called as the Luzon Strait loop current, penetrates most severely into the South China Sea during the October–January period (Farris and Wimbush, 1996; Centurioni et al., 2004), concurrent with the northeast (NE) monsoon. The westward movement of the Kuroshio is believed to be related to Ekman advection due to the direction of the wind during NE monsoon. A reasonable relationship between loop-current stage and wind stress history was derived by Farris and Wimbush (1996).
110 112 114 116 118 120 122 124 6 8 10 12 14 16 18 20 22 24 -6500 -6000 -5500 -5000 -4500 -4000 -3500 -3000 -2500 -2000 -1500 -1000 -500 0 500 1000 1500 2000 2500
South
China
TaiwanLuzon
Strait
Luzon
The deep WPS water also enters the SCS through this strait. This is evident in the water characteristics of SCS below the sill depth, which has been found to resemble those in the WPS water at sill depth (Nitani, 1972; Chen and Huang, 1996). Further studies have shown that the deep WPS water that flows down the sill of the Luzon Strait is constantly filling the SCS basin (Gong et al., 1992; Chen et al., 2001). The deep SCS water, on the other hand, is believed to upwell and mix with surface water forming the intermediate SCS water (Gong et al., 1992) that flows out of the SCS through the northern end of Luzon Strait forming part of the northward flowing Kuroshio (Chen et al., 2001) at the eastern side of Taiwan. This upwelling results to an uplift in nutricline and thermocline in the SCS by as much as 100 m in comparison to the WPS (Gong et al., 1992).
Areas of localized upwelling have also been identified in the various parts of the SCS. A study by Liu et al. (2002) shows that the deep chlorophyll maximum depth in the west of Luzon changed from about 75 m in September 1998 to about 40 m in January 1999, suggesting an occurrence of seasonal upwelling in the area. This upwelling in the west of Luzon is most likely connected to the winter phytoplankton bloom observed by Tang et al. (1999) in the southwest of Luzon Strait based on Coastal Zone Color Scanner (CZCS) data. Other studies have also shown upwelling to occur in the west of Luzon and north of Sunda Shelf during NE monsoon and in the east coast of Vietnam during southwest (SW) monsoon (Chao et al.,1996; Shaw et al.,1996; Udarbe-Walker and Villanoy, 2001; Liu et
al., 2002).
The surface circulation of the SCS is also affected with the reversal of monsoon. The NE monsoon drives the surface water in the SCS to its cyclonic motion with a strong southward flow along the coast of Vietnam, averaging to about 0.92 m/s in the core (Chu
et al., 1998) while the SW monsoon forces the surface water to reverse its flow but
mainly in the southern basin (Shaw and Chao, 1994; Hu et al., 2000; Liu et al., 2002; Xue et al., 2004). In addition, studies have shown that during NE monsoon season several cyclonic eddies, which can also induce upwelling, are formed in the west of Luzon (Hu et al., 2000; Wang et al., 2003).
Consequently, the alternating monsoons, obviously, have an enormous influence on the productivity in SCS and in Luzon Strait, in particular, but some other factors may also have a contribution. Pinazo et al. (2001) showed that the nutrients carried in the freshwater runoff, together with the influence of local winds, have significant effect in increasing the phytoplankton biomass in the Gulf of Lions in the Mediterranean. The effect of tides (Gomez et al., 2004), internal waves (Sangra et al., 2001), and island mass (Signorini et al., 1999) have also been shown to enhance local productivity.
In Luzon Strait, where seasonal phytoplankton bloom has been documented, examining the patterns of bloom formation in the area is significant for fisheries management. Understanding the various factors involved in the occurrence of phytoplankton bloom is also necessary. This study, therefore, (1) presents the patterns of wane and wax of phytoplankton in the strait and (2) examines the various contributing factors to the productivity of this area.
2. Data and Methods
MODIS- derived chl-a and SST
Moderate Resolution Imaging Spectroradiometer (MODIS)-derived surface chlorophyll-a (chl-a) and sea surface temperature (SST) were the primary data used in this study. Daily images (July 2002-May 2005) of processed level 2 (L2) MODIS data containing the derived chl-a, SST, and radiances of bands 1–5 were downloaded from the National Aeronautics and Space Administration- Goddard Space Flight Center (NASA-GSFC) at their website at http://oceancolor.gsfc.nasa.gov/. The downloaded 1x1 km resolution MODIS images cover 17-24 0N and 110-124 0E.
Extraction of daily chl-a and SST information was then made. Image selection was done to remove images with no data and monthly average composites were computed. Pixel correlation between the two parameters using the monthly composites of 2004 was also performed and correlation coefficient map was produced. Furthermore, the study area was narrowed to 116-1240E and 18.3-220N (Figure 2) to better emphasize the temporal variation in monthly average chl-a concentration and SST in the strait.
Fig.2. The red box shows the entire area where chl-a and SST values were extracted.
Quickscat-derived wind stress curl
The wind data used in this study were taken from the NASA-Jet Propulsion Laboratory (JPL). Daily QuikSCAT Level 3-Derived Multialgorithm Surface Wind Stress data (2002-2004) were downloaded from the NASA-JPL ftp site at ftp://podaac.jpl.nasa.gov/pub/ocean_wind/quikscat/L3/. The level 3 data are provided on a global grid of 1440 pixels in longitude by 720 pixels in latitude (0.25° by 0.25°). This wind product contains the ascending and descending wind stresses for both u and v components that were calculated using two algorithms (Liu & Tang, 1986 and Large & Pond, 1981) as described in the JPL Quikscat webpage.
Wind stress curl at each 0.250 x 0.250 grid point that encompassed the study area was then calculated by first averaging the ascending and descending wind stress for both components (using Liu & Tang, 1986) and then applying the algorithm for calculating the
115 120 125 130
10 15 20 25
curl (NOAA, 2005). Frequency of positive wind stress curl greater than 0.05 x 10⁻⁵ N m-3 for each month were then extracted to highlight areas that are probable upwelling sites. This cutoff value was selected since it can best delineate the potential upwelling sites from others (i.e. presence of storm). Monthly values of wind stress curl at the core of the identified upwelling site were taken and correlated with monthly chl-a concentration. This correlation was applied for 2004 monthly composites.
MODIS-derived suspended sediment
Additional analysis on total suspended sediment (TSS) as proxy for determining river discharge influence was done by utilizing the radiances of bands 4 and 5 and employing the algorithm described in Delu et al. (1999). Monthly composites of TSS were then made to render monthly images. Furthermore, the monthly TSS composites of 2004 were later used to correlate with the mean monthly river discharge data of Cagayan River.
River discharge
River discharge data was also collected to provide information on the peak flows and months and the possible influence of the nearby rivers to the phytoplankton distribution in the study area. River discharge information for Cagayan River was downloaded from SAGE River Discharge Database at http://www.sage.wisc.edu/riverdata/.
Bathymetry:
Bathymetric data was also utilized in this study as supporting data. The ETOPO2-2 minute global relief data covering 5-24 0N and 105-124 0E (encompasses the entire SCS) was downloaded from the National Geophysical Data Center (NGDC) - NOAA Satellite and Information Service at http://www.ngdc.noaa.gov/mgg/image/2minrelief.html.
3. Results
Seasonal variation in chl-a concentration and SST
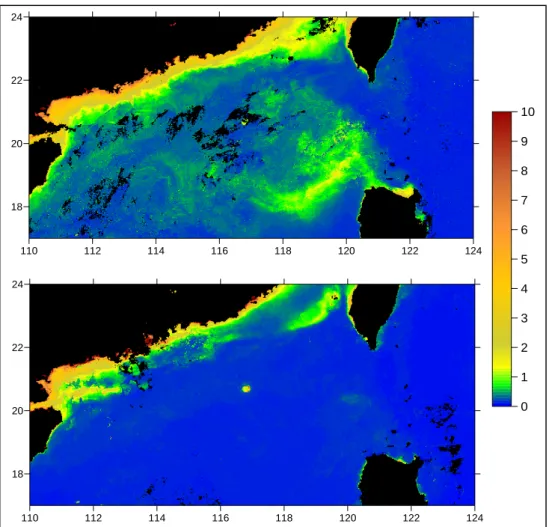
In most months, chl-a concentration in the Luzon Strait and on its surrounding areas is relatively low (< 0.2 mg/m3). High concentration can only be observed at the northern tip of Luzon. This condition is a huge difference to the high chl-a concentration during November to March, although a noticeably slight increase in the Luzon Strait can already be observed as early as October. During NE monsoon, high chl-a concentration, indicating an increase in phytoplankton biomass, is evident in the western side of the strait extending to the northern SCS. An example is shown in Figure 3. In this figure, the December image shows a distinctive diagonal strip (118.700E, 18.330N to 120.250E, 19.740N) of high chl-a concentration that reaches to approximately 2.0 mg/m3. Variation in the form or shape of the bloom was noted for other years but a common observation is that the bloom tends to start within or near the vicinity of this diagonal strip.
Fig. 3. Surface chl-a concentration for December 2003 (above) and June 2004 (below). Concentration is in mg/m3. 110 112 114 116 118 120 122 124 18 20 22 24 0 1 2 3 4 5 6 7 8 9 10 110 112 114 116 118 120 122 124 18 20 22 24
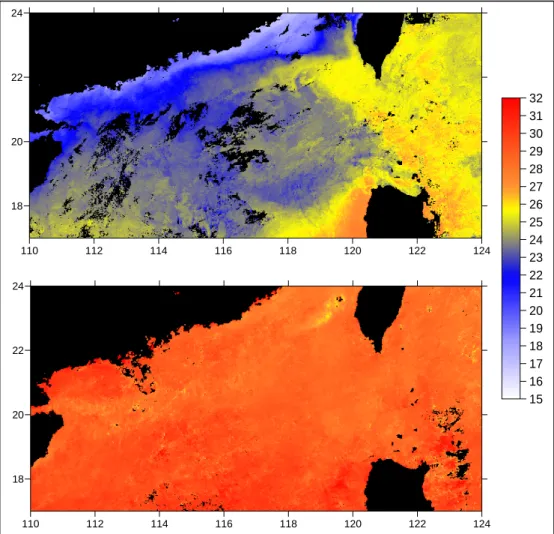
Concurrent with the bloom is the occurrence of relatively cooler temperature in areas with high chl-a concentration. In the December 2003 SST image of Figure 4, a spatial difference in temperature is evident. Areas with high chl-a concentration shown in Figure 3 have a relatively cooler temperature. A distinctively high SST on the west of Luzon (~30 O
C) and on the eastern side extending to the Luzon Strait can also be observed, creating thermal fronts in the area. This is in contrast to the non-bloom months when there is an almost uniform distribution of high SST.
Fig. 4. Sea surface temperature (SST) for December 2003 (above) and June 2004 (below) expressed in degree Celcius (OC).
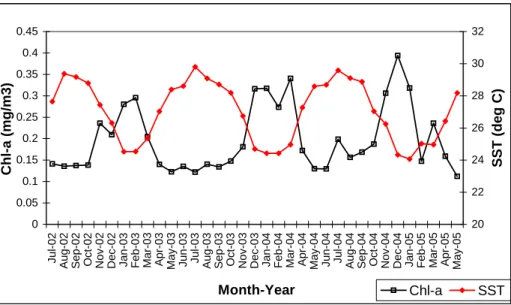
High seasonality in chl-a and SST is observed in all 35 monthly composite images that were generated. Figure 5 shows the monthly variation in average chl-a and SST in the area defined in Figure 2. A high chl-a concentration coupled with a decrease in SST can be observed during the months of November-March. Average monthly chl-a concentration peaks during December (0.306 mg/m3), although the actual high peak can shift between November to March in different years. The SST, however, shows a consistent lowest temperature during the month of January averaging 24.34OC.
110 112 114 116 118 120 122 124 18 20 22 24 15 16 17 18 19 20 21 22 23 24 25 26 27 28 29 30 31 32 110 112 114 116 118 120 122 124 18 20 22 24
Fig. 5. Time series of averaged surface chl-a concentration and SST in the area defined in Fig. 2.
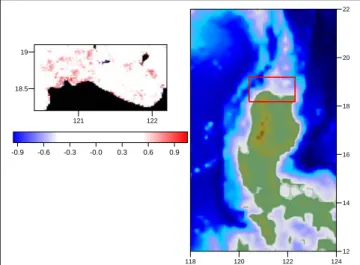
A spatial correlation between chl-a and SST is shown in Figure 6. No correlation can be observed in areas with relatively higher SST (on the west and eastern side of Luzon extending to the strait) and in areas that consistently have high chl-a concentration, such as most area of northern Luzon. A high negative correlation, however, exists on the region southwest of Luzon Strait where seasonal elevation of chl-a concentration occurs.
Fig. 6. Correlation coefficient (r) between chl-a and SST for 2004. Colored areas represent areas where lrl > 0.5. 117 118 119 120 121 122 123 18 19 20 21 -0.9 -0.7 -0.5 -0.3 -0.1 0.1 0.3 0.5 0.7 0.9 0 0.05 0.1 0.15 0.2 0.25 0.3 0.35 0.4 0.45 Jul-02 Aug-02 Sep-02
Oct-02 Nov-02 Dec-02
Jan-03 Feb-03 Ma r-0 3 Ap r-0 3 May-03 Jun-03 Jul-03 Aug-03 Sep-03
Oct-03 Nov-03 Dec-03
Jan-04 Feb-04 Ma r-0 4 Ap r-0 4 May-04 Jun-04 Jul-04 Aug-04 Sep-04
Oct-04 Nov-04 Dec-04
Jan-05 Feb-05 Ma r-0 5 Ap r-0 5 May-05 Month-Year Chl-a (mg/m3) 20 22 24 26 28 30 32 SST (deg C) Chl-a SST
The influence of wind
A distinct positive wind stress curl northwest of Luzon can be observed, which centers at approximately 119.540E and 17.490N. This high positive curl happens during months of bloom occurrence. Simultaneous with the high positive wind stress curl northwest of Luzon is another positive wind stress curl (but slightly smaller and weaker) located southwest of Taiwan. An example is presented in Figure 7 where it shows the frequency of occurrence of wind stress curl >0.05 x 10⁻⁵ N m-3 in December 2003. High frequency, which starts in October and ends up in March, can be observed offshore northwest of Luzon. This may indicate that one of the forcing mechanisms behind the bloom is upwelling due to positive wind stress curl or Ekman suction.
Fig. 7. Wind stress curl frequency for curl values >0.05 x 10⁻⁵ N m-3 (December 2003).
Results from the correlation analysis (Figure 8) shows a high correlation coefficient (r>0.5) between wind stress curl and chl-a off Luzon and on the northwest tip of Luzon. Influence of the wind stress curl, however, is only confined to a smaller area.
Fig. 8. Correlation coefficient (r) between wind stress curl and chl-a for 2004 (left image).Colored areas represent areas where lrl > 0.5. The red box on the right image denotes the area covered in the correlation map.
118 120 122 124 12 14 16 18 20 22 120 121 18 19 -0.9 -0.6 -0.3 -0.0 0.3 0.6 0.9 110 115 120 18 20 22 24 0 2 4 6 8 10 12 14
The influence of river discharge
One of the possible sources of nutrients in the strait is the Cagayan River, which is largest river in the Philippines. River discharge data shows that the river reaches its peak discharge during November averaging to 706.6 m3/s (1969-1974). The discharge then starts to decrease in December. On the other hand, lowest discharge can be observed during April (79.75 m3/s). This high discharge during November may have a possible influence to the high chl-a concentration off northern Luzon since it occurs during the presence of the bloom.
Image results show that a high increase in TSS can be observed at the mouth of the river during November indicating the intensity of the river flow during the month. The spatial extent of the river discharge, however, is likely concentrated in the nearby coast. Figure 9 shows the TSS concentration in the area.
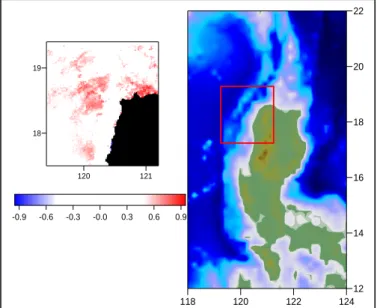
Furthermore, pixel correlation shows that the Cagayan River influence is only limited near the northern coast of Luzon (Figure 10). Higher r values (>0.5) can be observed on the northwest of Luzon. The low r values near the mouth of the river shows that this area is experiencing little changes in TSS throughout the year.
Fig. 9. Suspended sediment distribution during the peak of Cagayan River discharge in November (2003). Encircled area shows that the river discharge is likely to influence only the nearby coast. Blue arrows directs to the location of the mouth Cagayan River.
Fig. 10. Correlation coefficient (r) between monthly TSS (2004) and mean monthly discharge of Cagayan River (left image). The red box on the right image represents the area covered in the correlation map.
118 120 122 124 12 14 16 18 20 22 121 122 18.5 19 -0.9 -0.6 -0.3 -0.0 0.3 0.6 0.9 110 112 114 116 118 120 122 124 18 20 22 24 0 2 4 6 8 10 12 14 16 18 20 22 24 26 28 30
The influence of Kuroshio instrusion
Seasonal occurrence of distinct thermal fronts due to the westward intrusion of Kuroshio and the northward movement of SCS water on the west of Luzon can be observed during NE monsoon. Figure 11 shows that a sudden increase in chl-a concentration can be observed on the western side of Kuroshio and on the west of Luzon coinciding with the traced thermal fronts. This shows that the currents in the northern SCS, specifically that of Kuroshio, highly influences the observed seasonal elevation of chl-a concentration in the area.
Figure 11. Traced fronts due to intrusion of Kuroshio (yellow) and the high SST west of Luzon (red) overlayed on the MODIS chl-a image (December 2003). The pink arrow points to the location of the high chl-a strip.
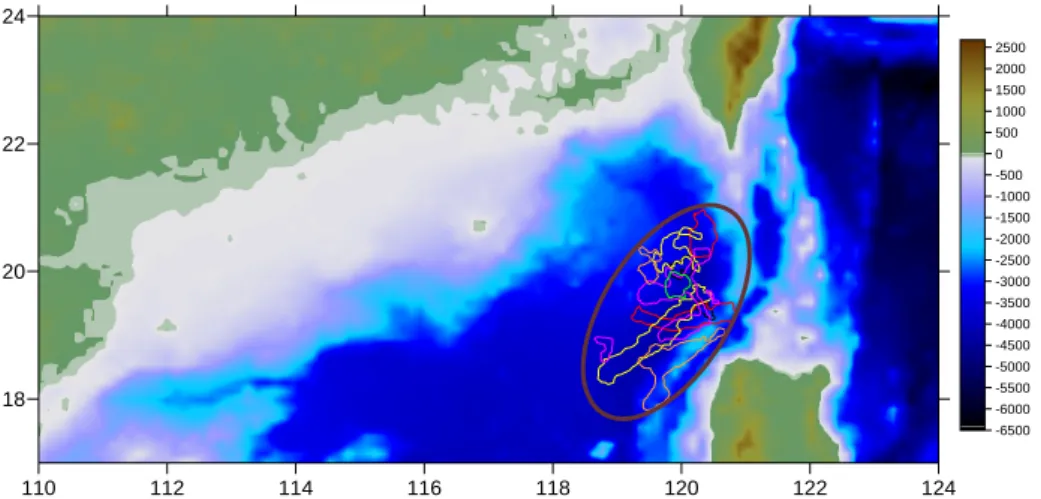
Furthermore, areas with the highest chl-a concentration for the NE monsoon months were found to congregate on the western slope of the Luzon Strait. The cluster of highest chl-a tends to intensity and move southward throughout the NE monsoon season as westward intrusion of Kuroshio strengthens.
Fig. 12. Ellipse encloses the areas of highest chlorophyll concentration. Different colors represent different months from October 2003 – March 2004.
110 112 114 116 118 120 122 124 18 20 22 24 -6500 -6000 -5500 -5000 -4500 -4000 -3500 -3000 -2500 -2000 -1500 -1000 -500 0 500 1000 1500 2000 2500 110 112 114 116 118 120 122 124 18 20 22 24
4. Discussion
The occurrence of phytoplankton bloom in Luzon Strait follows a monsoonal pattern. High chlorophyll concentration can be observed from November to March that extends to the northern SCS during its peak, although a slight increase can already be observed as early as October during the onset of NE monsoon.
The occurrence of the bloom during NE monsoon is simultaneous to the presence of thermal fronts in the Luzon Strait and in the northeast SCS due to the intrusion of the Kuroshio and the northward movement of the SCS warm water west of Luzon. It is also during this season that the southward flow of Guangdong coastal current (Fang et al., 1998) carrying cold water from the East China Sea occurs. This can be seen in Figure 4 where a relatively low SST is present on the northern SCS. The year-round presence of northward flowing Luzon coastal current (LCC) west of Luzon (Fang et al., 1998; Hu et
al., 2000), which moves against the westward intrusion of Kuroshio has also been
documented. Furthermore, a lowering in SST (Figure 5) can be observed when elevation in chlorophyll occurs. This tells us that a considerable amount of cold, nutrient-rich water is present during this season, which could come from new supply or regenerated nutrients by upwelling. Further support was acquired from the pixel correlation result (Figure 6) showing that the area with high chl-a concentration off northwest of Luzon gives the highest negative correlation coefficient with SST.
The circulation in the northern SCS during NE monsoon, which is closely connected to the movement of water in the straits of Taiwan and Luzon (Hu et al., 2000), is seen to play a significant role in the formation of the bloom during this season. The interaction of the westward movement of Kuroshio, the southward Guangdong coastal current, and the northward LCC possibly induces the formation of phytoplankton bloom. Figure 11 shows the rapid increase in chl-a concentration on the western edge of the Kuroshio. The sloping isopycnals along the western edge of the Kuroshio can induce upwelling by interaction with the topography and changes in position and acceleration. The high chlorophyll concentration that can be observed from the tip of northwest Luzon towards the high chl-a strip is most likely due to upwelling brought about by the opposing movements of a branch of Kuroshio penetrating the Babuyan Channel near the mouth of Cagayan River and the LCC and their interaction with the topography of the area. Intrusion of Kuroshio during SW monsoon, however, is not evident in the satellite images due to the rapid increase of SST in the SCS during this season. It is also during this time that the wind advects SCS water against the Kuroshio. However, Hu et al. (2000) mentioned that intrusion can also happen in some other time of the year but of less intensity.
The remarkable increase in phytoplankton biomass during NE monsoon is also concurrent with the presence of two upwelling sites based on the results of wind stress curl analysis. These two upwelling sites, one located offshore northwest of Luzon and another on southwest of Taiwan, disappear during SW monsoon. Chao et al. (1996) has shown that a deep water upwelling also occur in the southwest of Taiwan as a result of upward entrainment as Pacific water flows into the SCS through the Luzon Strait. On the other hand, upwelling in the northwest of Luzon during NE monsoon has been identified in previous studies. This upwelling has been attributed to the convergence in the eastern boundary current (Chao et al.,1996), convergence of northward undercurrent flow (Shaw
et al., 1996), isotherm uplifting (Udarbe-Walker and Villanoy, 2001), and positive wind
stress curl (Qu, 2000). The effect of wind stress curl to the phytoplankton biomass was investigated by correlating the said parameter with the chl-a concentration. Pixel correlation (Figure 8), however, shows a minimal influence of wind stress curl to the seasonal abundance of phytoplankton. The discrepancy between the location of wind stress curl and correlation result may be due to advection by the LCC.
In northern SCS, nutrient flux coming from the nearby rivers such as the Cagayan River and Pearl River may also contribute to the productivity of the area. Data shows that Cagayan River peaks during November when phytoplankton bloom also occurs. Hence, a TSS analysis was conducted. Based from the results, the TSS near the mouth of Cagayan River intensifies during the peak of river discharge (Figure 9). The influence of the river, however, is likely concentrated on nearby vicinity. Moreover, the deflection of a branch of Kuroshio penetrating into the Babuyan Channel near the mouth of Cagayan River (Figure 11) likely traps the majority of the river discharge within few kilometers from the coast. This area has shown to be consistently high in chl-a concentration all throughout the year (Figure 6). Pixel correlation (Figure 10) also shows the limited influence of Cagayan River to the study area. Low correlation on the north of Cagayan River can be attributed to the little changes in TSS supply in the area. A higher correlation on the west of Cagayan River, on the other hand, maybe due to the westward advection of currents. This area has also shown to have a seasonal increase in chl-a (Figure 3) and a negative correlation between SST and chl-a (Figure 6).
Based from the results, the intensity of the surface chlorophyll signal during NE monsoon as observed from the ocean color data is likely influenced more by the interaction of the current movement in the northern SCS. The strength of Kuroshio intrusion is seen to be the major forcing behind the strong upwelling. In the study of Xue et al. (2004), the Ekman-induced movement of Kuroshio water during NE monsoon generates upwelling when moving upslope to the northern shelf of SCS. In addition to these current flows is the effect of the complicated bottom topography of the area. Figure 12 shows the bottom topography of the study area overlayed with the traced areas where highest monthly chlorophyll concentration for 2004 was observed. The figure shows that highest concentrations are clustered within the western slope of the strait. Changes in the position and intensity of monthly chl-a cluster are determined by the strength and position of Kuroshio intrusion. The high chlorophyll cluster moves southward and intensify as Kuroshio penetrates strongly. A northward subsurface convergence, as described by Shaw et al. (1996), at the west side of Luzon Strait could also help to explain this occurrence.
5. Conclusion
This study shows that the phytoplankton bloom in the southwest of Luzon Strait is due mainly to the intense upwelling. This upwelling observed during the NE monsoon is associated with the intense Kuroshio penetration during this season and the complicated topography of the Luzon Strait. Intensification of Kuroshio penetration to the northern SCS drives the SCS subsurface water to upwell upon encountering the sills in western Luzon Strait. The opposing movement of northward flowing LCC and westward Kuroshio could also induce upwelling on the northwest tip of Luzon. The positive wind stress curl plays an additional role in upwelling cold, nutrient-rich water offshore west of Luzon and on the northwest tip of Luzon. The nutrients carried by the southward movement of cold water from East China Sea may also contribute to the formation of the phytoplankton bloom. The contribution of Cagayan River, however, is only limited to the northwest tip of Luzon.
References:
Centurioni, L. C. , P.P.Niiler, and D.-K.Lee, 2004. Observations of Inflow of Philippine Sea Surface Water into the South China Sea through the Luzon Strait. Journal of
Physical Oceanography 34,113-121.
Chao, S-Y., P.T.Shaw, and S.Y.Wu, 1996. Deep water ventilation in the South China Sea. Deep-Sea Research I 43 (4), 445-466.
Chen, C. T. A. and M.H. Huang, 1996. A Mid-Depth Front Separating the South China Sea Water and the Philippine Sea Water. Journal of Oceanography 52,17-25. Chen, C.T.A., Huang, M.H., 1995. Carbonate chemistry and the anthropogenic CO2 in
the South China Sea. Acta Oceanologica Sinica 14, 47–57.
Chen, C. T. A., S.L.Wang, B.J.Wang, and S.C.Pai, 2001. Nutrient budgets for the South China Sea basin. Marine Chemistry 75, 281-300.
Chen, Y. L., H.Y.Chen, and Y.H.Lin, 2003. Distribution and downward flux of Trichodesmium in the South China Sea as influenced by the transport from the Kuroshio Current. Marine Ecology Progress Series 259, 47-57.
Chu, P., Y.Chen, and S.Lu, 1998. Wind-Driven South China Sea Deep Basin Warm-Core/Cool-Core Eddies. Journal of Oceanography 54, 347-360.
Delu, P., H. Haiqing, M. Tingming, and M. Zhehau, 1999. Ocean color remote sensing by SeaWIFS in China. Proceedings 1999 Asian Conference of Remote Sensing. http://www.gisdevelopment.net/aars/acrs/1999/ts8/ts8348.shtml
Fang, G. H., W. D. Fang, Y. Fang and K. Wang, 1998. A survey of studies on the South China Sea upper ocean circulation. Acta Oceanographica Taiwanica, 37(1), 1–16. Farris, A. and M.Wimbush, 1996. Wind-Induced Kuroshio Intrusion into the South China
Sea. Journal of Oceanography 52, 771-784.
Gomez, F., G.Gorsky, E.Garcia-Gorriz, and M.Picheral, 2004. Control of the phytoplankton distribution in the Strait of Gibraltar by wind and fortnightly tides.
Estuarine, Coastal and Shelf Science 59:485-497.
Gong, G.C., K.K. Liu, C.T. Liu, S.C. Pai, 1992. Chemical hydrography of the South China Sea and a comparison with the West Philippine Sea. Terrestrial, Atmosphere,
and Ocean Sciences 3, 587–602.
Ho, C. R., Q.Zheng, N.J.Kuo.C.H.Tsai, and E.Huang, 2004. Observation of the Kuroshio intrusion region in the South China Sea from AVHRR data. International Journal
of Remote Sensing preview article.
Hu, J., H. Kawamura, H. Hong, and Y. Qi, 2000. A review on the currents in the South China Sea: Seasonal circulation, South China Sea Warm Current and a southwestward current and Kuroshio intrusion. Journal of Oceanography, 56, 607-624.
Liu, K.-K., S.-Y.Chao, P.-T.Shaw, G.-C.Gong, C.-C.Chen, and T.Y.Tang, 2002. Monsoon-forced chlorophyll distribution and primary production in the South
China Sea: observations and a numerical study. Deep-Sea Research I 49, 1387-1412.
Metzger, E.J. and H.E. Hurlburt, 1996. Coupled dynamics of the South China Sea, the Sulu Sea, and the Pacific Ocean. Journal of Geophysical Research 101 (C5), 12331-12352.
Metzger, E.J. and H.E. Hurlburt, 2001a. The nondeterministic nature of the Kuroshio penetration and the eddy shedding in the South China Sea. Journal of Physical
Oceanography 31, 1712-1732.
Metzger, E.J. and H.E. Hurlburt, 2001b. The importance of high horizontal resolution and accurate coastline geometry in modeling South China Sea inflow. Geophysical
Research Letters 28 (6), 1059-1062.
Metzger, E.J., 2003. Upper ocea sensitivity to wind forcing in the South China Sea.
Journal of Oceanography, 59, 783-798.
Nitani H., 1972. Beginning of the Kuroshio. In: Kuroshio, H. Stommel and K. Yoshida, editors, University of Washington Press, Seattle, pp. 129-163.
NOAA, 2005. Scientific User Manual: processing algorithms and data validation In: Mean Surface Wind Field from the ERS-AMI and ADEOS-NSCAT Microwave Scatterometers 1991/08/05 to 2000/05/31.
http://www.nodc.noaa.gov/woce_V2/disk14/MWF_HTML/SERVICES/MWF_SCI/ E_INDEX.HTM
Pinazo, C., P. Marsaleix, B. Millet, C. Estournel, V. Kondrachoff, and R. Vehil, 2001. Phytoplankton variability in summer in the northwestern Mediterranean: Modelling of the wind and freshwater impacts. Journal of Coastal Research 17 (1), 146-161. Qu, T., H.Mitsudera, and T.Yamagata, 2000. Intrusion of the North Pacific waters into the
South China Sea. Journal of Geophysical Research 105 (C3):6415-6424.
Qu, T., 2000. Upper-Layer Circulation in the South China Sea. Journal of Physical
Oceanography 30,1450-1460.
Sangra, P., G. Basterretxea, J.L. Pelegri, and J. Aristegui, 2001. Chlorophyll increase due to internal waves on the shelf break of Gran Canaria (Canary Islands).
Scientia Marina 65 (Suppl. 1), 89-97.
Shaw P., S. Chao, 1994. Surface circulation in the South China Sea. Deep-Sea
Research I 41,1663–1683.
Shaw, P.-T., S-Y. Chao, K.-K. Liu, S.-C. Pai, and C.-T. Liu, 1996. Winter upwelling off Luzon in the northeastern South China Sea. Journal of Geophysical Research, 101 (C7), 16435-16448.
Signorini, S. R., C.R. McClain, and Y. Dandonneau, 1999. Mixing and phytoplankton bloom in the wake of Marquesas Islands. Geophysical Research Letters 26 (20), 3121-3124.
Udarbe-Walker, M. J. B. and C.L.Villanoy, 2001. Structure of potential upwelling areas in the Philippines. Deep-Sea Research I 48,1499-1518.
Wang, D., Y. Lin, Y. Qi, and P. Shi, 2001. Seasonal variability of thermal fronts in the northern South China Sea from Satellite Data. Geophysical Research Letters, 28 (20), 3963-3966.
Wang, G., J.Su, and P.C. Chu, 2003. Mesoscale eddies in the South China Sea observed with altimeter data. Geophysical Research Letters, 30 (21), 2121. Wu, C.-R. , P.-T.Shaw, and S.-Y.Chao, 1998. Seasonal and Interannual Variations in the
Velocity Field of the South China Sea. Journal of Oceanography 54, 361-372. Xue, H., F. Chai, N. Pettigrew, and D. Xu, M. Shi, J. Xu, 2004. Kuroshio intrusion and the
circulation in the South China Sea. Journal of Geophysical Research, 109, C02017.