Clinical research
Prevention and epidemiologyUrban air pollution and emergency admissions for
cerebrovascular diseases in Taipei, Taiwan
Chang-Chuan Chan
1*, Kai-Jen Chuang
1, Lung-Chang Chien
1, Wen-Jone Chen
2, and Wei-Tien Chang
2 1Institute of Occupational Medicine and Industrial Hygiene, College of Public Health, National Taiwan University, Rm. 722, 7F, No. 17, Xu-Zhou Road, Taipei 100, Taiwan, R.O.C.; and2Department of Emergency Medicine, National Taiwan University Hospital, Taipei, Taiwan, R.O.C.Received 22 August 2005; revised 13 February 2006; accepted 23 February 2006; online publish-ahead-of-print 14 March 2006
Aims This study was designed to evaluate the association between urban air pollutants and emergency admissions for cerebrovascular diseases.
Methods and results Daily emergency admissions for cerebrovascular diseases (ICD-9-CM, 430–437) to the National Taiwan University Hospital were regressed against daily concentrations of carbon monoxide (CO), nitrogen dioxide (NO2), sulphur dioxide (SO2), ozone (O3), and particulate matters with
aero-dynamic diameter ,2.5 (PM2.5) and 10 mm (PM10) from 12 April 1997 to 31 December 2002 in Taipei
metro-politan areas by the Poisson regression models adjusting for meteorological conditions and temporal trends. Single-pollutant models showed O3lagged 0 day, CO lagged 2 days, and PM2.5and PM10lagged 3
days were significantly associated with increasing emergency admissions for cerebrovascular diseases and CO lagged 2 days was significantly associated with increasing emergency admissions for strokes (ICD-9-CM, 430–434). Such association remained significant for O3, CO, and cerebrovascular admissions
after adjusting for PM2.5and PM10 in two-pollutant models. The odds ratios were 1.021–1.022 per
31.3 ppb O3and 1.023–1.031 per 0.8 ppm CO, respectively. However, only CO was significantly associated
with emergency admissions for stroke in the three-pollutant models with CO, O3, and PM2.5or PM10.
Conclusion Emergency admissions for cerebrovascular diseases among adults were positively associated with increasing urban air pollution levels of O3lagged 0 day and CO lagged 2 days in Taipei.
KEYWORDS Cerebrovascular diseases; Stroke; Air pollution; Carbon monoxide; Particulate matters; Epidemiology
Introduction
Studies on associating air pollution with cerebrovascular mortality have been conducted in several countries. In a study in the Netherlands, short-term exposure to sulphur dioxide (SO2), carbon monoxide (CO), and ozone (O3) was found to be significantly associated with cerebrovascular mortality [International Classification of Disease, 9th revi-sion (ICD-9), 430–436].1 Two studies conducted in Seoul, Korea reported that acute effects of air pollutants including particulate matter with diameter ,10 mm (PM10), nitrogen dioxide (NO2), SO2, CO, and O3were all significantly associ-ated with haemorrhagic and ischaemic deaths (431 and 434 by ICD-9 and 161 and 163 by ICD-10)2 and stroke mortality (160–169 by ICD-10).3 One study in Shanghai, China showed that PM10 and NO2 were significantly associated with acute stroke mortality (ICD-9, 430–438).4 However, one study in Hong Kong found no association between air pollution and cerebrovascular mortality (ICD-9, 430–438).5
In addition to the mortality studies on the association between air pollution and cerebrovascular diseases, several recent studies were also performed to associate
hospital admissions for cerebrovascular diseases with urban air pollution in USA, European, and Asian countries. One study conducted in nine US cities showed that acute exposure to PM10, CO, NO2, and SO2was significantly associ-ated with hospital admission for ischaemic stroke [Inter-national Classification of Disease, 9th revision-Clinical Modification (ICD-9-CM, 434)].6 Three studies in Europe showed that cerebrovascular admissions [ICD-9, 430–438; ICD-9, 430–436; and 160-169 by the International Classification of Diseases, 10th revision (ICD-10)] were significantly associated with short-term effects of NO27,8 and PM10.9 One study in Asia reported significant associ-ations between acute exposure to PM10, NO2, SO2, CO, and O3 and both primary intracerebral haemorrhage (ICD-9, 431–432) and ischaemic stroke (ICD-9, 433–435) admis-sions.10 However, some other studies failed to identify significant associations between air pollution and cerebro-vascular admissions (ICD-9, 430–438).11,12
Apparently, the association between air pollution and mortality and hospital admissions for cerebrovascular dis-eases and strokes remained inconclusive because there were no consistent findings on their associations in previous studies. To shed light on this unanswered question, we con-ducted this study to investigate whether air pollution was associated with hospital admissions for cerebrovascular
&The European Society of Cardiology 2006. All rights reserved. For Permissions, please e-mail: journals.permissions@oxfordjournals.org *Corresponding author. Tel/fax: þ886 2 2322 2362.
E-mail address: ccchan@ntu.edu.tw
European Heart Journal (2006) 27, 1238–1244 doi:10.1093/eurheartj/ehi835
diseases (ICD-9-CM, 430–437) in general and strokes (ICD-9-CM, 430–434) in particular among adults aged above 50 over the 6-year period from 1997 to 2002 in Taipei, Taiwan.
Methods
Emergency admissions for cerebrovascular diseases Our emergency admission data were collected from the National Taiwan University Hospital (NTUH), which is a major medical centre with 2000 beds in Taipei metropolitan areas and serves as a major emergency care centre for all residents in the areas. The population in Taipei metropolitan area, which is situated in northern Taiwan and covers an area of about 1050 km2, was approximately
5.91–6.10 millions from 1997 to 2002.13Our outcome variables in
this study include admissions for cerebrovascular diseases (ICD-9-CM, 430–437), strokes (ICD-9-CM, 430–434), haemorrhagic stroke (ICD-9-CM, 430–432), and ischaemic stroke (ICD-9-CM, 433–434). We obtained all electronic medical records of daily emer-gency admissions for cerebrovascular diseases from 12 April 1997 to 31 December 2002 to match with the available air pollution data in the same period for further analysis. Each medical record included a patient’s admission date, age, sex, and address in addition to dis-charge diagnoses and diagnostic code of cerebrovascular admissions from ICD-9. Our study population was limited to adults aged above 50 during their admissions because they have been reported to have higher incidence of cerebrovascular diseases than younger population aged below 50 in Taiwan.14All haemorrhagic and
ischae-mic stroke cases admitted to the NTUH were evaluated by the stan-dardized diagnostic criteria, i.e. the National Institute of Health Stroke Scale (NIHSS) score,15 computed tomography, and/or
mag-netic resonance tomography, before they were given ICD-9 codes. Such a procedure improved the accuracy of coding different types of stroke by the ICD-9 system in the NTUH.
Environmental data
Sixteen monitoring stations operated by the Taiwan Environmental Protection Agency spread around the Taipei Metropolitan area and measure hourly data of air pollution and temperature. Five air pol-lutants, including NO2, SO2, O3, CO, and PM10, are measured to track
trend of air quality in Taipei in all 16 monitoring stations. Two of these 16 stations measure particulate matter with aerodynamic diameter ,2.5 mm (PM2.5) since 12 April 1997. Accordingly, our
study period was limited to 2090 days from 12 April 1997 to 31 December 2002 when the air pollution data of all six pollutants were available. The measured environmental data were used to rep-resent average ambient concentrations in the region using the fol-lowing procedures. Daily environmental data were summarized by 24 h arithmetic averages (noon-to-noon) of temperature, tempera-ture range, dew point temperatempera-ture, PM2.5, PM10, NO2, and SO2
con-centrations, and maximum values of 8 h CO concentrations and 1 h O3concentrations for each monitoring station. These environmental
data in each monitoring station were then averaged across all 16 monitoring stations to represent daily air pollution situations in the entire Taipei metropolitan areas.
Modelling approach
Because emergency admissions to hospital for any diseases were naturally rare events, we chose the Poisson models as an appropri-ate approach to perform data analysis in our study. We first con-structed a base model with potential confounders,16 including
three time-trend variables, which were year, month, and day-of-week, and three temperature variables, which were daily temperature, daily temperature difference between minimum and maximum temperatures, and dew point temperature, to predict daily emergency admissions for cerebrovascular diseases. Generalized additive models (GAMs) were used to adjust for
non-linear relation between confounders and emergency admis-sions.17Smooth function in GAM was used to control temperature
effects and time-trend variables in our models. The general form of our base model is log(E(Yt)) ¼aItþbXt. Yt, which obeys Poisson
distribution with parameter m¼ E(Yt), represents hospital
emer-gency admissions on day t in the equation. Itis a matrix containing
the time function of year, month, and day-of-week. Xtis the
temp-erature covariate matrix containing three temptemp-erature variables. The matrices ofaandbare coefficients for covariate matrices It
and Xt, respectively. We then built single-pollutant models by
adding to the base model, one by one, data regarding air pollution levels for each of six air pollutants lagged 0 to 3 days. As previous study indicated that the increased mortality or hospital admissions were associated with high air pollution levels on the same day or the previous 2 days,18we used the cumulative lag up to 3 days in
our models. The assumption of the linearity between the log of emergency admissions and air pollution was graphically analysed by using the locally weighted running-line smoother (loess) for smoothing function.19The air pollutants, whose odds ratios (ORs)
and 95% confidence intervals (CIs) for interquartile range (IQR) change in pollution levels less than a significance level of 0.05 in the single-pollutant models, were considered for further analyses in our multi-pollutant models. When there were several significant ORs at different day lags for one specific air pollutant, we used only the one with the maximum OR and combined the air pollutants with the same or shorter time lags together in our multi-pollutant models. A significance level of 0.05 with two-sided distribution was used to determine statistical significance in our models. Finally, we examined residuals plots to check the residuals’ autore-gressive effects and determine whether autoreautore-gressive terms should be added to remove serial correlations between the repeated daily measures in all single-pollutant and multi-pollutant Poisson models. The selection criterion of goodness-of-fit was assessed using Akaike’s information criterion.20
Results
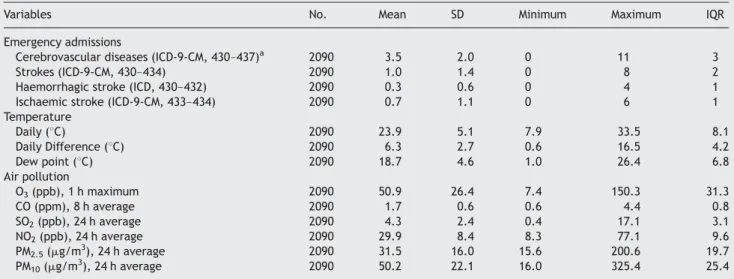
There were 8582 cerebrovascular admissions in NTUH between 12 April 1997 and 31 December 2002. Among them, there were 7341 cerebrovascular patients aged above 50 (mean age 69.7, standard deviation 9.9, and range 50–100 years), which accounted for 85% of total cer-ebrovascular admissions. Among the 7341 adult cerebrovas-cular patients, there were 690 cases of haemorrhagic stroke and 1494 cases of ischaemic stroke. The gender ratio of cerebrovascular patients between male and female was 3/2. As shown in Table 1, daily emergency admissions in NTUH averaged at 3.5 cerebrovascular admissions, 1.0 stroke admission, 0.3 haemorrhagic stroke admission, and 0.7 ischaemic stroke admission for adults aged above 50 during the study period. Daily ambient temperatures and air pollution levels also varied significantly during this period in Taipei. During the 2090 days of our study period, daily temperatures fluctuated between 7.9 and 33.58C, and ambient air pollution levels differed by nine times for CO, 20 times for O3, 15 times for PM2.5, 10 times for PM10, and 40 times for SO2. The IQRs of these environmental data, which were used for calculating ORs in the Poisson regression models, were 8.18C for daily temperature, 4.28C for daily difference in temperature, 6.88C for dew point, 0.8 ppm for CO, 31.3 ppb for O3, 19.7 mg/m3 for PM2.5, 25.4 mg/m3 for PM10, 9.6 ppb for NO2, and 3.1 ppb for SO2, respectively. Pearson correlation between CO, O3, PM2.5, and PM10 showed no significant correlation between these four air pollutants except PM10 and PM2.5 (r ¼ 0.61) (Table 2).
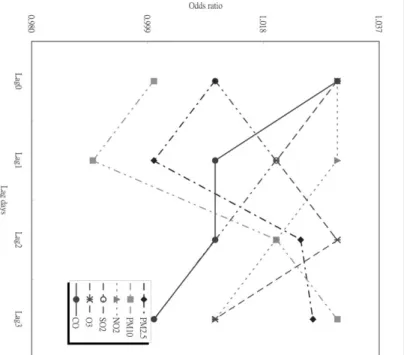
Our base model without air pollutants contained only four key factors, including long-term trend of year and month, short-term temporal variation of day-of-week, and 1-day lagged daily averaging temperatures. By adding individual air pollutants at 0-day to 3-day lags to our single-pollutant models, we found only O3, CO, PM2.5, and PM10 at certain day lags were associated with emergency admissions for cerebrovascular diseases among 72 single-pollutant models. There were positive trends in the emergency admis-sions for cerebrovascular diseases and NO2and SO2 concen-trations, although their associations were not statistically significant. As shown in Table 3, O3 lagged 0 day, CO lagged 2 days, PM2.5lagged 3 days, and PM10lagged 3 days were significantly associated with cerebrovascular admis-sions, whereas CO lagged 2 days was significantly associated with admissions for strokes. None of the air pollutants was associated with emergency admissions for either ischaemic stroke or haemorrhagic stroke in single-pollutant models. Although the ORs for ischaemic and haemorrhagic strokes were not significant, it is apparent that all ORs for ischaemic stroke were greater than 1, with relatively few ORs for haemorrhagic stroke being greater than 1.
As shown in Figure 1, the highest ORs for each IQR increase in these four air pollutants were O3lagged 0 day (OR ¼ 1.031; 95% CI ¼ 1.008–1.054), CO lagged 2 days (OR ¼ 1.033; 95% CI ¼ 1.010–1.056), PM2.5 lagged 3 days (OR ¼ 1.021; 95% CI ¼ 1.005–1.037), and PM10 lagged 3 days (OR ¼ 1.030; 95% CI ¼ 1.011–1.049). These four air pol-lutants at specific day lags were then combined together to construct to our multi-pollutant models. Neither NO2 nor SO2 was considered in our multi-pollutant models because none of them was significantly associated with emergency admissions for cerebrovascular diseases.
To avoid collinearity due to high correlation, PM10 and PM2.5were fitted separately to our multi-pollutant models. The ORs of emergency admissions for cerebrovascular dis-eases per IQR change in CO, O3, PM2.5, and PM10 by two-pollutant and three-two-pollutant models were summarized in Table 4. CO lagged 2 days remained the strongest association with emergency admissions for cerebrovascular diseases among the four air pollutants after controlling other pollu-tants in multi-pollutant models. The OR was about 1.031 per IQR change in CO concentrations in both two-pollutant and three-pollutant models. The association between O3 lagged 0 day and emergency admissions for cerebrovascular diseases was significant in two-pollutant models, but mar-ginally significant in three-pollutant models. Both PM2.5 lagged 3 days and PM10 lagged 3 days became marginally associated with emergency admissions for cerebrovascular diseases in two-pollutant model, but not in three-pollutant model. As expected, low temperature was significantly associated with increase in emergency admissions for cerebrovascular diseases. The ORs per IQR change in temp-erature were approximately 0.927 in both two-pollutant and three-pollutant models. We did not apply two-pollutant or three-pollutant models to analyse emergency admissions for haemorrhagic or ischaemic stroke in this study, because no air pollutant was significantly associated with outcomes in single-pollutant models.
Table 1 Summary of daily emergency admissions for cerebrovascular diseases and stroke in the NTUH and environmental conditions in Taipei between 12 April 1997 and 31 December 2002
Variables No. Mean SD Minimum Maximum IQR
Emergency admissions
Cerebrovascular diseases (ICD-9-CM, 430–437)a 2090 3.5 2.0 0 11 3
Strokes (ICD-9-CM, 430–434) 2090 1.0 1.4 0 8 2
Haemorrhagic stroke (ICD, 430–432) 2090 0.3 0.6 0 4 1
Ischaemic stroke (ICD-9-CM, 433–434) 2090 0.7 1.1 0 6 1
Temperature Daily (8C) 2090 23.9 5.1 7.9 33.5 8.1 Daily Difference (8C) 2090 6.3 2.7 0.6 16.5 4.2 Dew point (8C) 2090 18.7 4.6 1.0 26.4 6.8 Air pollution O3(ppb), 1 h maximum 2090 50.9 26.4 7.4 150.3 31.3 CO (ppm), 8 h average 2090 1.7 0.6 0.6 4.4 0.8 SO2(ppb), 24 h average 2090 4.3 2.4 0.4 17.1 3.1 NO2(ppb), 24 h average 2090 29.9 8.4 8.3 77.1 9.6 PM2.5(mg/m3), 24 h average 2090 31.5 16.0 15.6 200.6 19.7 PM10(mg/m3), 24 h average 2090 50.2 22.1 16.0 325.4 25.4 SD, standard deviation.
aSubarachnoid haemorrhage [International Classification of Disease, 9th revision-Clinical Modification (ICD-9-CM) 430]; other intracerebral haemorrhage
(ICD-9-CM, 431); other and unspecified intracranial haemorrhage (ICD-9-CM, 432); occlusion and stenosis of pre-cerebral arteries (ICD-9-CM, 433); occlusion of cerebral arteries (ICD-9-CM, 434); transient cerebral ischaemia (ICD-9-CM, 435); acute, but ill-defined cerebrovascular disease (ICD-9-CM, 436); and other and ill-defined cerebrovascular disease (ICD-9-CM, 437).
Table 2 Pearson correlation coefficients for air pollutants in Taipei during 1997–2002 Pearson correlation coefficients O3 CO SO2 NO2 PM2.5 PM10 O3 1.00 CO 0.30 1.00 SO2 0.51 0.63 1.00 NO2 0.43 0.77 0.64 1.00 PM2.5 0.33 0.44 0.51 0.50 1.00 PM10 0.43 0.47 0.59 0.64 0.61 1.00 1240 C.-C. Chan et al.
Discussion
In general, our results suggested that urban air pollution with mixtures of both gaseous and particulate air pollutants was associated with emergency admissions for cerebro-vascular diseases. The three air pollutants responsible for cerebrovascular admissions in our single-pollutant models, i.e. PM 10 ,O 3, and CO, were generally consistent with the air pollutants reported in previous studies on cerebrovascu-lar morbidity (T able 5 ). For example, hospital admissions for cerebrovascular diseases were reported to be associated with PM 10 in Birmingham of UK and Kaohsiung of Taiwan, 9,10 with CO in V alencia of Spain and Kaohsiung of Taiwan, 7,10 and with O 3 in Kaohsiung of Taiwan. 10 PM 2.5 , which has not yet been reported in previous studies, was found to be associated with cerebrovascular admissions in our study . In contrast, NO 2, which was associated with cere-brovascular admissions in several previous studies, 7,8,10 was not significantly associated with the cerebrovascular admis-sions in our study . The reason for the absence of an associ-ation with NO 2 with cerebrovascular diseases in this study is probably that NO 2 is highly correlated with PM 10 (r ¼ 0.64) and CO (r ¼ 0.77) in Taipei during the study period. In particular , our two-pollutant models showed that two gaseous air pollutants, i.e. O 3 and CO, were more signifi-cantly associated with cerebrovascular admissions than two particulate pollutants, PM 10 and PM 2.5 . In our study , three-pollutant models indicated that cerebrovascular admissions were more consistently associated with CO. Our models also suggested a clear time course of pollution ef fects on cerebrovascular admissions by dif ferent air pollu-tants. There were 0-day lag for O 3, 2-day lag for CO, and 3-day lag for particulate matters. Our results indicatedTable 3 ORs of emergency admissions for cerebrovascular diseases, strokes, ischaemic stroke, and haemorrhagic stroke by IQR changes of air pollution levels at the same day, 1-day lag, 2-day
lag, and 3-day lag
O3 CO SO2 NO2 PM2.5 PM10
Cerebrovascular diseases Lag 0 1.031 (1.008, 1.054) 1.029 (0.995, 1.063) 1.008 (0.969, 1.047) 1.032 (0.991, 1.074) 1.006 (0.993, 1.019) 1.001 (0.969, 1.033)
Lag 1 1.012 (0.969, 1.056) 1.024 (0.994, 1.054) 1.023 (0.994, 1.052) 1.027 (0.997, 1.057) 1.002 (0.990, 1.014) 0.999 (0.978, 1.020) Lag 2 1.009 (0.967, 1.054) 1.033 (1.010, 1.056) 1.014 (0.971, 1.058) 1.018 (0.998, 1.038) 1.015 (0.978, 1.052) 1.023 (0.989, 1.057) Lag 3 1.000 (0.992, 1.008) 1.007 (0.967, 1.047) 1.001 (0.981, 1.021) 1.006 (0.972, 1.040) 1.021 (1.005, 1.037) 1.030 (1.011, 1.049) Stroke Lag 0 1.021 (0.992, 1.050) 1.022 (0.993, 1.051) 0.991 (0.916, 1.066) 0.994 (0.914, 1.074) 0.931 (0.831, 1.031) 0.969 (0.897, 1.041) Lag 1 0.984 (0.934, 1.033) 1.024 (0.994, 1.054) 1.014 (0.971, 1.058) 1.013 (0.971, 1.056) 0.936 (0.845, 1.027) 0.992 (0.918, 1.066) Lag 2 0.973 (0.913, 1.033) 1.032 (1.009, 1.055) 0.982 (0.942, 1.022) 1.014 (0.975, 1.053) 0.931 (0.820, 1.042) 1.004 (0.993, 1.015) Lag 3 0.989 (0.929, 1.049) 1.006 (0.964, 1.051) 0.969 (0.929, 1.010) 1.011 (0.966, 1.056) 0.991 (0.969, 1.013) 1.009 (0.988, 1.030)
Ischaemic stroke Lag 0 1.046 (0.981, 1.111) 1.055 (0.985, 1.126) 1.044 (0.966, 1.125) 1.025 (0.956, 1.094) 0.981 (0.907, 1.055) 0.984 (0.932, 1.036)
Lag 1 1.043 (0.961, 1.125) 1.071 (0.994, 1.148) 1.051 (0.969, 1.133) 1.029 (0.955, 1.103) 0.994 (0.920, 1.078) 0.993 (0.939, 1.047)
Lag 2 1.019 (0.990, 1.048) 1.051 (0.978, 1.124) 1.000 (0.922, 1.078) 1.035 (0.993, 1.078) 0.960 (0.885, 1.035) 0.989 (0.927, 1.041)
Lag 3 1.087 (0.993, 1.181) 1.064 (0.993, 1.135) 1.039 (0.961, 1.117) 1.051 (0.972, 1.130) 1.059 (0.984, 1.134) 1.042 (0.981, 1.103)
Haemorrhagic stroke Lag 0 0.989 (0.877, 1.101) 0.982 (0.883, 1.081) 0.918 (0.815, 1.021) 0.963 (0.884, 1.042) 0.870 (0.740, 1.010) 0.966 (0.884, 1.048)
Lag 1 0.921 (0.799, 1.043) 1.000 (0.895, 1.105) 0.981 (0.876, 1.086) 0.994 (0.907, 1.081) 0.882 (0.761, 1.003) 0.990 (0.908, 1.072) Lag 2 0.950 (0.826, 1.074) 0.973 (0.862, 1.084) 0.974 (0.867, 1.081) 1.011 (0.921, 1.101) 0.909 (0.810, 1.008) 1.002 (0.920, 1.084) Lag 3 0.882 (0.763, 1.001) 0.992 (0.881, 1.103) 0.910 (0.803, 1.017) 0.980 (0.901, 1.060) 0.921 (0.830, 1.012) 0.974 (0.902, 1.046) Figu re 1 ORs of hospit al emer gency a dmissions for cerebrova scular d iseases attr ibutable to IQR cha n ges in air pollutant levels for d if ferent lag m odels w ith a m aximum lag of 3 d a ys. air pollution and cerebrovasc ular admissions 1241
that gaseous air pollutants related to vehicle emissions and photochemical formation were more significantly associated with cerebrovascular admissions than other particulate air pollutants in the urban environments of Taipei.
It has been proposed that air pollution can induce alveolar inflammation, leading to exacerbation of pre-existing lung disease, increased blood coagulability, and an associated increased risk of cardiovascular events.21 Such biological plausibility may also be applied to the association between air pollution and cerebrovascular diseases. Studies have shown that exposures to concentrated ambient PM and O3 would produce an inflammatory response in humans,22,23 animal models,24,25and in vitro cellular models.26,27It has been reported that high concentrations of CO, as carboxy-haemoglobin (COHb) in blood, could produce signs and symptoms of headache, dilation of the cutaneous blood vessels, and dyspnoea in exposed subjects when their COHb concentrations were over 10%.28 An in vivo study also showed that high concentrations of CO could also impair pigeons’ cardiovascular system by damaging their arterial walls.29 However, no current study is available to explain whether such a physiological response to high CO concentrations can also occur at comparatively low ambient concentrations. There are other important effects such as systemic oxidant stress and inflammation that are
likely to contribute to altered endothelial function and atherosclerotic plaque instability.21These effects are quite possibly present in the cerebrovascular system, although at this time there is no proof.
It should be noted that emergency admissions for haemor-rhagic and ischaemic strokes were not associated with any air pollutants in single-pollutant models in this study. Given that there are only 690 and 1494 cases from haemor-rhagic and ischaemic stroke admissions, respectively, over the 2090 study days, we believe that insufficient sample size is possibly the reason why no air pollutants were signifi-cantly associated emergency admissions for either haemor-rhagic or ischaemic stroke in our study. Apparently, no differences in pollution effects on ischaemic vs. haemorrha-gic stroke were found in single-pollutant models because the CIs for many of these estimates included 1. However, 100% of the ORs for gaseous pollutants were 1 or above for ischae-mic stroke, whereas only 31% (5/16) of the ORs were above 1 for haemorrhagic stroke in Table 3, which indicated air pol-lution could have more marked effects on ischaemic stroke than on haemorrhagic stroke. These findings partially provide additional support to the study showing that elevation in PM10, CO, NO2 and SO2 may increase the risk of ischaemic stroke, but not haemorrhagic stroke.6
Previous studies on cerebrovascular mortality and morbid-ity have reported seasonal and temperature effects on cer-ebrovascular mortality and morbidity.30–33We believe that the association between urban air pollution and cerebrovas-cular admissions in this study was not confounded by either seasonal or temperature effects because we have adjusted long-term trend in years and months and short-term tem-poral variation in day-of-week, as well as daily averaging temperatures in our models. Our results also confirmed that low ambient temperature was associated with the increase in cerebrovascular morbidity reported in one pre-vious study,33because ambient temperature was negatively associated with emergency admissions for cerebrovascular diseases in this study. Although a U-shaped relation between temperature and cerebrovascular mortality was reported in a previous study,34 we have not observed such kind of relation between temperature and cerebrovascular admissions in our data.
Because we used the number of cases rather than rates of occurrence of cerebrovascular diseases to estimate the association between air pollution and cerebrovascular admissions, the model-determined association could poss-ibly be confounded by an ageing population or by population change over the 6-year period from 1997 to 2002. However, such a confounding effect was likely to be limited because we found no significant changes in population rates (18.2–17.5%) for residents aged above 50 in Taipei over the study period.
We used air pollution levels from air monitoring stations to represent individuals’ exposures. Therefore, we could not avoid the measurement error of misclassifying our subjects’ exposures to air pollutants, especially PM2.5measured only by two air monitoring stations in Taipei. Such exposure mis-classification can bias our outcomes towards either null or positive results, as reported in previous studies.35,36 It is likely that NO2 and PM10 measured at the air monitoring station may not properly represent our subjects’ actual air pollution exposures. Furthermore, it is the older people who get most of the cerebrovascular diseases, and many of
Table 4 ORs of cerebrovascular emergency admissions for IQR changes of air pollution levels by two-pollutant and three-pollutant models
Lag ORs CIs
Two-pollutant model O3þCO O3 Lag 0 1.022 1.001, 1.043 CO Lag 2 1.033 1.011, 1.056 Temperature Lag 1 0.921 0.882, 0.960 O3þPM2.5 O3 Lag 0 1.021 1.002, 1.040 PM2.5 Lag 3 1.009 0.987, 1.031 Temperature Lag 1 0.923 0.884, 0.962 O3þPM10 O3 Lag 0 1.022 1.001, 1.043 PM10 Lag 3 1.018 0.987, 1.049 Temperature Lag 1 0.931 0.890, 0.972 CO þ PM2.5 CO Lag 2 1.023 1.002, 1.044 PM2.5 Lag 3 1.014 0.993, 1.035 Temperature Lag 1 0.929 0.888, 0.970 CO þ PM10 CO Lag 2 1.031 1.009, 1.053 PM10 Lag 3 1.019 0.988, 1.050 Temperature Lag 1 0.931 0.888, 0.974 Three-pollutant model O3þCO þ PM2.5 O3 Lag 0 1.021 0.989, 1.053 CO Lag 2 1.034 1.001, 1.067 PM2.5 Lag 3 1.009 0.987, 1.031 Temperature Lag 1 0.922 0.883, 0.961 O3þCO þ PM10 O3 Lag 0 1.030 0.988, 1.072 CO Lag 2 1.032 1.013, 1.052 PM10 Lag 3 1.015 0.985, 1.045 Temperature Lag 1 0.933 0.890, 0.976 1242 C.-C. Chan et al.
Table 5 Epidemiological studies on air pollution and cerebrovascular diseases and stroke worldwide
Reference Diseases definitiona Outcome City Time period Pollutants examined Main findings
Ponka et al.8 Cerebrovascular diseases:
ICD-9 codes 430–438
Emergency room admissions
Helsinki 1987–89 SO2, NO2, NO, O3, TSP Cerebrovascular admissions
were associated with NO2
Poloniecki et al.11 Cerebrovascular diseases:
ICD-9 codes 430–438
Hospital admissions London 1987–94 SO2, NO2, CO, O3,
black smoke
No association was observed
Wordley et al.9 Cerebrovascular diseases:
ICD-9 codes 430–436
Hospital admissions Birmingham 1992–94 SO2, NO2, nitrogen
oxides, CO, O3, PM10
Cerebrovascular admissions
were associated with PM10
Ballester et al.7 Cerebrovascular diseases:
ICD-9 codes 430–438
Hospital admissions Valencia 1994–96 SO2, NO2, CO, O3,
black smoke
Cerebrovascular admissions
were associated with NO2
Hoek et al.1 Cerebrovascular diseases:
ICD-9 codes 430–436
Mortality The Netherlands 1986–94 SO2, NO2, CO, O3, PM10,
black smoke
Cerebrovascular deaths were
associated with SO2, O3, CO,
and black smoke
Hong et al.2 Stroke: ICD-10 codes 160–169 Mortality Seoul 1995–98 SO2, NO2, CO, O3, PM10 Cerebrovascular deaths were
associated with all pollutants
Le Tertre et al.12 Stroke: ICD-9 codes 430–438 Hospital admissions Barcelona, Birmingham,
London, Milan, The Netherlands, Paris, Rome, Stockholm
1992–94 SO2, NO2, CO, O3, PM10,
black smoke
No association was observed
Wong et al.5 Cerebrovascular diseases:
ICD-9 codes 430–438
Mortality Hong Kong 1995–98 SO2, NO2, O3, PM10 No association was observed
Kan et al.4 Stroke: ICD-9 codes 430–438 Mortality Shanghai 2001–02 SO
2, NO2, PM10 Cerebrovascular deaths were
associated with PM10and NO2
Tsai et al.10 PIH: ICD-9 codes 431–432
IS: ICD-9 codes 433–435
Hospital admissions Kaohsiung 1997–2000 SO2, NO2, CO, O3, PM10 IS admissions were associated
with all pollutants. PIH admissions were associated
with NO2, CO, O3, and PM10
Wellenius et al.6 HS: ICD-9-CM code 431
IS: ICD-9-CM code 434
Hospital admissions Birmingham, Chicago,
Cleveland, Detroit, Minneapolis, New Haven, Pittsburgh, Salt Lake City, Seattle
1986–99 SO2, NO2, CO, PM10 IS admissions were associated
with all pollutants
IS, ischaemic stroke; HS, haemorrhagic stroke; PIH, primary intracerebral haemorrhage; TSP, total suspended particulates.
aDiseases defined by original authors in their studies.
air pollution and cerebrovasc ular admissions 1243
them are disabled and may stay most of their time indoors. Therefore, we still cannot entirely rule out the effects of other air pollutants, such as PM10 and PM2.5, on increasing emergency admissions for cerebrovascular diseases in this study. It should also be noted that Taipei is a subtropical city; therefore, our findings may not be readily extrapolated to other locations with different population characteristics, environmental, and meteorological conditions.
Regardless the limitation, we conclude that urban air pol-lution can increase emergency admissions for cerebrovascu-lar diseases among adults aged above 50 in Taipei. Among the measured air pollutants in Taipei, we conclude that CO and O3are stronger predictors of cerebrovascular admissions than other pollutants. However, epidemiological studies and more direct measure of vehicular traffic, such as black carbon or particle number, are still needed to confirm the contribution of different components in urban air pollution to increase emergency admissions for cerebrovascular dis-eases in Taipei. Further toxicological studies are also recommended to elucidate the biological mechanisms and pathogenetic processes in the cerebrovascular system induced by urban air pollution.
Acknowledgement
We thank the Taiwan Environmental Protection Agency for support-ing this study with grants (EPA-93-FA11-03-A232).
Conflict of interest: none declared.
References
1. Hoek G, Brunekreef B, Fischer P, van Wijnen J. The association between air pollution and heart failure, arrhythmia, embolism, thrombosis, and other cardiovascular causes of death in a time series study. Epidemiology 2001;12:355–357.
2. Hong YC, Lee JT, Kim H, Kwon HJ. Air pollution: a new risk factor in ischemic stroke mortality. Stroke 2002;33:2165–2169.
3. Hong YC, Lee JT, Kim H, Ha EH, Schwartz J, Christiani DC. Effects of air pollutants on acute stroke mortality. Environ Health Perspect 2002; 110:187–191.
4. Kan H, Jia J, Chen B. Acute stroke mortality and air pollution: new evidence from Shanghai, China. J Occup Health 2003;45:321–323. 5. Wong TW, Tam WS, Yu TS, Wong AH. Associations between daily
mortal-ities from respiratory and cardiovascular diseases and air pollution in Hong Kong, China. Occup Environ Med 2002;59:30–35.
6. Wellenius GA, Schwartz J, Mittleman MA. Air pollution and hospital admissions for ischemic and hemorrhagic stroke among medicare beneficiaries. Stroke 2005;36:2549–2553.
7. Ballester F, Tenias JM, Perez-Hoyos S. Air pollution and emergency hospi-tal admissions for cardiovascular diseases in Valencia, Spain. J Epidemiol Community Health 2001;55:57–65.
8. Ponka A, Virtanen M. Low-level air pollution and hospital admissions for cardiac and cerebrovascular diseases in Helsinki. Am J Public Health 1996;86:1273–1280.
9. Wordley J, Walters S, Ayres JG. Short term variations in hospital admis-sions and mortality and particulate air pollution. Occup Environ Med 1997;54:108–116.
10. Tsai SS, Goggins WB, Chiu HF, Yang CY. Evidence for an association between air pollution and daily stroke admissions in Kaohsiung, Taiwan. Stroke 2003;34:2612–2616.
11. Poloniecki JD, Atkinson RW, de Leon AP, Anderson HR. Daily time series for cardiovascular hospital admissions and previous day’s air pollution in London, UK. Occup Environ Med 1997;54:535–540.
12. Le Tertre A, Medina S, Samoli E, Forsberg B, Michelozzi P, Boumghar A, Vonk JM, Bellini A, Atkinson R, Ayres JG, Sunyer J, Schwartz J, Katsouyanni K. Short-term effects of particulate air pollution on cardio-vascular diseases in eight European cities. J Epidemiol Community Health 2002;56:773–779.
13. Department of Statistics, Ministry of the Interior of the Republic of China. Monthly bulletin of interior statistics, Taiwan and Fuchien area, Republic of China eng. Taipei, Taiwan, ROC, 2005.
14. Hu HH, Sheng WY, Chu FL, Lan CF, Chiang BN. Incidence of stroke in Taiwan. Stroke 1992;23:1237–1241.
15. National Institute of Neurological Disorders and Stroke Ad Hoc Committee: Classification of cerebrovascular diseases III. Stroke 1990;21:637–676. 16. Schwartz J, Spix C, Touloumi G, Bacharova L, Barumamdzadeh T,
le Tertre A, Piekarksi T, Ponce de Leon A, Ponka A, Rossi G, Saez M, Schouten JP. Methodological issues in studies of air pollution and daily counts of deaths or hospital admissions. J Epidemiol Community Health 1996;50(Suppl. 1):S3–S11.
17. Hastie T, Tibshirani R. Generalized Additive Models. London: Chapman and Hall; 1990.
18. Katsouyanni K, Touloumi G, Spix C, Schwartz J, Balducci F, Medina S, Rossi G, Wojtyniak B, Sunyer J, Bacharova L, Schouten JP, Ponka A, Anderson HR. Short-term effects of ambient sulphur dioxide and particulate matter on mortality in 12 European cities: results from time series data from the APHEA project. Air Pollution and Health: a European Approach. BMJ 1997;314:1658–1663.
19. Cleveland WS, Devlin SJ. Robust locally-weighted regression and smooth-ing scatterplots. J Am Stat Assoc 1988;74:829–836.
20. Akaike H. Statistical predictor identification. Ann Inst Stat Math 1970;22:203–217.
21. Brook RD, Franklin B, Cascio W, Hong Y, Howard G, Lipsett M, Luepker R, Mittleman M, Samet J, Smith SC Jr, Tager I; Expert Panel on Population and Prevention Science of the American Heart Association. Air pollution and cardiovascular disease: a statement for healthcare professionals from the Expert Panel on Population and Prevention Science of the American Heart Association. Circulation 2004;109:2655–2671. 22. Ghio AJ, Kim C, Devlin RB. Concentrated ambient air particles induce
mild pulmonary inflammation in healthy human volunteers. Am J Respir Crit Care Med 2000;162:981–988.
23. Aris RM, Christian D, Hearne PQ, Kerr K, Finkbeiner WE, Balmes JR. Ozone-induced airway inflammation in human subjects as determined by airway lavage and biopsy. Am Rev Respir Dis 1993;148:1363–1372. 24. Lei YC, Chan CC, Wang PY, Lee CT, Cheng TJ. Effects of Asian dust event
particles on inflammation markers in peripheral blood and bronchoalveo-lar lavage in pulmonary hypertensive rats. Environ Res 2004;95:71–76. 25. Li XY, Gilmour PS, Donaldson K, MacNee W. Free radical activity and
pro-inflammatory effects of particulate air pollution (PM10) in vivo and
in vitro. Thorax 1996;51:1216–1222.
26. Kennedy T, Ghio AJ, Reed W, Samet J, Zagorski J, Quay J, Carter J, Dailey L, Hoidal JR, Devlin RB. Copper-dependent inflammation and nuclear factor-kappaB activation by particulate air pollution. Am J Respir Cell Mol Biol 1998;19:366–378.
27. Cheng TJ, Kao HP, Chan CC, Chang WP. Effects of ozone on DNA single-strand breaks and 8-oxoguanine formation in A549 cells. Environ Res 2003;93:279–284.
28. Gossel TA, Brickler JD. Principles of Clinical Toxicology. New York, NY: Raven Press; 1994.
29. Turner DM, Lee PN, Roe FJ, Gough KJ. Atherogenesis in the White Carneau pigeon. Further studies of the role of carbon monoxide and dietary cholesterol. Atherosclerosis 1979;34:407–417.
30. Oberg AL, Ferguson JA, McIntyre LM, Horner RD. Incidence of stroke and season of the year: evidence of an association. Am J Epidemiol 2000;152:558–564.
31. Collins TC, Petersen NJ, Menke TJ, Souchek J, Foster W, Ashton CM. Short-term, intermediate-term, and long-term mortality in patients hospitalized for stroke. J Clin Epidemiol 2003;56:81–87.
32. Wang Y, Levi CR, Attia JR, D’Este CA, Spratt N, Fisher J. Seasonal vari-ation in stroke in the Hunter region, Australia: a 5-year hospital-based study, 1995–2000. Stroke 2003;34:1144–1150.
33. Rothwell PM, Wroe SJ, Slattery J, Warlow CP. Is stroke incidence related to season or temperature? Lancet 1996;347:934–936.
34. Pan WH, Li LA, Tsai MJ. Temperature extremes and mortality from coronary heart disease and cerebral infarction in elderly Chinese. Lancet 1995;345:353–355.
35. Zeger SL, Thomas D, Dominici F, Samet JM, Schwartz J, Dockery D, Cohen A. Exposure measurement error in time-series studies of air pollution: concepts and consequences. Environ Health Perspect 2000; 108:419–426.
36. Zeka A, Schwartz J. Estimating the independent effects of multiple pollutants in the presence of measurement error: an application of a measurement-error-resistant technique. Environ Health Perspect 2004;112:1686–1690.