Simultaneous Determination of Podophyllotoxin, Quercetin
and Kaempferol in Podophyllin by Liquid Chromatography
Tandem Mass Spectrometry
MEI-CHIH LIN1,2, JER-HUEI LIN2,SHU-KONG CHEN2, YU-WEN CHENG1* AND HUEI-WEN CHENG1* 1. College of Pharmacy, Taipei Medical University, Taipei, Taiwan (R.O.C.)
2. Bureau of Food and Drug Analysis, Department of Health, Executive Yuan, Taipei, Taiwan (R.O.C.)
(Received: March 26, 2008; Accepted: September 5, 2008)
ABSTRACT
A quantitative high performance liquid chromatography-tandem mass spectrometry (LC/MS/MS) was developed to analyze the constituents of podophyllin. Chromatographic separation was performed on a Cosmosil 5C18-MS (25 cm × 4.6 mm I.D., 5 µm) reverse phase column using a gradient of mobile phase (0.25% formic acid-methanol). The column effluent was split 2: 3 into the photodiode detector and tandem mass spectrometer. Podophyllotoxin, quercetin and kaempferol in podophyllin were identified by daughter ion scan mode and then determined their contents by multiple-reaction monitoring (MRM) mode. The limits of detection and quantitation for podophyllotoxin, quercetin and kaempferol were 2.40, 8.01; 2.94, 9.87 and 3.10, 10.2 ng/mL, respectively. The relative standard deviations of intraday and interday analyses for podophyllotoxin, quercetin and kaempferol ranged from 0.52-6.01% and 2.48-9.88%, respectively. The mean recoveries for podophyllotoxin, quercetin and kaempferol were 101.4%, 98.3% and 98.7%, respectively. The developed LC/MS/MS method was suitable for the simultaneous determinations of podophyllotoxin, quercetin and kaempferol in podophyllin.
Key words: LC/MS/MS, podophyllin, podophyllotoxin, quercetin, kaempferol
INTRODUCTION
Podophyllin is an alcoholic plant extract from the dried rhizomes and roots of Podophyllum emodi (Indian Podophyllum) and P. peltatum (Mayapple or Mandrake). It possessed various biological activities, and had been used to treat constipation, hepatic disorder, and rheu-matic arthritis. In 1942, podophyllin was suggested as a treatment of condylomata acuminata, one type of venere-al warts, by Kaplan(1) . Though severe systematic toxici-ties from ingestion or tropical application of podophyllin had been reported, the side effects were usually revers-ible and fatal(2). Hence, so far it was used as a tropical treatment for genital warts and required to apply a thin layer to warts to minimize its side effects(3). The chemical constituents of podophyllin had been studied since the nineteenth century. Podophyllotoxin (Figure 1), the major constituent of podophyllin, was firstly separated and identified in 1880, and subsequent-ly, a series of aryltetralin-type lignans were isolated and documented(4-6). In addition to lignans, flavonoids, such as quercetin and kaempferol (Figure 1) have also been
found in podophyllin. Podophyllotoxin has been known to display antitumor activity(7), often used as a starting
material for the synthesis of anticancer drug. Clinically, external preparation of podophyllotoxin was made for the treatment of genital warts as podophyllin. Querce-tin and kaempferol distribute widely in most of herbals,
* Author for correspondence. Tel: +886-2-27361661 ext. 6123;
Fax: +886-2-27374622; E-mail: ywcheng@tmu.edu.tw;
dhwcheng@tmu.edu.tw Figure 1. Structures of podophyllotoxin, quercetin and kaempferol. O O O O OCH3 OCH3 H3CO OH O HO OH OH OH OH O O HO OH OH OH O Podophyllotoxin Quercetin Kaempferol
vegetables, fruits and beverages. Studies have shown that flavonoids have multiple biological activities such as antioxidant(8), anti-inflammatory, antiviral, platelet
aggregation inhibition(9), and antiaging(8); some reports
suggested that supplement flavonoids could prevent the incidence of cardiovascular diseases(8,10,11)
.
A preliminary genotoxicity survey on chemicals showed that podophyllin was a potent mutagen in Ames Salmonella test. In order to investigate the mechanism of genotoxicity induced by podophyllin, the constituents of podophyllin need to be identified. Various analytical methods for the chemical constituents of podophyllin or Podophyllum spp. have been published. Mishra et al.(12)
described the determination of podophyllotoxin content in P. hexandrum by reverse phase high performance thin layer chromatography (HPTLC)/Scanning Densitometry. A comparison test for the quantitation of podophyllotox-in from P. hexandrum roots by quantitative high perfor-mance liquid chromatography and HPTLC was conduct-ed by Mishra et al.(13). The limit of detection (LOD) and
limit of quantitation (LOQ) for methanol extract and resin ranged from 30-100 pg and 110-615 pg by HPLC and 51-133 ng and 136-872 ng by HPTLC, respectively. Nikolova et al.(14) presented the quantification of
querce-tin in Artemisia vulgaris by TLC/Densitometer, and the LOD was
0.06 μg/spot
.TLC cannot further provide identification information, though it’s a simplest and high throughput technique. Hence, TLC is now mainly used for the initial examination of plant materials and for the monitoring of various stages during the natural products purification.
Lim(15) compared the resolutions of eight lignans by
HPLC using four kinds of mobile phases and suggested that methanol-water system is most suitable for lignans separation. Bastos et al.(16) detected eight Podophyllum
lignans in P. peltatum by HPLC. Although the analysis of podophyllotoxin showed good resolution and accept-able recoveries from 74.9 to 106.3% in different parts of the plant, complicated mobile phases composed of aceto-nitrile, acetic acid, ammonium acetate, ethanol, metha-nol, methyl-t-butyl ether and tetrahydrofuran were used. Shen and Tien(17) applied two different mobile phases to
determine the contents of podophyllotoxin and quercetin respectively, methanol-water (65:35) for the former and methanol-phosphoric acid for the later. Liu and Jiao(18)
demonstrated methanol-water, methanol-phosphate buffer (pH 2.5) and acetonitrile-phosphate buffer (pH 2.5) as mobile phases with isocratic or gradient elution to separate eight lignans, quercetin and kaempferol. Those data indicated the calibration concentrations ranging from 2-40 µg/mL for quercetin and kaempferol and 2.08-104 µg/mL for podophyllotoxin. The recovery data from the standard addition was 94.7-101.3% but no further LOD and LOQ data was provided.
Gas chromatography/Mass spectrometry (GC/MS) is often used in the analysis of volatile compounds, other-wise derivatization was needed. A quick and simple
GC/MS method for lignan profiling except for podo-phyllotoxin in Anthriscus sylvestris has been published by Koulmann et al.(19). As to quercetin and kaempferol,
derivatization of these compounds has been performed prior to GC/MS analysis(20-22). As herbal extracts often
contain structure related compounds, poor derivatization might result in more complicated products, thus increas-ing the analytical complexity.
Capillary electrophoresis (CE) has gained acceptance as alternative to conventional liquid chromatography in analytical research field because of its merits-high reso-lution, small sample volumes, extraordinarily low buffer solution consumption, and rapid separation. Liu et al. (23,24) reported two MEKC methods for the quantitative
analysis of seven lignans in P. emodi and seven pairs of diastereoisomers at C2-position. Zhang et al.(25) described
the application of CE to the qualitative and quantification of quercetin and kaempferol in Ixeridium gracile. CE can also monitor the configuration of lignans, in the case well controlled parameters, such as pH, SDS and modifier concentration.
Among the above-mentioned publications, only Liu and Jiao(18) discussed the simultaneous analyses of
podophyllotoxin, quercetin, and kaempferol. Literatures regarding to simultaneous analysis of lignans and flavo-noids were few. As mass spectrometer detector is more sensitive and specific than conventional UV detector, HPLC/MS and HPLC/MS/MS were gradually applied to analyze herb, dietary supplements, food, pesticide-resi-due and veterinary drugs(26,27). Hence, we developed a
new analytical method to characterize and determine the contents of podophyllin.
MATERIALS AND METHODS
I. Chemicals and Reagents
Podophyllin 8582, P-5583), podophyllotoxin (P-4405, Purity 99.9%), quercetin (Q-0125, Purity 99.0%) and kaempferol (K-0133, Purity 94.0%), caffeine (Inter-nal standard, 99.6%), formic acid and all of chemicals used for the Ames Salmonella test were purchased from Sigma-Aldrich (St, Louis, MO, USA). Methanol of HPLC grade was from J.T. Baker (Deventer, Netherlands). II. Ames Salmonella Test
The method was based on the recommendations of Maron and Ames(28) and Organization for
Econom-ic Cooperation and Development (OECD) guidelines (1997)(29). The Salmonella typhimurium bacteria and
histidine auxotrophic strains TA98, TA100, and TA102 were obtained from MOLTOX (Molecular Toxicology, Annapolis, MD) and grown for 14 h at 35 ± 2°C with continuous shaking. Bacteria were grown to the density of 1 to 2 × 10⁹ cells/mL with absorbance at 600 nm of
0.2-0.3. Top agar containing 2 mL of heated agar, 0.1 mL of test chemical and 0.1 mL of bacteria, was mixed up and added to three different minimal glucose agar plates. All plates were incubated at 37°C for 48 h, and the number of bacteria colonies was determined. The entire experi-ment was repeated again on different day with a total of six plates for each concentration of podophyllin. Each tester strain was routinely checked to confirm its features for optimal response to three known mutagenic chemi-cals as follows: 4-nitroquinolone-N-oxide (0.5 µg/plate), mitomycin c (0.5 µg/plate), and 2-aminoanthracene (5 µg/plate). A test compound was judged to be mutagenic in the plate test if it produced, in at least one concentra-tion and one strain, a response equal to twice (or more) of the control incidence with a dose-response(30,31). The
only exception was strain TA102, which had a relatively high spontaneous revertant number, where an increase by a factor of 1.5 above the control level was taken as an indication of a mutagenic effect.
III. LC/MS/MS Analysis
(I) Standards and Sample Solution
The standard stock solutions of podophyllotoxin, quercetin and kaempferol as well as internal standard stock solution were prepared in methanol. The working standard solutions of combined standard were subse-quently prepared, containing the internal standard of 10 µg/mL, and used to construct the calibration curve. The working standard concentration ranged from 1-100 µg/ mL for podophyllotoxin and 0.5-50 µg/mL for kaempfer-ol and quercetin. The sample stock solution (1000 µg/mL of podophyllin in methanol) was used for the identifica-tion. The sample solution for the quantitation (200 µg/ mL) was prepared by diluting the sample stock solution, which was spiked with the internal standard of 10 µg/mL. (II) LC/MS/MS Conditions
LC/MS/MS experiments were carried out on a Quat-tro Ultima tandem mass spectrometer coupled with a Waters 2690 Alliance LC & 996 PDA with an automatic liquid sampler and an injector. Chromatographic separa-tion was performed on a Cosmosil 5C18-MS (25 cm × 4.6 mm I.D., 5 µm) reverse phase column (Nacalai Tesque, Kyoto, Japan) with the injection volume of 10 µL. The mobile phase consists of mixture of 0.25% formic acid (A) and methanol (B) using a gradient elution. The gradi-ent program was set as follows: 0-5 min, 55% B to 60% B; 5-25 min, 60% B to 70% B; 25-28 min, 70% B to 55% B; and 28-30 min, 55% B. The flow rate was set at 0.5 mL/min. The interface between HPLC and mass spec-trometer was atmospheric pressure ionization source with the electrospray inlet operated in the positive mode. The column effluent was split 2:3 into the photodiode detector and tandem mass spectrometer. The mass spectrometer
parameters were set as follows: capillary voltage 3 kV, the ion source temperature 100°C, desolvation tempera-ture 350°C, cone gas (nitrogen) flow 50 L/h, desolvation gas (nitrogen) flow 500 L/h, ion energy 1.0 V and multi-plier 600 V. The parent ion ([M+H]+) for each standard
was obtained from MS scanning mode by tuning the cone voltage (V) while direct infusing the standard solution into the mass spectrometer. Subsequently, daughter ion scan mode was carried to get its daughter ions resulted from the fragmentation of the precursor ion. Different collision energy (eV) was applied to obtain the optimal daughter ion spectrum, which was used to establish the mass spectra library. Argon was used as collision gas at a pressure of 3-4 × 10⁻³ mbar. In this study, the cone
voltage/collision energy was set at 40V/10eV, 40V/30eV and 80V/30eV for podophyllotoxin, quercetin and kaemp-ferol, respectively. The optimal parameters of daughter ion scan mode for them were saved as a mass file for the subsequent identification work. Multiple reactions moni-toring (MRM) with specific parent/daughter ion transi-tion was used for quantitation. Similarly, MRM method containing transition ions, dwell time, cone voltage and collision energy was set up for the following work. The transitions (precursor to product ion) monitored were m/z 415.3→397.4 for podophyllotoxin; 303.3→153.2 for quer-cetin; 287.3→153.3 for kaempferol, and 195.3→138.2 for the internal standard caffeine. The dwell time per tran-sition was 0.25 sec. Peak areas of all compounds were automatically integrated using MassLynx 4.0 software.
The contents of podophyllotoxin, quercetin and kaempferol were determined by multiplying dilution factor and the interpolated concentrations through each of calibration curve.
(III) Calibration Curve, Limit of Detection, Limit of Quan-tification
Five levels of working standard solutions were measured in triplicate. Each calibration curve was constructed by linear regression of the average peak area ratio of standard to internal standard versus stan-dard concentration. The LOD was the concentration of signal-to-noise ratio of 3, and LOQ was determined as the concentration of signal-to-noise ratio of 10.
(IV) Interday and Intraday Assays
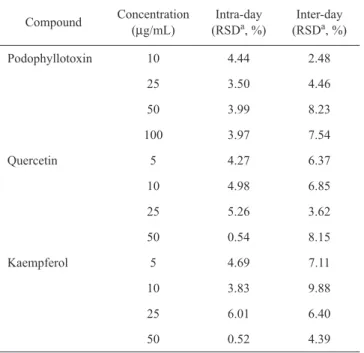
Blank samples spiked with each standard at differ-ent concentrations were used in the evaluation of inter-day and intraday assays. In this experiment, four levels of standards were spiked as follows: 10, 25, 50 and 100 µg/mL for podophyllotoxin, 5, 10, 25 and 50 µg/mL for quercetin and kaempferol. Each spiked sample was determined in triplicate for three different days. The interday and intraday precisions were evaluated using the relative standard deviation.
(V) Recovery
The recoveries of podophyllotoxin, quercetin and kaempferol in podophyllin were determined by spiking standards of podophyllotoxin, quercetin and kaempferol
into podophyllin. The spiked concentrations in podo-phyllin were 20, 35 and 50 µg/mL for podophyllotoxin, 5, 20 and 25 µg/mL for quercetin and kaempferol, respec-tively. Both spiked and un-spiked podophyllin samples were run for analysis. The recovery was determined by Figure 2. The total multiple reaction monitoring (MRM) chromatograms of podophyllin and individual MRM channel of podophyllotoxin, quercetin and kaempferol from top to bottom by using mobile phase of methanol-water system (A) and methanol-0.25% formic acid (B). The gradient programs for (A) and (B) is the same. Methanol composition is as follows: 0-5 min, 55% - 60%; 5-25 min, 60%-70%; 25-28 min, 70%-55%; and 28-30 min, 55%. 100 % 0 2.00 4.00 6.00 8.02 9.46 10.96 10.96 12.65 13.49 15.27 8.00 10.00 12.00 14.00 16.00 18.00 20.00 22.00 24.00 Time Quercetin Quercetin Podophyllotoxin Podophyllotoxin Kaempferol MJ0509-S2-3 1: MRM of 3 Channels ES+ TIC 2.37e5 1: MRM of 3 Channels ES+ 287.3 > 153.2 6.69e4 1: MRM of 3 Channels ES+ 303.3 > 153.2 3.72e4 1: MRM of 3 Channels ES+ 415.3 > 397.4 2.25e5 100 % 0 MJ0509-S2-3 100 % 0 100 % 0 8.02 9.46 10.62 12.65 13.49 15.27 Kaempferol MJ0509-S2-3 (A) MJ0509-S2-3 100 % 0 2.00 4.00 6.00 8.55 16.38 10.41 12.26 14.60 15.27 8.00 10.00 12.00 14.00 16.00 18.00 20.00 22.00 24.00 Time Quercetin Quercetin Podophyllotoxin Podophyllotoxin Kaempferol MJ0509-S2-6 1: MRM of 3 Channels ES+ TIC 1.38e6 1: MRM of 3 Channels ES+ 287.3 > 153.2 1.08e5 1: MRM of 3 Channels ES+ 303.3 > 153.2 1.04e5 1: MRM of 3 Channels ES+ 415.3 > 397.4 1.36e6 100 % 0 MJ0509-S2-6 100 % 0 100 % 0 20.04 14.60 16.38 12.26 Kaempferol MJ0509-S2-6 (B) MJ0509-S2-6 20.04
comparing the peak area ratio of the spiked sample to un-spiked podophyllin.
RESULTS AND DISCUSSION
I. Ames Salmonella Test
The data of podophyllin induced histidine rever-tants in three strains of Salmonella typhimurium were listed in Table 1 and indicated that podophyllin increased colony formation in strains TA98, TA100 and TA102 in a concentration-dependent manner. The increasing folds over the negative control at podophyllin of 1000 µg/plate in TA98, TA100 and TA102 reach 12.0, 2.7 and 1.9 folds, respectively. The induction of TA98 strain over 3 times relative to control was taken as a mutagenic effect by FDA guideline in 2004(32).
II. Analysis of Podophyllin by LC/MS/MS
Prior to this study, the analysis of podophyllotoxin, quercetin and kaempferol by HPLC(18) or CE has been
reported in the literatures. HPLC/UV method can afford qualitative and quantitative data and is often employed in the analytical works. CE/UV is an alternative tech-nique to HPLC, which provides efficiency equivalent to HPLC. The shortcoming of HPLC/UV and CE/UV is the need of reference standard involved in the experiment. HPLC, GC or CE hyphenate mass detector can improve the demand of reference standard because of mass spec-tra specificity. Considering the physico-chemical prop- erties of the constituents in this study, GC is not a suit-able method for them. Recently, LC/MS/MS application to chemical analyses of food, drug and herbal medicine is gradually increasing, hence, it prompted us to develop a simultaneous analysis of podophyllin.
(I) Mobile Phase Considerations
In the preliminary study, different ratios of mobile phases (acetonitrile-water and water-methanol) were employed to optimize HPLC separation and MS sensitiv-ity. Poor resolution in acetonitrile-water was improved by using methanol-water system; this result is the same as Liu and Jiao(18). Lim’s research also revealed that the
methanol-water mobile phase for the analysis of lignans was better and indicated that methanol, an H-bonding organic modifier, formed various degrees of H-bond with different lignans in various structures and stereo-config-uration, thus resulting in longer retention time and better resolution(15). Acetic acid and formic acid often added
into the mobile phase to enhance the ionization of inter-ested compound. Formic acid was selected as an acidic buffer in this study due to its lower boiling point and less smell than acetic acid. The concentration of acidic solvent commonly used ranged from 0.1% to 1%. As shown in the chromatogram in Figure 2, the methanol-formic acid system for the analysis of podophyllotoxin, quercetin and kaempferol was superior to methanol-water system concerning the peak resolution and peak shape even if the former increased the retention time. The concentration of formic acid used in this study was evalu-ated based on the interested ion intensity obtained by using various concentrations of formic acid. The result showed in Figure 3A. The high concentration of formic acid might suppress ionization efficiency of podophyllo-toxin, but exert less suppression effect on quercetin and kaempferol. Besides, both methanol-water system and methanol-formic acid system were conducted in order to confirm the signal intensity (Figure 3B). The ion signal intensity of podophyllotoxin was enhanced, but less effect was found in quercetin and kaempferol test. Therefore, mobile phase composed of 0.25% formic acid-methanol was selected to perform the following quantitative work.
Table 1. Induction of His+ Revertants in three Strains of Salmonella Typhimurium by podophyllin without Metabolic Activation (S9)
Strains His +/plate Negative controla Positive controlc, d PD (μg/plate) 1 20 200 1000 TA 98 27 ± 2 301 ± 29 *** 19 ± 1 (0.7) b 22 ± 2 (0.8) 100 ± 7***(3.7) 225 ± 40***(8.3) TA 100 97 ± 5 678 ± 41*** 73 ± 15 (0.8) 62 ± 7 (0.6) 111 ± 10 (1.1) 213 ± 3***(2.2) TA 102 141 ± 9 1277 ± 82*** 132 ± 3*(0.9) 144 ± 7 (1.0) 221 ± 15*** (1.6) 272 ± 9***(1.9) The values were presented as mean ± SE (N ≥ 6). *p < 0.05, **p < 0.01, ***p < 0.001 vs. the negative control. a 2 µL DMSO/plate was used as the negative control. b Fold increased relative to the negative control.
c Positive control in –S9 plate: TA 98, 4-nitro-O-phenylenediamine 2 µg/plate; TA 100, sodium azide 5 µg/plate; TA102, mitomycin C 0.5
µg/plate.
(II) Sample Preparation and Matrix Effect Evaluation As podophyllin is an alcohol extract, the
inter-ested constituents containing hydroxy group would be easily dissolved in methanol(33). Hence,
podophyl-lin was dissolved in methanol and then directly injected
Podophyllotoxin Quercetin Kaempferol
Io n in te ns ity 0 10000 20000 30000 40000 0.1% Formic acid 0.25% Formic acid 0.5% Formic acid 1.0% Formic acid
Podophyllotoxin Quercetin Kaempferol
Io n in te sn si ty 0.0 2.0e+5 4.0e+5 6.0e+5 8.0e+5 1.0e+6 1.2e+6 1.4e+6 1.6e+6 Methanol-water
Methanol-0.25% Formic acid (A) (B) Figure 3. Ion signal intensity of podophyllotoxin, quercetin and kaempferol in standard solution (A) and in podophyllin (B). The analysis was performed by using methanol-formic acid system with gradient elution and the mass conditions seen in materials and methods. The concentration of acidic buffer from 0.1% to 1.0% displayed different ion signal intensity for podophyllotoxin, quercetin and kaempferol. The higher concentration was used, the signal suppression on podophyllotoxin was more obviously, but not found in quercetin and kaempferol (A). The ion signal of podophyllotoxin increased in podophyllin, but little effect on quercetin and kaempferol while the presence of acidic buffer (B). Figure 4. The comparative results of calibration curves and linear regression equations for the survey on matrix effect study of podophyllin.
Four levels of standard solution were added into diluted podophyllin solution and performed the LC/MS/MS analysis. The final concentrations of podophyllin used were 1.5 µg/mL and 0.1 µg/mL for external standard addition curve (A-C) and internal standard curves (D-F), respectively. The calibration curves were constructed as described in material and methods. ♦ and ■ represented standard curves (external and internal standard), and standard addition curves (with or without internal standard) Ratio*: Standard peak area/Internal standard peak area. 160000 140000 120000 100000 80000 60000 40000 20000 0 0 10 20 30 40 50 60 (A) Podophyllotoxin Concentration (µg/mL) y = 2847.1x + 7103.6 R2 = 0.9946 y = 2747x + 12047 R2 = 0.9944 Peak area 0.8 0.7 0.6 0.5 0.4 0.3 0.2 0.1 0 0 5 10 15 20 25 30 Concentration (µg/mL) y = 0.0246x + 0.0049 R2 = 1.000 y = 0.0279x + 0.0089 R2 = 0.999 Ratio* 40000 35000 30000 25000 20000 15000 10000 5000 0 0 10 20 30 40 50 60 Concentration (µg/mL) y = 597.08x + 2427.2 R2 = 0.9945 y = 599.77x + 3924.3 R2 = 0.9912 Peak area 0.07 0.06 0.05 0.04 0.03 0.02 0.01 00 2 4 6 8 10 12 Concentration (µg/mL) y = 0.0064x + 0.0004 R2 = 0.996 y = 0.0062x - 0.0003 R2 = 0.9997 Ratio* 50000 40000 30000 20000 10000 00 10 20 30 40 50 60 Concentration (µg/mL) y = 774.68x + 3981.4 R2 = 0.9973 y = 773.55x + 5485.4 R2 = 0.9901 Peak area 0.12 0.1 0.08 0.06 0.04 0.02 00 2 4 6 8 10 12 Concentration (µg/mL) y = 0.0107x − 0.0002 R2 = 0.9997 y = 0.0104x - 0.0002 R2 = 0.9959 Ratio* (D) Podophyllotoxin
(B) Quercetin (E) Quercetin
into LC/MS/MS system without cleanup process, such as solid phase extraction or liquid-liquid extraction. LC/ MS/MS can provide quick analysis but certain papers indicated ion suppression hampered its application. The ion suppression might mainly come from the complex of matrix, implying certain interference co-elutes with interested ions in the analytical condition. The effect of ion suppression reduced ionization efficiency and cause poor reproducibility and accuracy. A great number of papers discussed the compensation or correction meth-ods for ion suppression. The methmeth-ods included the use of internal standards, the application of standard dilu-tion method, diludilu-tion of the extract before instrumental determination and off-line or on line extraction proce-dures(34,35). For the detection of matrix effect, some
researchers performed post-column infusion method of interest compound while the MRM transition was record-ed during an injection of blank matrix sample(36), or application of different solid phase extraction for remov-ing interference(37).
In this study, matrix effect was investigated as following. First, as there is no blank matrix obtainable, sample solution was diluted prior to adding standard. A new calibration curve was constructed to compare the external standard curve. The slopes of standard curves constructed from methanol solution or diluted podophyl-lin solution are very close, implying that matrix effect is negligible (Figure 4A). Secondly, internal standard was selected to perform the test as the addition of internal standard excluded variation in extraction and reconstitu-Table 2. Validation test for podophyllotoxin, quercetin and kaempferol (n = 3)
Compound Linearity range (µg/mL) Calibration Curve Correlation Coefficient LODa (ng/mL) LOQb (ng/mL)
Podophyllotoxin 1-100 Y = 0.025209X + 0.046406 0.9994 2.40 8.01 Quercetin 0.5-50 Y = 0.011124X + 0.004123 0.9999 2.94 9.87 Kaempferol 0.5-50 Y = 0.018998X + 0.016987 0.9996 3.10 10.2 aLOD = Limit of Detection; bLOQ = Limit of quantitation. Figure 5. The daughter ion chromatograms of podophyllin analyzed by LC/MS/MS (A), library search results (B-D) and the possible mass fragmentation pathways for podophyllotoxin, quercetin and kaempferol (E). The daughter ion spectra for standards of podophyllotoxin, quercetin and kaempferol were established in the previous test. Podophyllin was analyzed by 0.25% formic acid-methanol with gradient elution and using the same electrospray mode coupled with daughter ion scan mode. The peaks at retention times of 16.4, 15.1 and 21.1 min were processed by Masslynx 4.0 software and further compared with the mass spectra database. The search results are shown in B-D. The R score means reverse peak search. The higher R score indicates higher similarity of mass spectra between unknown compound and pure compound in the mass database. 100 % 0 2.00 4.00 6.00 8.768.92 11.96 14.13 15.10 8.00 10.00 12.00 14.00 16.00 18.00 20.00 22.00 24.00 Time Quercetin Podophyllin Podophyllin Podophyllin Podophyllotoxin Kaempferol 1: Daughters of 303ES+ TIC 1.53e7 2: Daughters of 287ES+ TIC 2.21e7 3: Daughters of 415ES+ TIC 4.63e7 100 % 0 100 % 0 21.11 16.38 (A)
tion. Internal standards were often selected from struc-ture related compounds or its isotope compounds. The isotope compound was not easily obtained; caffeine was selected since there is no interference peak correspond- ing to caffeine retention time in the total ion chromato-gram. From the interday assay, the relative standard deviations were less than 10%, hence, the matrix effect might be neglected.
(III) Identification and Determination of Podophyllotoxin, Quercetin and Kaempferol by LC/MS/MS
As there is no available LC/MS/MS database, a homemade-library needs to be established. Each stan- dard solution of podophyllotoxin, quercetin and kaemp-ferol was introduced into tandem mass spectrometer to obtain its parent ion spectrum and then further obtain its daughter ion spectrum. The daughter ion spectra were Figure 5. Continued 122.0 169.0 185.0 229.0 Podophyllin (16.385 min) 100 % 0 (B) 100 % 0 50.0 100.0 89.0 50.8 59.8 78.8 117.1 135.4 169.3 185.3 229.5 247.4 283.4 306.5 313.5 351.5 379.7 397.5 415.9 441.6 448.5 103.0 247.0 282.0 306.0 313.0 351.0 379.0 397.0 416.0 430.0 150.0 200.0 250.0 300.0 350.0 400.0 450.0 m/z nlfd3 2919: Podophyllotoxin-ES+D415.5-40/10/3 R:953 Hit 1 1.84e6 137.0 153.0 165.0 183.0 245.0 Podophyllin (15.135 min) 100 % 0 (C) 100 % 0 100.0 93.0 84.0 82.0 93.4 109.3 121.4 137.4 153.3 173.3 165.4 201.3 229.4 228.3 239.5 257.4 274.5 303.4 323.5 336.2 349.2 109.0 229.0 201.0 228.0 257.0 274.0 303.0 308.0 150.0 200.0 250.0 300.0 350.0 m/z nlfd3 2917: Quercetin-ES+D303-80/30/3 R:983 Hit 1 1.44e5 137.0 153.0 165.0 185.0 231.0 Podophyllin (21.125 min) 100 % 0 (D) 100 % 0 100.0 107.0 81.0 83.5 93.4 111.2 121.4 137.3 153.3 185.3 165.3 213.4 258.4 241.4 286.6 287.4 288.8 305.4 347.2 111.0 121.0 213.0 258.0 285.0287.0 150.0 200.0 250.0 300.0 350.0 m/z nlfd3 1744: Kaempferol-ES+D287-40/30/3 R:997 Hit 1 2.81e5 (E) O O O O OCH3OCH3 H3CO m/z 397 m/z 247 OH +H m/z 415 O HO O OH OH OH OH +H m/z 303 m/z 153 O HO OH OH OH O +H m/z 153 m/z 287
established into the library as reference spectra. Prior to quantitation, podophyllin solution was analyzed by HPLC and the LC effluent was split into PDA and mass spectrometer. The tandem mass spectrometry was oper- ated on three kinds of daughter ion scanning mode simul-taneously. Figure 5A presented the total ion current chromatogram of podophyllin. Its daughter ion spectra at retention time 16.4, 15.1, and 21.1 min were selected to compare with the library. Besides, the peaks at 12.0 and 14.13 min also appeared in the positive m/z 415 channel, which implied those are belong to lignans-like constituents. By automatic mass spectra library search-ing function, the possible presences of podophyllotoxin, quercetin and kaempferol in podophyllin were showed. The searching algorithm was based on the comparison of the unknown mass spectra with library by using reverse search algorithm. The reverse peak search enables accurate matching of mixture against library of pure compound spectra. The higher R score indicates higher similarity of mass spectra between unknown compound and pure compound in the mass database. As shown in Figure 5B-5D, podophyllotoxin, quercetin and kaempfer-ol were identified unambiguously according to R scores (>950) and comparisons with retention time between podophyllin and standards. The possible mass fragmen-tation pathways were also described in Figure 5E. The ions at m/z 397.4, 153.2, and 153.3 respectively repre-sented the daughter ions of protonated podophyllotoxin, quercetin and kaempferol ions and were selected as the MRM transition ion for the following quantitation.
Figure 6 showed the MRM chromatograms of stan-dards and podophyllin solutions. LC/MS/MS method was more selective and specific than traditional HPLC/ UV-Visible method because of the detection from mass spectrometer. There is no interference peak found in the analysis, indicating a suitable method. The calibration curves, correlation coefficients, limit of detection and limit of quantitation for podophyllotoxin, quercetin and kaempferol were listed in Table 2. Table 3-4 listed the intraday precision and interday precision of podophyl-lotoxin, quercetin and kaempferol and their respective recovery in podophyllin. The relative standard devia-tions of intraday analysis for podophyllotoxin, quercetin and kaempferol were 3.50-4.44%, 0.54-5.26% and 0.52-6.01%, respectively. The relative standard deviations of interday assay for podophyllotoxin, quercetin and kaemp-ferol were 2.48-8.23%, 3.62-8.15%, and 4.39-9.88%, respectively. The mean recoveries for podophyllotoxin, quercetin and kaempferol were 101.4%, 98.3% and 98.7%, respectively. The above results showed that precision and accuracy met the acceptable criteria. The contents of podophyllotoxin, quercetin and kaempferol in podophyl-lin (sample A) were shown in Table 5. Besides, another two different sources of podophyllin (samples B and C) were also analyzed and listed the results in Table 5. The contents of podophyllotoxin, quercetin and kaempferol showed little difference between them.
Table 4. The recovery analysis of podophyllotoxin, quercetin and
kaempferol (n = 3)
Compound (µg/mL)Add Recovery (%) recovery (%)Average RSD(%)a
Podophyllotoxin 20 101.8 ± 8.29 35 104.0 ± 5.61 101.4 ± 2.82 2.78 50 98.4 ± 6.75 Quercetin 5 102.7 ± 0.61 20 91.1 ± 0.28 98.3 ± 6.26 6.37 25 101.0 ± 0.60 Kaempferol 5 92.9 ± 2.86 20 105.3 ± 1.69 98.7 ± 6.25 6.33 25 97.8 ± 7.8 a RSD = Relative standard deviation. Table 5. The contents of podophyllotoxin, quercetin and kaempferol in three different sources of podophyllin Content (Mean ± SDa, RSDb %)
Sample Podophyllotoxin Quercetin Kaempferol
A 311.7 ± 22.2 (7.12) 18.1 ± 1.42 (7.80) 32.0 ± 1.57 (4.90) B 345.9 ± 27.1 (7.83) 25.5 ± 1.34 (5.25) 14.7 ± 1.30 (8.84) C 297.8 ± 23.9 (8.03) 28.1 ± 0.49 (1.74) 20.2 ± 1.92 ( 9.50) a SD = Standard Deviation; bRSD = Relative standard deviation. Table 3. The intra-day and inter-day precision for analysis of podo-phyllotoxin, quercetin and kaempferol (n = 3)
Compound Concentration (µg/mL) (RSDIntra-day a, %) (RSDInter-day a, %)
Podophyllotoxin 10 4.44 2.48 25 3.50 4.46 50 3.99 8.23 100 3.97 7.54 Quercetin 5 4.27 6.37 10 4.98 6.85 25 5.26 3.62 50 0.54 8.15 Kaempferol 5 4.69 7.11 10 3.83 9.88 25 6.01 6.40 50 0.52 4.39 a RSD = Relative standard deviation.
CONCLUSIONS
In this paper, we briefly reported that podophyllin was a mutagen in Ames Salmonella test. As podophyl-lin was a resinous mixture, we analyzed its constituent in order to clarify the contribution of genotoxicity. LC/MS/ MS is often employed to identify and analyze chemical
compounds due to the specificity and high sensitivity of mass spectrometer, though matrix effect or ion suppres-sion might be an obstacle to perform the study. So far, LC/MS/MS often provides multiple channel detection modes and then easily analyzes multiple compounds within single run. In this presentation, we set up three kinds of daughter ion spectra for the following character-Figure 6. The multiple reaction monitoring chromatograms of podophyllin (A) and standards (B). One MRM mode consists of 4-channel MRM, which represented podophyllotoxin, quercetin, kaempferol and internal standard from top to bottom. In this experiment, caffeine was used as the internal standard (Retention time 6.8 min). 2.00 4.00 6.00 8.00 10.00 12.00 14.00 16.00 18.00 20.00 22.00 24.00 Time Quercetin Internal standard Podophyllotoxin Kaempferol 1: MRM of 4 Channels ES+ 415.3 > 397.4 6.93e5 Area 1: MRM of 4 Channels ES+ 303.3 > 153.2 8.51e4 Area 1: MRM of 4 Channels ES+ 287.3 > 153.2 1.23e5 Area 1: MRM of 4 Channels ES+ 195.3 > 138.2 1.97e6 Area 100 % 0 100 % 0 100 % 0 100 % 0 16.87 15.60 6.77 21.41 (A)Podophyllin 2.00 4.00 6.00 8.00 10.00 12.00 14.00 16.00 18.00 20.00 22.00 24.00 Time Quercetin Internal standard Podophyllotoxin Kaempferol 1: MRM of 4 Channels ES+ 415.3 > 397.4 3.76e5 Area 1: MRM of 4 Channels ES+ 303.3 > 153.2 1.83e5 Area 1: MRM of 4 Channels ES+ 287.3 > 153.2 2.66e5 Area 1: MRM of 4 Channels ES+ 195.3 > 138.2 1.71e6 Area 100 % 0 100 % 0 100 % 0 100 % 0 16.81 172248 15.51 6.77 21.32 (B)Standard solution
ization of podophyllin. Within one run, three constitu-ents can be easily identified. The established daughter ion library could provide the identification reference for the inspection of herbal materials. Application of MRM mode to analyze the contents of podophyllotoxin, querce-tin and kaempferol in podophyllin is also presented. In short, this method is rapid, sensitive and selective, and it can be used to inspect various sources of podophyllin or Podophyllum species. Besides, the data obtained from this analysis will be further employed to investigate the genotoxicity induced by podophyllin.
REFERENCES
1. Kaplan, I. W. 1942. Condylomata Acuminata. New Orleans Med. Surg. J. 94: 388-390.
2. Reynold, J. E. F. and Prasad, A. B. 1996. Podophyllum. In“Martindale, The Extra Pharmacopoeia”. 31st ed. pp. 1092. Royal Pharmaceutical Society. London, United Kingdom.
3. Scheinfeld, N. and Lehman, D. S. 2006. An evidence-based review of medical and surgical treatments of genital warts. Dermato. Online J. 12: 5.
4. Xiao, P. G. 2002. Bajiaolian and Xiaoyelian. In “Modern Chinese Material Medica”. Volume I: pp13-16, Volume II: pp70-74. Li, D. P., Yang, S. L. eds. Chemical Industry Press. Beijing, China.
5. Ghen, Y. H. 1979. A study on the resources of Chinese podophyllin plants. Yao Xue Xue Bao 14: 101-107. 6. Liu, F., Shang, T. M. and Fu, F. Y. 1979. Studies
on chemical constituents of the root of the Chinese medical drug Podophyllum emodi var. chinensis Sprague. Yao Xue Xue Bao 14: 241-245.
7. Canel, C., Moraes, R. M., Dayan, F. E. and Ferreira, D. 2000. Podophyllotoxin. Phytochemistry 4: 115-120. 8. Rice-Evans, C. 2001. Flavonoid antioxidants. Curr.
Med. Chem. 8: 797-807.
9. Tzeng, S. H., Ko, W. C., Ko, F. N. and Teng, C. M. 1991. Inhibition of platelet aggregation by some flavo-noids. Thromb. Res. 64: 91-100.
10. Cao, G., Russell, R. M., Lischner, N. and Prior, R. L. 1998. Serum antioxidant capacity is increased by con-sumption of strawberries, spinach, red wine or vitamin C in elderly women. J. Nutr. 128: 2383-2390.
11. Carollo, C., Presti, R. L. and Caimi, G. 2007. Wine, diet, and arterial hypertension. Angiology 58: 92-96. 12. Mishra, N., Gupta, A. P., Singh, B., Kaul, V. K. and
Ahuja, P. S. 2005. A rapid determination of podophyl-lotoxin in Podophyllum hexandrum by reverse phase high performance thin layer chromatography. J. Liq. Chromatogr. & Related Tech. 28: 677-691.
13. Mishra, N., Acharya, R., Gupta, A. P., Singh, B., Kaul, V. K. and Ahuja, P. S. 2005. A simple microanalyt-ical technique for determination of podophyllotoxin in Podophyllum hexandrum roots by quantitative RP-HPLC and RP-HPTLC. Curr. Sci. 88:1372-1373.
14. Nikolova, M., Berkov, S. and Ivancheva, S. 2004. A rapid TLC method for analysis of external flavonoid aglycones in plant exudates. Acta Chromatographica 14: 110-114.
15. Lim, C. K. 1996. Analysis of aryltetrahydronaphthalene lignans and their glucoside conjugates in podophyllin resin by high-performance liquid chromatography. J. Chromatogr. A 722: 267-271.
16. Bastos, J. K., Burandt, C. L., Nanayakkara, N. P. D., Bryant, L. and McChesney, J. D. 1996. Quantitation of aryltetralin lignans in plant parts and among different populations of Podophyllum peltatum by reversed-phase high-performance liquid chromatography. J. Nat. Prod. 59: 406-408.
17. Shen, G. Y., and Tian, X. 2006. Study on extraction methods of activity components from Podophyllum emodi Wall. Zhong Yao Cai 29: 480-482.
18. Liu, C. L. and Jiao, B. H. 2006. LC Determination of Podophyllum lignans and flavonoids in Podophyllum emodi Wall. var. chinesis Sprague. Chromatographia 64: 603-607.
19. Koulman, A., Bos, R., Medarde, M., Pras, N. and Quax, W. J. 2001. A fast and simple GC MS method for lignan profiling in Anthriscus sylvestris and biosyn-thetically related Plant species. Planta Med. 67: 858-862.
20. Füzfai, Z. and Molnár-Perl, I. 2007. Gas chromato-graphic-mass spectrometric fragmentation study of flavonoids as their trimethylsilyl derivatives: analysis of flavonoids, sugars, carboxylic and amino acids in model systems and in citrus fruits. J. Chromatogr. A 1149: 88-101.
21. Watson, D. G. and Oliveira, E. J. 1999. Solid-phase extraction and gas chromatography-mass spectrometry determination of kaempferol and quercetin in human urine after consumption of Ginkgo biloba tablets. J. Chromatogr. B Biomed. Sci. Appl. 723: 203-210. 22. Watson, D. G. and Pitt, A. R. 1998. Analysis of
flavo-noids in tablets and urine by gas chromatography/mass spectrometry and liquid chromatography/mass spec-trometry. Rapid Commun. Mass Spectrom. 12: 153-156.
23. Liu, S., Tian, X., Chen, X. and Hu, Z. 2001. Separation and determination of Podophyllum lignans by micellar electrokinetic chromatography. J. Chromatogr. A 928: 109-115.
24. Liu, S., Tian, X., Chen, X. and Hu, Z. 2002. Separa-tion of diastereoisomers of Podophyllum lignans by micellar electrokinetic chromatography. J. Chromatogr. A 959: 263-268.
25. Zhang, Y., Zhao, L. and Shi, Y. P. 2007. Separation and determination of flavonoids in Ixeridium gracile by capillary electrophoresis. J. Chromatogr. Sci. 45: 600-604.
26. Sherma, J. J. 2003. High-performance liquid chro-matography/mass spectrometry analysis of botanical medicines and dietary supplements: a review. J. AOAC
Int. 86: 873-881.
27. Picó, Y., Blasco, C. and Font, G. 2004. Environmental and food applications of LC-tandem mass spectrom-etry in pesticide-residue analysis: an overview. Mass Spectrom. Rev. 23: 45-85.
28. Maron, M. and Ames, B. N. 1983. Revised methods for the Salmonella mutagenicity tests. Mutat. Res. 113: 173-215.
29. Organization for Economic Cooperation and Devel-opment Test Guideline 471. 1997. Bacterial Reverse Mutation Test. In “OECD Guideline for Testing of Chemicals”. Organization for Economic Cooperation and Development. Paris, France.
30. De Serres, F. J. and Shelby, M. D. 1979. The Salmonel-la mutagenicity assay: recommendations. Science 203: 563-565.
31. Suter, W., Hartmann, A., Poetter, F., Sagelsdorff, P., Hoffmann, P. and Martus, H. J. 2002. Genotoxic-ity assessment of the antiepileptic drug AMP397, an Ames-positive aromatic nitro compound. Mutat. Res. 518: 181-194.
32. Introduction to the template for in Vitro bacterial reverse mutation (Ames) test. 2004. http://www.cfsan. fda.gov/~dms/opa-txo3.html.
33. Wong, S. K., Tsui, S. K., Kwan, S. Y., Su, X. L. and Lin, R. C. 2000. Identification and characterization of Podophyllum emodi by API-LC/MS/MS. J. Mass Spectrom. 35: 1246-1251.
34. Villagrasa, M., Guillamón, M., Eljarrat, E. and Barceló, D. 2007. Matrix effect in liquid chromatography-elec- trospray ionization mass spectrometry analysis of ben-zoxazinoid derivatives in plant material. J. Chromatogr. A 1157:108-114.
35. Souverain, S., Rudaz, S. and Veuthey, J. L. 2004. Matrix effect in LC-ESI-MS and LC-APCI-MS with off-line and on-line extraction procedures. J. Chro-matogr. A 1058: 61-66.
36. King, R., Bonfiglio, R., Fernandez-Metzler, C., Miller-Stein, C. and Olah, T. 2000. Mechanistic investigation of ionization suppression in electrospray ionization. J. Am. Soc. Mass Spectrom. 11: 942-950.
37. Shen, J. X., Shena, Motyka, R. J., Roach, J. P. and Hayes, R. N. 2005. Minimization of ion suppression in LC–MS/MS analysis through the application of strong cation exchange solid-phase extraction (SCX-SPE). J. Pharm. Biomed. Anal. 37: 359-367.