remote sensing
ISSN 2072-4292www.mdpi.com/journal/remotesensing
Article
Surface-Based Registration of Airborne and Terrestrial Mobile
LiDAR Point Clouds
Tee-Ann Teo * and Shih-Han Huang
Department of Civil Engineering, National Chiao Tung University, Hsinchu 30010, Taiwan; E-Mail: tateo@mail.nctu.edu.tw
* Author to whom correspondence should be addressed; E-Mail: tateo@mail.nctu.edu.tw;
Tel.: +886-3-571-2121 (ext. 54929); Fax: +886-3-571-6257.
External Editors: Gonzalo Pajares Martinsanz and Prasad S. Thenkabail
Received: 9 October 2014; in revised form: 8 December 2014 / Accepted: 15 December 2014 / Published: 17 December 2014
Abstract: Light Detection and Ranging (LiDAR) is an active sensor that can effectively
acquire a large number of three-dimensional (3-D) points. LiDAR systems can be equipped on different platforms for different applications, but to integrate the data, point cloud registration is needed to improve geometric consistency. The registration of airborne and terrestrial mobile LiDAR is a challenging task because the point densities and scanning directions differ. We proposed a scheme for the registration of airborne and terrestrial mobile LiDAR using the least squares 3-D surface registration technique to minimize the surfaces between two datasets. To analyze the effect of point density in registration, the simulation data simulated different conditions and estimated the theoretical errors. The test data were the point clouds of the airborne LiDAR system (ALS) and the mobile LiDAR system (MLS), which were acquired by Optech ALTM 3070 and Lynx, respectively. The resulting simulation analysis indicated that the accuracy of registration improved as the density increased. For the test dataset, the registration error of mobile LiDAR between different trajectories improved from 40 cm to 4 cm, and the registration error between ALS and MLS improved from 84 cm to 4 cm. These results indicate that the proposed methods can obtain 5 cm accuracy between ALS and MLS.
Keywords: LiDAR; point clouds; least squares surface matching; registration
1. Introduction
Light detection and ranging (LiDAR) systems are currently common tools to acquire three-dimensional (3-D) surface information. This technology integrates a laser scanner, a Global Positioning System (GPS), and an inertial navigation system (INS) and thus can effectively obtain 3-D surface models. Different platforms, such as aircraft and land-based vehicles can be equipped with LiDAR systems, which can be generally classified into two categories: airborne and terrestrial. Airborne LiDAR acquires data from the air to the ground to obtain the 3-D points on building rooftops and object surfaces, while terrestrial LiDAR usually acquires the 3-D points on building façades and object surfaces. Because terrestrial LiDAR cannot easily acquire 3-D points from building roofs, airborne LiDAR can be incorporated to provide building roof information. Hence, the integration of airborne LiDAR and terrestrial LiDAR is needed to form a complete dataset for 3-D buildings.
Point cloud registration is a procedure to eliminate the inconsistency between different point clouds acquired from different platforms. Point cloud data acquired by different platforms have different characteristics according to scanning distance, scanning rate, and scanning direction. For example, the scanning distance and beam divergence angle of airborne LiDAR is larger than ground-based LiDAR and, consequently, the point density of airborne LiDAR is lower than ground-based LiDAR. In addition, the scan direction of airborne LiDAR and mobile LiDAR are different, and the acquired 3-D points partially overlap on the object surface. Because the scanning range of airborne LiDAR is longer than ground-based LiDAR, the scanning area of airborne LiDAR is usually larger than ground-based LiDAR. Hence, the registration of airborne and mobile LiDAR is a challenging topic in data co-registration.
Data registration is a procedure to transform a dataset from its own coordinate system to another system. It can be classified into 2-D data and 3-D data registration. For example, image registration is the most common 2-D data registration, and 3-D point cloud registration is one of the 3-D data registrations. The 3-D data registration includes three types of control features: control point, control line, and control surface.
The control points represent a set of 3-D point features in different datasets. This feature is widely used in registration because the control point is the basic control feature. Iterative Closest Point (ICP) [1–4] is acquired through point features. The ICP algorithm selects the two closest points as a conjugate pair and then calculates the transformation parameters to minimize the mean square error iteratively until the distance between the point pair is less than the threshold. Rusinkiewicz and Levoy [5] analyzed the original ICP and improved the performance and precision; the new ICP can register more complex models. The registration precision indicates the geometrical difference between two systems. Barnea and Filin [6] transferred the 3-D point clouds to 2-D panoramic range images and extracted the registration key points to improve the computational time of conjugate points selection.
The second control feature, control line, is a linear feature consisting of a set of 3-D line features in different datasets. This type of line feature mainly occurs in man-made objects such as buildings. Linear features cannot be extracted directly from a LiDAR point cloud and are usually intersected by two planes. The reliable linear features can be used as control entities to calculate the transformation parameters. Habib et al. [7] used line features to register LiDAR point clouds and image data. For the image, the control lines were extracted manually; for the LiDAR point cloud, the line features were intersected by
two near planes. Jaw and Chuang [8] also proposed a line-based method to register terrestrial LiDAR point cloud scanned from different stations.
The third control feature, control surface, is suitable for LiDAR registration because the LiDAR systems provide an abundance of 3-D surface features. Rosenholm and Torlegard [9] used digital elevation models (DEM) as reference data in absolute orientation of the stereo model from stereopairs. Gruen and Akca [10] used least squares 3-D surface matching (LS3D) to minimize the 3-D distance between the reference data and model data. Akca [11] also used LS3D to register point clouds by their geometry and spectrum characteristics. This LS3D method has been applied to many applications, such as surface registration for land deformation [12].
Multi-strips or multi-stations LiDAR registration is a standard process before delivering LiDAR data [13]. LiDAR systems are available on several different platforms, such as airborne LiDAR systems (ALS), terrestrial static LiDAR systems, and terrestrial mobile LiDAR systems. In this study, the terrestrial LiDAR system (TLS) and mobile LiDAR system (MLS) refer to terrestrial static and mobile LiDAR systems, respectively. The registration of LiDAR data can be classified into four categories: registration of multi-strip ALS, registration of multi-station TLS, registration of multi-strip MLS, and registration of different platforms.
Multi-strip ALS not only enlarges acquisition areas but also improves the point density in the overlapped area. The registration of ALS includes two mathematics models: system-driven models and data-driven methods [14]. The system-driven approach considers the physical sensor model of ALS and usually requires the trajectories of ALS. In the contrast, the data-driven approach does not require physical orientation parameters; it minimizes the Euclidean distance and models the discrepancy between strips using actual LiDAR points. The geometric features of ALS registration can be a signalized target, control line, or control surface. To avoid the effect of irregular points caused by trees, one possibility is to use ground points to calculate the transformation coefficients. In addition, LiDAR intensity can be also be integrated in registration.
The registration of multi-stations TLS combines the partially scanned objects to obtain a complete scene. Because the platform of TLS is fixed during scanning, the point clouds of TLS are treated as a rigid body, and the 3-D similarity transformation model is usually adopted in the registration of TLS. The registration of TLS can be classified into two categories: Range-based registration and image-based registration. Similar to ALS, range-based registration uses 3-D points to extract geometric features, including signalized target and non-signalized natural targets. Signalized targets such as spherical targets are suitable for an area without man-made objects, and non-signalized natural targets such as control lines and control planes can be extracted from man-made objects. The image-based registration interpolates the 3-D points into a panorama image using the LiDAR intensity. The feature points can then be extracted for registration by image processing techniques such as Scale-Invariant Feature Transform (SIFT) and Speeded Up Robust Features (SURF).
The mobile terrestrial LiDAR systems collect and perform mapping from a moving vehicle on a road. The aim of MLS registration is to register the LiDAR points from different trajectories; therefore, to obtain larger street sections, MLS usually acquires data from direct and reverse lanes using a scanning mechanism similar to ALS. MLS uses an odometer, GPS, and INS to determine the position and orientation of LiDAR sensors for direct georeferencing; however, the GPS condition in urban corridors usually affects the positioning accuracy of MLS. To compare the contribution of GPS positioning error to
the overall accuracy between ALS and MLS, the scanning distance of MLS (range < 200 m) is shorter than ALS (range > 1000 m); consequently, the effect of GPS on MLS is much larger than on ALS systems.
Because ALS and TLS acquire data from different viewpoints, the integration of these systems is beneficial to obtain complete data for several applications. Several researchers have investigated possible ALS and TLS registration methods. In work by Böhm and Haala [15], who used ICP methods, TLS provided the geometric information of vertical walls while ALS provided the geometric information of roof-tops for city modelling. Gressin et al. [4] also applied ICP in multi-platform LiDAR registration and integrated different types of point features into the tie points selection, including point features for registration such as eigenvalues, eigenvectores, dimensionality features, and entropy from neighborhood points. Von Hansen et al. [16] extracted the linear features from the building boundaries and then applied control lines. Boulaassal et al. [17] extracted the 3-D vectors of buildings from ALS, TLS, and MLS separately and then registered all the extracted 3-D vectors by linear feature for a detailed 3-D building model; they combined the vector data rather than point clouds. Cheng et al. [18] extracted the 3-D building corners from the intersection of 3-D building boundaries from ALS and TLS and then applied the 3-D building corners. Wu et al. [19] combined the control lines and planes extracted from buildings for the registration of ALS and TLS.
Most previous studies focused on ALS and TLS registration; relatively few discussed the registration of ALS and MLS. The challenge of ALS and MLS registration is to obtain reliable control entities from these two different systems. Because ALS and MLS acquire an abundance of D surface points, the 3-D surface features such as road and wall surfaces can be utilized in ALS and MLS registration.
The airborne and terrestrial mobile LiDAR systems acquire data efficiently. The objective of this study was to co-register the point clouds acquired by airborne LiDAR and terrestrial mobile LiDAR and use these complementary data to improve the point coverage in urban areas. The point clouds scanned from two platforms can be located at difference coordinate systems, and the point clouds must first be registered to remove the error between the point cloud data from the two platforms. This study proposes a scheme to register airborne and terrestrial point clouds by surface features and discusses the effect between different point densities.
The terrestrial mobile data use an odometer, GPS, and INS to determine the position and orientation of LiDAR sensors for direct georeferencing; however, the GPS condition in urban corridors usually affects the positioning accuracy for terrestrial mobile LiDAR. Because the GPS condition of airborne LiDAR is better than mobile LiDAR, we assumed that the airborne LiDAR have been georeferenced to a world coordinate system. The terrestrial mobile LiDAR is then transformed to the coordinate system of airborne LiDAR to improve the accuracy of mobile LiDAR in urban corridors.
2. The Proposed Scheme
The framework consists of two major parts: (1) registration of multi-strips terrestrial mobile LiDAR data and (2) registration of airborne and terrestrial mobile LiDAR. First, we co-registered the multi-strips terrestrial LiDARs to enlarge the coverage of the dataset. The registered terrestrial LiDARs were then transformed to the ALS coordinate system. We used the least squares 3-D surface matching (LS3D) algorithm to minimize the Euclidean surface distance between the airborne and terrestrial mobile LiDAR point clouds. The registration features in this study are 3-D planes, and the applied transformation model
is a 3-D similarity transformation. The steps of LS3D are (1) extracting planar features; (2) matching criterion; (3) mathematical modeling; (4) solving transformation parameters; and (5) applying the parameters to the model data.
2.1. Planar Feature Extraction
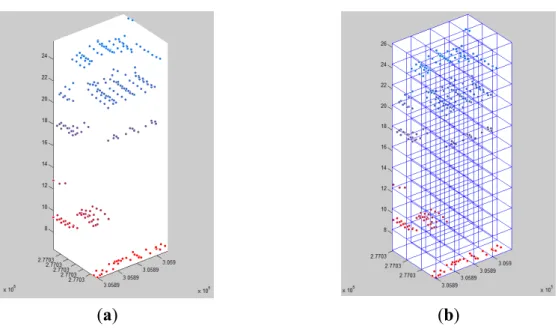
LiDAR point clouds are composed of a large number of irregular points. To improve the computational performance, the irregular points must be structuralized into organized points. In this study, we used a voxel structure to structuralize the airborne and terrestrial mobile LiDAR. The boundaries of the voxel structure were calculated from maximum and minimum values of all points, and the grid size depended on the point density. Both ALS and MLS used the same boundaries and grid size, and therefore we can search the corresponding points from two different systems effectively. After the data structuralization, all the points were indexed into a 3-D grid, and the points in a voxel were selected to calculate the planar feature (Figure 1).
Figure 1. An example of structured points: (a) irregular points, (b) voxel of points.
(a) (b)
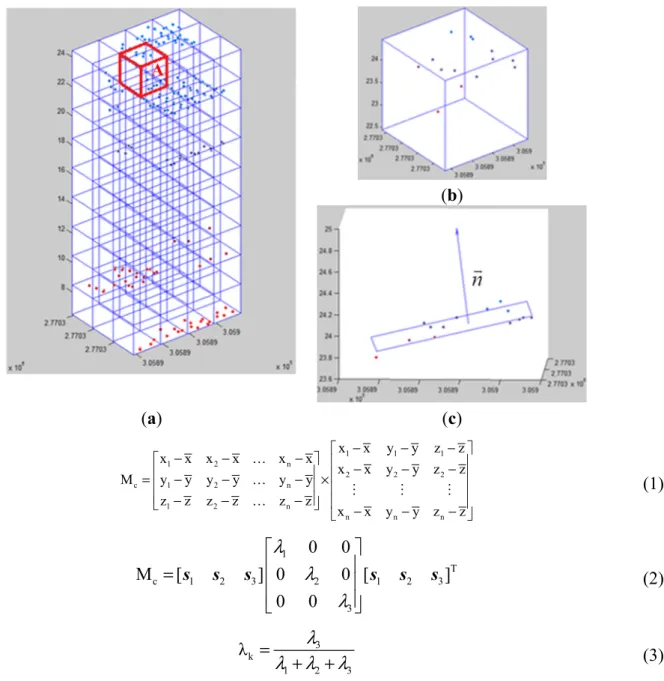
3-D planes were used as the control entity for registration; therefore, we used principal component analysis (PCA) [20,21] to analyze and calculate the plane features. The points inside each voxel are used for PCA calculation. The covariance matrix of points was calculated using Equation (1), in which (xi,yi,zi) represent the ith point in the voxel, and ( ̅, , ̅) are the mean of the points in a voxel. The eigenvalues (λ1 > λ2 > λ3) and eigenvectors (S1, S2, S3) of covariance matrix Mc can be extracted by Equation (2). When flatly distributed points are analyzed, the first and second eigenvalues are similar and the third eigenvalue is smaller than the other eigenvalues (λ1 ≈ λ2 > λ3). We defined λk by Equation (3) [22] to
extract the planar features. When λk is smaller than a predefined threshold, the points in the voxel can
be considered as a plane and the normal vector equal to the corresponding eigenvector. Otherwise, the points in a voxel are the less identifiable points (Figure 2). Figure 2 shows an example of normal vector extraction. Figure 2a shows a number of voxels after structuralization. We select a voxel from Figure 2a and show the points inside the voxel in Figure 2b. Figure 3b shows the extracted plane and corresponding normal vector.
Figure 2. Illustration of points to normal vectors: (a) voxels, (b) points in voxels A,
(c) normal vector of plane in voxel A.
(b) (a) (c) 1 1 1 1 2 n 2 2 2 c 1 2 n 1 2 n n n n x x y y z z x x x x x x x x y y z z M y y y y y y z z z z z z x x y y z z − − − − − … − − − − = − − … − × − − … − − − − (1) 1 T c 1 2 3 2 1 2 3 3 0 0 M [ ] 0 0 [ ] 0 0 λ λ λ = s s s s s s (2) 3 k 1 2 3 λ λ λ λ λ = + + (3)
To summarize the process of planar object extraction, the extraction of 3D surface features from irregular points include the following steps: (1) generating voxel structure for irregular points; (2) removing voxels that contain less than 5 LiDAR points; (3) calculating eigenvalues from points inside the voxels; and (4) extracting planar object based on parameter λk.The extracted planes could be
located on walls, roofs, and road surfaces in any direction. The control planes do not have to follow the same direction to obtain transformation coefficients; on the contrary, the air-to-ground LiDAR registration requires different plane directions to avoid singular problems. The plane equation for each voxel, Equation (4), is suitable to represent a plane in any directions. The plane coefficients are calculated from normal vector and mean points from Equation (5):
0
; ; x y z x y z A n B n C n D n x n y n z = = = = − − − (5)
where x, y, z are plane coordinates;( ̅, , ̅) aremean points of a plane; A, B, C, D are coefficients of a plane; and nx, ny, nz are normal vectors.
2.2. Matching Criterion
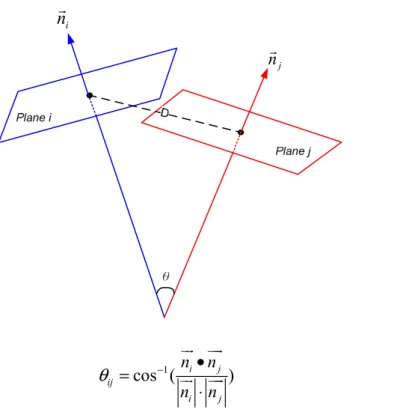
After planar feature extraction, we used the extracted planes to search the corresponding planes between the two LiDAR systems. The plane-matching criteria included distance and angle thresholds (Figure 3). If the Euclidean distance of mean points between ALS and MLS was smaller than the distance thresholds and the normal vectors between ALS and MLS had similar orientation, the planes from ALS and MLS were treated as a conjugate plane pair. All selected conjugate planes were used in 3-D surface minimization. The angle can be calculated using Equation (6).
Figure 3. Illustration of angle and distance criteria
1 cos ( i j ) ij i j n n n n θ = − • ⋅ (6)
where: ni is the normal vector of plane i; nj is the normal vector of plane j; and θij is the angle between normal vector ni and nj.
The conjugate planes selection from ALS and transformed MLS’s planes is based on these two criteria: (1) the distance of mean points between ALS and transformed MLS’s is smaller than the predefined distance threshold; and (2) the intersection angle of normal vectors between ALS and transformed MLS’s is smaller than the predefined angle threshold. After the determination of the unknown parameters, we update the transformed MLS’s plane by calculate the parameters and refine the automatic conjugate planes. The threshold selection is based on the data itself. In the first three iterations, we use large thresholds to handle the large differences between ALS and transformed MLS. After three
i
n
j
iterations, the thresholds are determined by standard deviation of distance and intersection angle between ALS’s plane and transformed MLS’s plane. Below shows the pseudo codes for selection of thresholds:
Pseudo Codes for Selection of Thresholds
1 while (iteration < 20) do
2 if iteration < 4 then
3 Threshold_distance = 1m;Threshold_angle = 15deg; 4 else
5 if std(distance) > 0.10m & std(angle) > 5deg then
6 Threshold_distance = 2 × std(distance);Threshold_angle=2 × std(angle); 7 else
8 Threshold_distance = 0.10m;Threshold_angle = 5deg; 9 end if
10 Find plane pair and calculate transformation parameters 11 while stopping criterion is satisfied do
12 exit loop
13 end while
14 Transform MLS’s plane using calculated parameters
15 Calculate the distance between ALS and transformed MLS’s planes
16 Calculate the intersection angle between ALS and transformed MLS’s planes 17 Iteration = iteration + 1
18 end while
2.3. Least Squares 3-D Surface Matching (LS3D)
The LS3D algorithm, developed by Gruen and Akca [10], minimizes the 3-D distance between surfaces, while the ICP algorithm minimizes the Euclidean distances between points. Compared to LS3D, ICP requires relatively higher iteration numbers [23] while LS3D quickly converges to an optimal solution. LS3D assumes that two surfaces are created from the same object by different processes. In this study, one surface acquired by ALS is called the template surface f(x, y, z), while the other surface from MLS is called the search surface g(x, y, z). If the error function e(x, y, z) is zero, these two surfaces should be the same, and all the surfaces in the template surface can correspond to the surfaces in the search surface, as represented by Equation (7).
In reality, the two surfaces are not equal. We used error function e(x, y, z) to describe the inconsistency between the two conjugate surfaces; hence, Equation (7) can be rewritten as Equation (8). To minimize the error function e(x, y, z), the coordinate system of the MLS (x0, y0 z0) was subjected to a general 3-D translation, scaling, and rotation transformation (the so called “3-D similarity transformation”) used to minimize the integrated squared error function between these two conjugate surfaces over a well-defined common spatial domain. The transformation parameters of similarity transformation included a translation vector (tx, ty, tz), three rotation angles (ω,φ,κ), and one scale factor (m) (see Equation (9)). The rotation angle is counterclockwise. The detail of rotation matrix can be found at [24].These
parameters were used to minimize the errors between these two conjugate surfaces. The aim of LS3D is to determine these 7 parameters using conjugate planes between ALS and MLS.
( , , ) ( , , ) f x y z =g x y z (7) ( , , ) ( , , ) ( , , ) f x y z −e x y z =g x y z (8) 11 0 12 0 13 0 21 0 22 0 23 0 31 0 32 0 33 0 ( ) ( ) ( ) x y z x t s r x r y r z y t s r x r y r z z t s r x r y r z = + + + = + + + = + + + (9) where f(x, y, z) and g(x, y, z) are the template and search surfaces; e(x, y, z) is error vector; (x, y, z) are the coordinate systems of ALS-derived surfaces; (x0, y0, z0) are the coordinate systems of MLS- derived surfaces; tx, ty, and tz are the three translation parameters along three axes; r11 ~ r33 are elements of the rotation matrix formed by three rotation angles ω, φ and κ around three axes; and s is the scale factor we assume is close to 1.
To perform least squares estimation, Equation (8) should be linearized by Taylor expansion, ignoring the higher-order terms, resulting in Equation (10). The template surfaces f(x, y, z) and search surfaces
g0(x, y, z) are planar surface patches, represented by Equations (11) and (12).
(
) (
)
(
)
(
)
(
)
(
)
(
)
0 0 0 0 0 , , , , , , , , , , , , , , x y z g x y z g x y z g x y z f x y z e x y z g x y z dx dy dz x y z g x y z g dx g dy g dz ∂ ∂ ∂ − = + + + ∂ ∂ ∂ + + = + (10)(
, ,)
f f f f f x y z =A x B y C z D+ + + (11)(
)
0 , , g g g g g x y z =A x B y C z D+ + + (12)where g0(x, y, z) is the initial approximation of search surfaces; gx, gy, gz are numeric first derivatives of g(x, y, z); dx, dy, dzare the differentiation terms; Af, Bf, Cf, Df are coefficients of a target plane; and Ag,Bg,Cg,Dg are coefficients of a search plane.
In the linearized Equation (10), elements dx, dy, and dz can be combined with 3-D similarity parameters in Equation (9). Equation (13) shows the differentiation terms of dx, dy, and dz. The numerical derivatives gx, gy, and gz can be derived from plane equations as Equation (14).
x 10 11 12 13 y 20 21 22 23 z 30 31 32 33 x dx dt ; y dy dt ; z dz dt i i i i i i dp a ds a d a d a d p dp a ds a d a d a d p dp a ds a d a d a d p ω φ κ ω φ κ ω φ κ ∂ = = + + + + ∂ ∂ = = + + + + ∂ ∂ = = + + + + ∂ (13) 2 2 2 ; 2 2 2 ; 2 2 2 g g g x y z g g g g g g g g g A B C g g g A B C A B C A B C = = = + + + + + + (14)
The final observation is Equation (15), which is derived from Equations (13) and (14). The least squares adjustment algorithm was applied to minimize the errors. We iteratively minimized the sum of squared errors between MLS and ALS surface using the LS3D approach. Because the observation equation is a nonlinear function, we measured three initial registration points between ALS and MLS to obtain initial approximations. The initial approximations were determinate by a noniterative approach [25], which is able to provide stable initial parameters because the manual registration points are less than four points. In Equation (15), the f(x, y, z) and g0(x, y, z) are ALS and MLS planes, respectively. The initial values of unknown parameters for Equation (15) are calculated by three initial registration points between ALS and MLS. We apply these initial parameters for converting MLS’s planes to ALS’s coordinate systems. Then, we use distance and angle thresholds to find a large number of conjugate planes between ALS and The transformed MLS’s planes. As the observation equations are larger than the unknown parameters, the parameters of Equation (15) are calculated by least squares adjustment through an iterative process [10]. A more in depth description of LS3D details regarding the parameter determinations can be found in [26].
(
)
(
)
(
)
(
)
(
)
(
)
(
)
x 10 20 30 11 21 31 12 22 32 13 23 33 0 e x, y, z g [ , , , , ] x y y z z x y z x y z x y z x y z dt g dt g dt g a g a g a dm g a g a g a d g a g a g a d g a g a g a d f x y z g x y z ω φ κ − = + + + + + + + + + + + + + + − − (15)2.4. Airborne and Terrestrial Mobile LiDARs Registration
In this study, the ALS data were transformed into a world coordinate system by differential GPS (DGPS) and strip adjustment [13]. When a GPS outage occurs in an urban corridor, the direct-georeferencing of MLS can only rely on the Inertial Measurement Unit (IMU) and speedometer; consequently, the MLS point clouds may contain systematic errors. The ALS data were therefore treated as reference data, and the MLS data were transformed into the coordinate system of ALS data.
MLS data usually include forward and reverse trajectories of a road and are used to obtain additional 3-D points to describe the road environment. There are two possibilities to co-register the forward MLS, reverse MLS and ALS. The first approach co-registers these multi-trajectory MLS data before the registration of ALS and MLS; the second approach performs the registration for forward and reverse MLS separately. Considering that the similarity between multi-trajectories is higher than the similarity between MLS and ALS, the first approach may derive more control features from multi-trajectories MLS for data registration. Furthermore, the registration of multi-trajectories may enlarge the MLS coverage for the registration of ALS and MLS. This study therefore adopted the first approach to co-register the multi-trajectory MLS using least square surfaces matching.
3. Experimental Results
The test data include airborne LiDAR and terrestrial mobile LiDAR data. The test area is about 190 m by 900 m. The airborne point cloud data were scanned by Optech ALTM30/70 using 7 flightlines. The total number of points is 2,774,371, and the average point density is about 15 points/m2. The terrestrial
mobile LiDAR was scanned by Optech Lynx, and the length of the road is about 900 m. The MLS data include the two different trajectories, left-to-right and right-to-left. The total number of points is about 79,170,000, and the average point spacing in the horizontal plane is about 5 cm. Figure 4 shows the ALS
digital surface model (DSM), MLS DSM, and reference orthophoto of test area. Only the overlapped are used in registration. Figure 5 compares the profiles of ALS and MLS in the test area. The buildings beside the road and trees along streets in the urban corridor cause GPS signal occlusion, which significantly degrades the navigation performance; therefore, the MLS data need post-processing (i.e., point registration) to obtain precise locations. The parameters used are listed in Table 1.
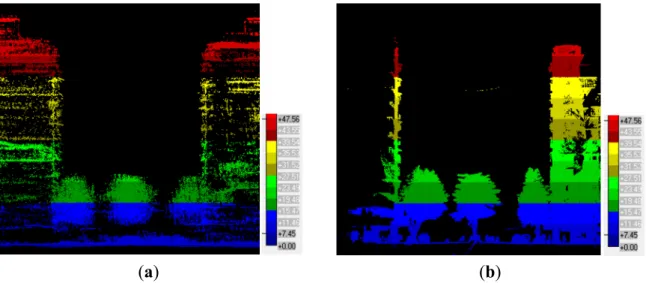
Figure 4. Test data: (a) ALS colored by elevation, (b) MLS colored by elevation,
(c) reference orthophoto.
(a)
(b)
(c)
Figure 5. Profiles of ALS and corrected MLS data: (a) profile of ALS colored by elevation,
(b) profile of MLS colored by elevation.
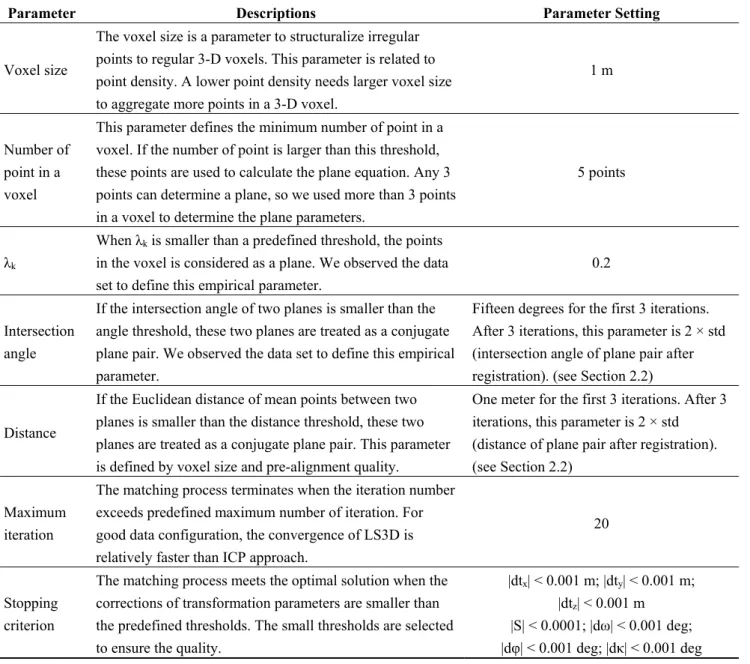
Table 1. The parameters setting and descriptions.
Parameter Descriptions Parameter Setting
Voxel size
The voxel size is a parameter to structuralize irregular points to regular 3-D voxels. This parameter is related to point density. A lower point density needs larger voxel size to aggregate more points in a 3-D voxel.
1 m
Number of point in a voxel
This parameter defines the minimum number of point in a voxel. If the number of point is larger than this threshold, these points are used to calculate the plane equation. Any 3 points can determine a plane, so we used more than 3 points in a voxel to determine the plane parameters.
5 points
λk
When λk is smaller than a predefined threshold, the points
in the voxel is considered as a plane. We observed the data set to define this empirical parameter.
0.2
Intersection angle
If the intersection angle of two planes is smaller than the angle threshold, these two planes are treated as a conjugate plane pair. We observed the data set to define this empirical parameter.
Fifteen degrees for the first 3 iterations. After 3 iterations, this parameter is 2 × std (intersection angle of plane pair after registration). (see Section 2.2)
Distance
If the Euclidean distance of mean points between two planes is smaller than the distance threshold, these two planes are treated as a conjugate plane pair. This parameter is defined by voxel size and pre-alignment quality.
One meter for the first 3 iterations. After 3 iterations, this parameter is 2 × std (distance of plane pair after registration). (see Section 2.2)
Maximum iteration
The matching process terminates when the iteration number exceeds predefined maximum number of iteration. For good data configuration, the convergence of LS3D is relatively faster than ICP approach.
20
Stopping criterion
The matching process meets the optimal solution when the corrections of transformation parameters are smaller than the predefined thresholds. The small thresholds are selected to ensure the quality.
|dtx| < 0.001 m; |dty| < 0.001 m;
|dtz| < 0.001 m
|S| < 0.0001; |dω| < 0.001 deg; |dφ| < 0.001 deg; |dκ| < 0.001 deg The experiments in this study used both simulation and real data to analyze the performance of point registration. The validation experiments were carried out in three parts. First, the 3-D points with different point densities and standard errors were simulated; second, the relative accuracy between forward and reverse of MLS data was examined; and third, the errors between MLS and ALS from the proposed methods were checked.
3.1. Simulation Data Registration
First, we used a simulation dataset to verify the precision of registration at different densities. The registration precision indicates the geometrical difference between two systems. In this experiment, the point-density ratio indicated the ratio between target points and search points and was used to simulate different point densities between LiDAR system 1 and system 2. We simulated 3-D points distributed on a prismatic building model shaped like a 50 m × 50 m × 50 m box. The point densities of simulated system 1 were 100, 90, 80, 70, 60, 50, 40, 30, 20, 10 points/m2, while the point density of simulated
system 2 was 100 points/m2; therefore, the point-density ratios were 1/1, 1/2, 1/3, 1/4, 1/5, 1/6, 1/7, 1/8,
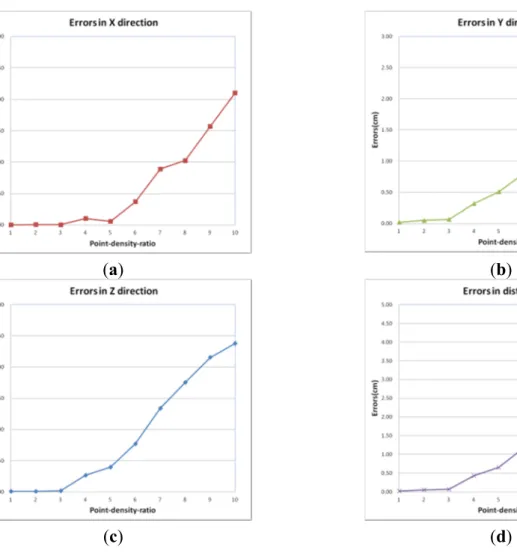
1/9, 1/10. The noise levels (random error) of simulated point were 0.10 m and 0.05 m for system 1 and 2, respectively. The 3-D transformation parameters were predefined using the maximum transformation parameters (tx, ty, tz, omega, phi, kappa) in Table 1. One hundred data sets are simulated for each point-density ratio. After the data simulation, we used LS3D to solve the transformation parameters and applied the parameters to the simulated system 2 data. Every transformed point can be compared with the original point. We used the differences along X, Y, and Z axes as a precision index (Figure 6). The simulation results indicate that accuracy of registration improved as the density increased. The distance error may preserve 5 cm precision when the point-density ratio is reduced to 1/10.
Figure 6. Simulation results: (a) Position difference along X-axis. (b) Position difference
along Y-axis. (c) Position difference along Z-axis. (d) Distance between transformed point and original point.
(a) (b)
(c) (d)
3.2. Terrestrial Mobile LiDARs Registration
Because the points of MLS number about 79 million, we reduced the points to accelerate the computation by using a 1 m 2D grid to remove the nonoverlapped points. We apply initial translation (tx, ty, tz) in point reduction. It can avoid large difference between ALS and MLS. Besides, we use 2D grid to accelerate the process of point reduction. In other words, all the MLS points are projected to 2D horizontal plane and elevation is not considered in this stage. If the points from both trajectories appeared
in same cell, then that cell was marked as an overlapped cell and all the points in this overlapped cell were preserved for registration. The grid size was estimated by the inconsistency of points from two different trajectories. The smaller grid size may remove the overlapped points incorrectly due to the problem of direct georeferencing. After the nonoverlapped point reduction, the number of points was reduced to 44 million, and the compression rate was about 44%.
To obtain high point density in urban environments in this study, the maximum vehicle speed of MLS was <60 km/hr, and arbitrary lane-changing was not allowed, resulting in a continuous and smooth driving path. Considering the road length and data volume, we split the data into several road segments. In addition, the error behaviors for certain road segments were considered to be systematic errors, and a 3-D similarity transformation was considered to compensate the geometric inconsistency between two road segments. The length of the road section was 25 m, with a 3 m overlap. Each trajectory had 36 segments, and the total number of road segments was 72 in this stage. We used the forward trajectory (from left to right) as reference data. The registration coefficients converted the points from reverse trajectory to reference data. Because the LS3D algorithm requires initial transformation parameters, we manually measured three registration points in the first segment and calculated the initial transformation parameters. The precise registration transformation parameters were then determined by LS3D algorithm. We assumed that the actual road path was continuous and smooth; hence, the initial parameters for the next road segment could be obtained from the previous road segment, and therefore only three registration points were needed to begin the TLS data registration.
The accuracy assessments in this section include three parts: analysis of derived transformation parameters, point distance between road marks from two trajectories, and visualization of MLS data before and after registration.
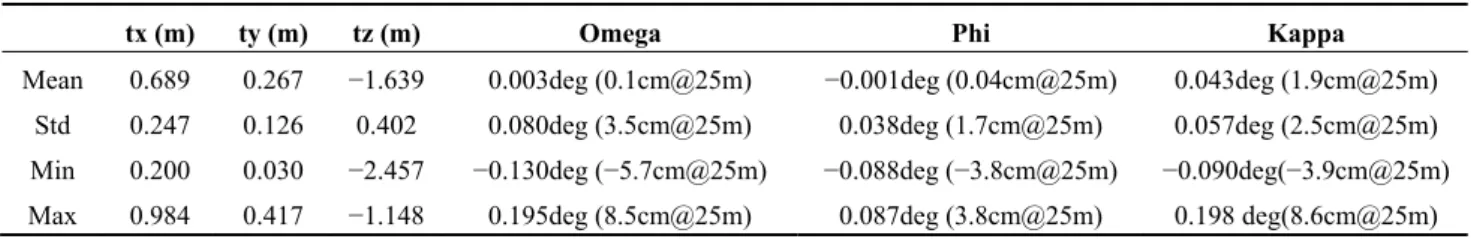
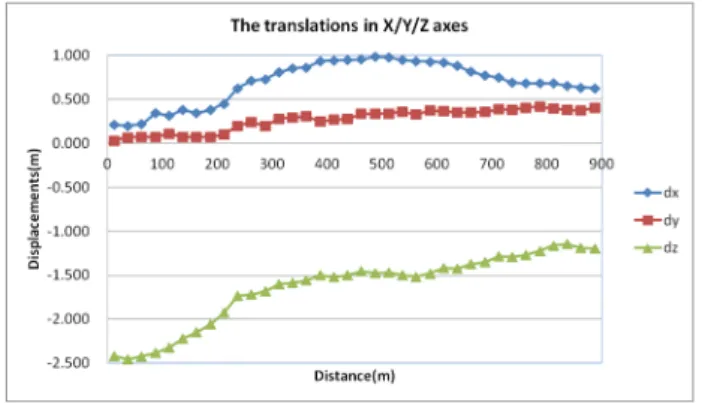
For these road segments, we calculated 36 sets of transformation parameters (Table 2). The scale coefficient is very close to 1. It is ranged from 0.9998 to 1.0004. To compare the translation and rotation parameters, the standard deviation of translation parameters (i.e., 12.6 cm to 40.2 cm) was much larger than rotation angles (i.e., 1.7 cm to 3.5 cm). In addition, the error in vertical direction was also larger than horizontal direction. The error in vertical direction was larger than 1 m when the GPS solution was not available, similar to error behavior in an urban corridor [27]. In other words, the rotation angles were more consistent than the translation parameters. This phenomenon is referred to as the positioning errors of GPS outage. Figure 7 plots the translation parameters at different road sections and indicates the continuity of translation parameters trajectories.
Table 2. The summary of transformation parameters for MLS/MLS registration.
tx (m) ty (m) tz (m) Omega Phi Kappa
Mean 0.689 0.267 −1.639 0.003deg (0.1cm@25m) −0.001deg (0.04cm@25m) 0.043deg (1.9cm@25m)
Std 0.247 0.126 0.402 0.080deg (3.5cm@25m) 0.038deg (1.7cm@25m) 0.057deg (2.5cm@25m)
Min 0.200 0.030 −2.457 −0.130deg (−5.7cm@25m) −0.088deg (−3.8cm@25m) −0.090deg(−3.9cm@25m)
Figure 7. The translations in X/Y/Z directions (MLS/MLS registration).
To evaluate the accuracy of registration, we manually measured 36 well-defined points to compare the point distance before and after registration. Because the point spacing of MLS is about 5 cm, we could identify the corner point of the road marks from the LiDAR intensity. We use lines intersection to determine the corner of road mark. Figure 8 is an example of a check-point located on a marked pedestrian “zebra” crossing. The total number of independent check-points (CP) is 36. The error vectors of check point before and after registration are shown as Figure 9.
Figure 8. Illustration of independent check-point between trajectories: (a) check point in
reference strip, (b) check point in registered strip.
(a) (b)
Table 3. shows the results of check points before and after registration. The mean errors before registration ranged from −1.634 m to 0.719 m. The mean error in vertical direction is larger than
horizontal directions. After the registration, the mean errors were significantly reduced to 0.002 m to 0.025 m. The standard deviations of check point before registration ranged from 0.114 m to 0.401 m and fell to <5 cm after registration.
Table 3. Statistics of the independent check points.
Max (m) Min (m) Mean (m) Std (m) dY Before 1.017 0.295 0.719 0.228 After 0.042 0.000 0.025 0.043 dX Before 0.460 0.073 0.293 0.114 After 0.056 0.003 0.024 0.043 dZ Before 2.469 1.159 -1.634 0.401 After 0.069 0.000 0.002 0.028
After the numerical analysis, we also selected some profiles to visually compare MLS before and after registration. Figure 10 shows three profiles of the road point cloud before and after registration. The width of the profile is 1.5 m, and the different colors indicate points from different trajectories. In the figure, the discrepancy was removed after registration.
Figure 10. Profiles of MLS before and after registration: (a) profile A, (b) profile B,
(c) profile C.
Before
After
(a) (b) (c)
3.3. Airborne LiDAR and Terrestrial Mobile LiDAR Registration
Once the MLS data from different trajectories were well co-registered, we performed the LS3D registration for ALS and MLS data. The spacing of voxel for ALS and MLS was 1 m. The total number
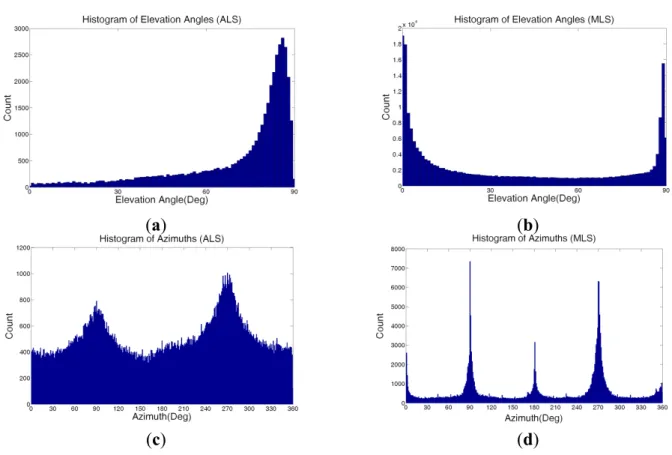
of points should be more than 5 points for normal angle calculation; the number of voxel for ALS and MLS were 40,907 and 218,212 respectively. The registration features included surfaces of roads, walls, and other objects. We use elevation and azimuth angles to discuss the distribution of normal vector. The elevation angle is a vertical angle from horizontal plane to normal vector; the azimuth angle is a horizontal angle from north to horizontal projected normal vector. Elevation and azimuth angles of normal vectors (Figure 11) show that the elevation angles of the road and roof points were mostly close to 90 degrees, while the elevation angles of the walls were mostly close 0 degrees. The number of normal vectors from the road and roofs were larger than the normal vectors from walls (Figure 11a), and the total number of elevation angles <10 degrees was 768 (about 2%). These are important control elements for registration. The MLS contain more normal vectors from roads and walls (Figure 11b), and the azimuths of the normal vectors are distributed on different directions (Figure 11c,d). Therefore, the controlling capability of control surfaces is well-distributed to cover all directions.
Figure 11. Histogram of elevation and azimuth angles: (a) elevation angles of ALS, (b) elevation angles of MLS, (c) azimuth angles of ALS, (d) azimuth angles of MLS.
(a) (b)
(c) (d)
The statistics of transformation parameters for ALS/MLS registration is shown as Table 4. The mean errors in translation parameters were ranged from −0.885m to −0.220m. It was larger than the rotation parameters. It means the errors were mostly conducted by GPS positioning error. The standard deviation of translation parameters (3.6 cm to 9 cm) was also larger than rotation angles (i.e., 0.75~3.5 cm). Figure 12 shows the translation at different distances.
Figure 12. The translations in X/Y/Z directions (ALS/MLS registration).
Table 4. The summary of transformation parameters for ALS/MLS registration.
tx (m) ty (m) tz (m) Omega Phi Kappa
Mean −0.333 −0.220 −0.885 0.001 deg (0.1cm@25m) −0.008 deg (0.4cm@25m) 0.011 deg (0.5cm@25m)
Std 0.076 0.036 0.088 0.016 deg (0.75cm@25m) 0.025 deg (1.1cm@25m) 0.080 deg (3.5cm@25m)
Min −0.480 −0.328 −0.980 −0.041 deg (−1.8cm@25m) −0.038 deg (−1.6cm@25m) −0.154 deg (−6.7cm@25m)
Max −0.199 −0.156 −0.667 0.0335 deg (1.4cm@25m) 0.077 deg (3.3cm@25m) 0.218 deg (9.5cm@25m)
The accuracy assessments included two parts: plane distance between surfaces from ALS and MLS, and visualization of ALS and MLS data before and after registration. Because measuring check-points between ALS and MLS is difficult, we used the check plane in the accuracy assessment of ALS and MLS registration. We manually selected the 74 conjugate planes from ALS and MLS; a least squares plane fitting was then applied to estimate the optimal plane equation. The perpendicular distance between two planes was calculated as the quality index of ALS and MLS registration (Table 5). The data registration improved the mean error datum of ALS and MLS. In addition, the precision of registration was improved from 0.847 m between ALS and MLS from −0.979 m to −0.02 m. The mean error was mainly caused by the GPS/IMU signals and different to 0.033 m. A comparison of the error vectors of perpendicular distance between plane before and after registration shows that the systematic error was compensated by LS3D after registration (Figure 13). Hence, the LS3D was able to automatically improve the consistency between ALS and MLS.
Table. 5. The statistic of the check planes.
Before Registration After Registration
Mean (m) −0.979 −0.020
Std (m) 0.847 0.033
Max (m) 0.929 0.068
Min (m) 0.581 −0.045
Because the conjugate planes were mostly located on road surfaces, we selected some profiles to evaluate the continuity of walls. Three profiles of the road point cloud before and after registration (Figure 14) show that the width of the profile is 1.5 m, and different colors indicate points from ALS and MLS. The discrepancy was removed after registration, indicating that the continuity between the building roof and wall was improved after registration.
Figure 14. The profiles of the airborne LiDAR and terrestrial mobile LiDAR point cloud:
(a) profile A, (b) profile B, (c) profile C.
Before
After
(a) (b) (c)
Figure 15. The results of ALS and MLS registration: (a) ALS only (colored by height),
(b) registration of ALS and MLS (colored by height).
The perspective view of registration results (Figure 15a,b) shows that the proposed method worked well for the registration of ALS and MLS. In addition, the combination of ALS and MLS may provide a more complete scene in urban environments. For example, the MLS may improve the wall features for ALS.
4. Conclusions
This study proposed a scheme to co-register the 3-D point clouds scanned from airborne and terrestrial vehicle platforms to increase the details of urban scenes. In addition, the data co-registration georeferences the uncorrected points from MLS to world coordinates of ALS. The proposed method utilized least squares 3-D surface matching to minimize the surfaces between different systems. The conjugate surfaces were established by computing the angle and the distance between features and can be treated as a control entity to minimum the surface distance between two systems. The registrations include two major parts: (1) registration between multi-trajectories MLS, and (2) registration of ALS and MLS. The experimental results indicated that the proposed method may improve the geometric consistency between ALS and MLS. Under conditions of poor GPS reception for MLS, the maximum error between trajectories was improved from 1.6 m to 0.02 m, and the standard errors also improved from 0.4 m to 0.05 m. We used the ALS data as reference data, and the MLS data were transformed into the coordinate system of ALS data. The geometric consistency between MLT and TLS may reach 0.05 m. This model can be applied to point cloud registration from different platforms. Notices that the preconditions of the proposed method are: (1) the coordinate system of ALS and MLS is similar and the change between these two systems is relatively low. (2) the proposed scheme needs control planes in different directions to improve the controlling capability. Both horizontal and vertical planes are needed for the proposed methods. In this study, the initial parameters for least squares matching were calculated from the manual measured tie points. The further improvement of this study will be the automatic tie point selection. Besides, we use equal-grid voxels to obtain planar feature, however, the grid size is an important issue in planar feature extraction. The future work will adopt optimal neighborhood radius selection [28] in planar feature extraction.
Acknowledgements
The authors gratefully acknowledge the financial support provided by the Ministry of Science and Technology of Taiwan (NSC 101-2628-E-009-019-MY3). The authors would also like to thank the Taipei City Government and Taiwan Instrument Co., Ltd. Taiwan for providing the test data.
Author Contributions
Tee-Ann Teo provided the overall conception of this research, designs the methodologies and experiments, and wrote the majority of the manuscript; Shih-Han Huang contributed to the implementation of proposed algorithms, conducts the experiments and performs the data analyses.
Conflicts of Interest
Reference
1. Besl, P.J.; McKay, N.D. A method for registration of 3-D shape. Proc. SPIE 1992, 1611, 239–256. 2. Yang, C.; Medioni, G. Object modelling by registration of multiple range images. Image Vision
Comput. 1992, 10, 145–155.
3. Zhang, Z. Iterative point matching for registration of free-form curves. Int. J. Comput. Vision 1992,
13, 119–152.
4. Gressin, A.; Mallet, C.; David, N. Improving 3D LiDAR Point Cloud Registration Using Optimal Neighborhood Knowledge. Available online: http://www.isprs-ann-photogramm-remote-sens-spatial-inf-sci.net/I-3/111/2012/isprsannals-I-3-111-2012.pdf (accessed on 9 October 2014). 5. Rusinkiewicz, S.; Levoy, M. Efficient variants of the ICP algorithm. In Proceedings of 3-D Digital
Imaging and Modeling, Quebec City, Canada, 28 May–1 June 2001; pp. 145–152.
6. Barnea, S.; Filin, S. Keypoint based autonomous registration of terrestrial laser point-clouds. ISPRS
J. Photogramm. Remote Sens. 2008, 63, 19–35.
7. Habib, A.; Ghanma, M.; Morgan, M.; Al-Ruzouq, R. Photogrammetric and LiDAR data registration using linear features. Photogramm. Eng. Remote Sens. 2005, 71, 699–707.
8. Jaw, J.J.; Chuang, T.Y. Registration of ground‐based LiDAR point clouds by means of 3D line features. J. Chin. Inst. Eng. 2008, 31, 1031–1045.
9. Rosenholm, D.; Torlegard, K. Three-dimensional absolute orientation of stereo models using digital elevation models. Photogramm. Eng. Remote Sens. 1988, 54, 1385–1389.
10. Gruen, A.; Akca, D. Least squares 3D surface and curve matching. ISPRS J. Photogramm. Remote Sens.
2005, 59, 151–174.
11. Akca, D. Matching of 3D surfaces and their intensities. ISPRS J. Photogramm. Remote Sens. 2007,
62, 112–121.
12. Monserrat, O.; Crosetto, M. Deformation measurement using terrestrial laser scanning data and least squares 3D surface matching. ISPRS J. Photogramm. Remote Sens. 2008, 63, 142–154.
13. USGS LiDAR Guidelines and Base Specification. Available online: http://lidar.cr.usgs. gov/USG-SNGP%20Lidar%20Guidelines%20and%20Base%20Specification%20v13 (ILMF).pdf (accessed on 7 September 2014).
14. Habib, A.F.; Kersting, A.P.; Bang, K.I.; Zhai, R.; Al-Durgham, M. A strip adjustment procedure to mitigate the impact of inaccurate mounting parameters in parallel LiDAR strips. Photogramm. Rec.
2009, 24, 171–195.
15. Böhm, J.; Haala, N. Efficient integration of aerial and terrestrial laser data for virtual city modeling using LASERMAPs. In Proceedings of ISPRS Workshop Laser Scanning 2005, Enschede, The Netherlands, 12–14 September 2005.
16. Von Hansen, W.; Gross, H.; Thoennessen, U. Line-Based Registration of Terrestrial and Airborne LiDAR Data. Available online: http://www.isprs.org/proceedings/XXXVII/congress/3_pdf/24.pdf (accessed on 9 October 2014).
17. Boulaassal, H.; Landes, T.; Grussenmeyer, P. Reconstruction of 3D Vector Models of Buildings by Combination of ALS, TLS and VLS data. Available online: http://www.int-arch-photogramm- remote-sens-spatial-inf-sci.net/XXXVIII-5-W16/239/2011/isprsarchives-XXXVIII-5-W16-239-2011.pdf (accessed on 9 October 2014).
18. Cheng, L.; Tong, L.; Li, M.; Liu, Y. Semi-automatic registration of airborne and terrestrial laser scanning data using building corner matching with boundaries as reliability check. Remote Sens.
2013, 5, 6260–6283.
19. Wu, H.; Marco, S.; Li, H.; Li, N.; Lu, M.; Liu, C. Feature-constrained registration of building point clouds acquired by terrestrial and airborne laser scanners. J. Appl. Remote Sens. 2014, 8, doi:10.1117/1.JRS.8.083587.
20. Pauly, M.; Gross, M.; Kobbelt, L.P. Efficient Simplification of Point-Sampled Surfaces. Available online: http://www-i8.informatik.rwth-aachen.de/publication/122/p_Pau021.pdf (accessed on 9 October 2014).
21. Lagüela, S.; Armesto, J.; Arias, P.; Zakhor, A. Automatic Procedure for the Registration of Thermographic Images with Point Clouds. Available online: http://www-video.eecs.berkeley.edu/ papers/slaguela/isprsarchives-XXXIX-B5-211-2012_published.pdf (accessed on 9 October 2014). 22. Pauly, M.; Gross, M.; Kobbelt, L.P. Efficient Simplification of Point-Sampled Surfaces. Available
online: https://dl.acm.org/purchase.cfm?id=602123&CFID=463596832&CFTOKEN=12462253 (accessed on 9 October 2014).
23. Pottmann, H.; Leopoldseder, S.; Hofer, M. Registration without ICP. Comput. Vision Image Und.
2004, 95, 54–71.
24. Ghilani, C.D. Adjustment Computations: Spatial Data Analysis, 5th ed.; John Wiley & Sons: New Jersey, NJ, USA, 2010.
25. Han, J.Y. A Noniterative Approach for the quick alignment of multistation unregistered LiDAR point clouds. IEEE Geosci. Remote Sens. Lett. 2010, 7, 727–730.
26. Akca, D. Least Squares 3D Surface Matching; ETH Zurich: Zürich, Switzerland, 2007.
27. Han, J.Y.; Chen, C.S.; Lo, C.T. Time-variant registration of point clouds acquired by a mobile mapping system. IEEE Geosci. Remote Sens. Lett. 2014, 11, 196–199.
28. Demantké, J.; Mallet, C.; David, N.; Vallet, B. Dimensionality based Scale Selection in 3D LiDAR Point Cloud. Availablie online: http://www.int-arch-photogramm-remote-sens-spatial-inf-sci.net/ XXXVIII-5-W12/97/2011/isprsarchives-XXXVIII-5-W12-97-2011.pdf (accessed on 9 October 2014). © 2014 by the authors; licensee MDPI, Basel, Switzerland. This article is an open access article distributed under the terms and conditions of the Creative Commons Attribution license (http://creativecommons.org/licenses/by/4.0/).