Tao, Y.-H., Lee, J. and Liu, S.-C., Testing the IS Problem-DiagnosisFramework viaTaiwan’sGovernment Electronic Procurement System, International Conference of Business and Economics Society, French Riviera
-Antibes, France July 16-20, 2007
Testing the IS Problem-Diagnosis Framework via Ta
i
wan’
s
Gove
r
nme
nt
El
e
c
t
r
oni
c
Procurement System
Yu-Hui Tao
National University of Kaohsiung
700 Kaohsiung University Road, Nan-Tzu District 833, Kaohsiung County, Taiwan, R.O.C ytao@nuk.edu.tw
Phone: 886-7-5919220, Fax: 886-7-5919328
Josephine Lee, Shu-Chu Liu
National Pingtung University of Science and Technology 1, Shueh-Fu Road, Nei-Pu Hsiang, Pingtung County 91201, Taiwan, R.O.C.
sephany@ms5.hinet.net, scliu@mail.npust.edu.tw Phone: 886-8-770320, Fax: 886-8-7740367
ABSTRACT
According to the claim of an Enterprise Resources Planning (ERP) problem-diagnosis framework, a timely problem diagnosis may change the implementation of an ERP from what the Standish Group called an “impaired”result to a “challenged”or even a “successful”one. This study further infers that this ERP problem-diagnosis framework would be applicable to general information systems (IS) based on its generalized concepts and embedded IS models. Taiwan’s government electronic procurement system (GEPS) has been encountering achievement-rate problems since its implementation period. Taiwan’s GEPS became an ideal candidate for applying this sophisticated problem-diagnosis framework because it was still evolving in its prolonged implementation cycle during the period of this study, and it involved policy makers, the buyer-side users in central and local government units, and the selling-side users of suppliers. This study designed and conducted a complete experiment to detect the problems as well as to empirically test the capability of this problem-diagnosis framework through Taiwan’sGEPS implementation. Results are also presented along with the descriptions of the experiment design and discussions.
INTRODUCTION
An investment on information system (IS) in business organizations is generally high and risky, such that it easily results into an unsatisfactory return or even a financial crisis. Higher failure rates appear in popular ISs, such as enterprise resource planning (ERP) (Hong and Kim, 2002), data warehouse systems (Wixom and Watson, 2002), customer relationship management (Payton and Zahay, 2003), and supply chain management systems (Elmuti, 2002). Despite these high-failure rates, the literature still lacks an integrated methodology with strong theoretical evidence to guide the IS problem-diagnosis practice. Tao et al. (2005) recently proposed an ERP problem-diagnosis framework which meets our expectation of guiding the problem diagnosis during the implementation period. This study further believes that this framework can be applied to general IS without changes. Nevertheless, this framework has yet to be empirically tested for its feasibility and validity.
According to Taiwan’s Public Construction Committee (PCC) of the Executive Yuan, the achievement rates of its government electronic procurement system (GEPS) were lower than what was expected. In particular, the rates of tender submitting and opening were not only extremely low, but the gaps between their expected and actual rates were also statistically significant. Recently, the management of achievement rates was cancelled by the PCC in 2005 due to the so-called “uncontrollable external factors”(PCC, 2006). Nevertheless, the call-in problem statistics summarized by GEPS customer service indicated that the top five issues were related to the tender document process, download problems, upload problems, electronic paper and tender document reading, and electronic certificate. Other issues such as training, payment, and result inquiries were also very common (ChungHwa Telecom, 2006). The evidence did not lead to any external factors at all.
To our understanding, the reason why PCC could not identify and resolve the achievement-rate problems is mainly due to the complexity of GEPS usage, which can be summarized from three perspectives. First, it is a virtual-organization scenario with the policy maker PCC, a huge number of users scattered around the central and local governments, and suppliers of all kinds from all over Taiwan. Second, because the GEPS implementation began in 2002, many government units and suppliers have been using GEPS for years while many others have not even adopted it. Third, even though PCC has been promoting GEPS over the years and has been providing free training courses and telephone customer service, obstacles still exist and keep many users from both the buyer and seller sides from adopting it, particularly in submitting and opening the tenders. Thus, the complexity of GEPS makes it an ideal candidate for applying the IS problem-diagnosis framework.
The objective of this GEPS system was to provide an equal, transparent, and efficient environment for governmental transactions that may not be easily executed or monitored in a manual processing approach. The consequence of this ill-adopted GEPS system would have an impact on Taiwan’s fair business environment, organizational cultural, transaction efficiency, and most importantly, governmental credibility and image. As a result, the main objective of this research is to design and conduct a full-scale problem-diagnosis experiment based on Tao etal.’sframework,such that the real causes of the GEPS implementation may be identified and the IS problem-diagnosis framework can be empirically tested. The organization of the remaining paper is as follows: The Framework section briefly introduces the IS problem-diagnosis framework, followed by the design of this problem-diagnosis process in the Research Methods section. In the Data Analysis section, the data are presented with corresponding analyses. Discussion and implications regarding both the GEPS problems and the framework are presented in the Discussion and Implications section.
THE FRAMEWORK
The IS problem-diagnosis framework (Tao et al., 2005) consists of a static model that integrates multiple IS models and a dynamic process that contains correspondent methods for applying these models in the static process. Because the IS theories are model-based and the industrial practices are mainly process-oriented, only by combining both the static model and the dynamic process can the overall problem-diagnosis framework be considered comprehensive. Since the Unified Theory of Acceptance and Use of Technology (UTAUT), IS success model, and Technological Frame (TF) are important IS models utilized in this framework, they are also briefly introduced in this section based on Tao et al.’s (2005) analyses.
The Static Model
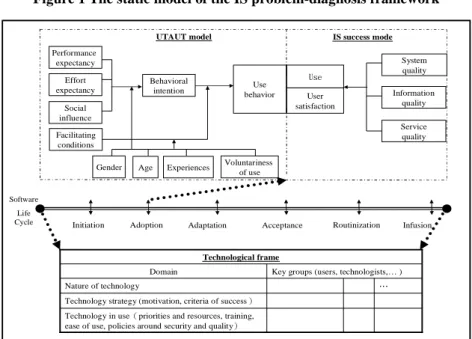
The static model is shown in Figure 1. Six stages of the life cycle proposed by Rajagopal (2002), namely, initiation, adoption, adaptation, acceptance, routinization, and fusion, are used as the timeline because the last two stages represent the behavior after the adoption (Somers and Nelsons, 2004), which meets the profile of a typical IS problem diagnosis. The life cycle, as seen in the middle of Figure 1, is the core integrating the UTAUT model and the IS success model, which covers the life cycle before and after the adoption point, as well as the TF model that covers the whole life cycle alone. This static model contains two-cycle models that are independent from each other but can be used together to reduce the risk of not being able to identify the causes of the IS problem.
Figure 1 The static model of the IS problem-diagnosis framework
UTAUT model
Technological frame
Technology in use(priorities and resources, training, ease of use, policies around security and quality) Technology strategy (motivation, criteria of success)
… Nature of technology
Key groups (users, technologists,… ) Domain IS success mode System quality Information quality Service quality User satisfaction Use Behavioral intention Performance expectancy Effort expectancy Social influence
Gender Age Experiences Voluntariness of use Facilitating
conditions
Use behavior
Initiation Adoption Adaptation Acceptance Routinization Infusion
Software Life Cycle
The reason why the UTAUT and IS success model were used in a cycle together is because the UTAUT is an extended technology acceptance model (TAM) with the highest explaining power at a prior-adoption stage. For its part, the IS success model includes the service quality as well as the traditional information and system quality factors at the post-adoption stage. For the stand-alone TF, it is not only closed to the practical problem-diagnosis mechanism, but is also flexible in its content and structure. This makes it highly complementary to the equivalent counterpart cycle containing the UTAUT and IS success model.
The Dynamic Process
The IS problem-diagnosis process model consists of three fundamental constructs that can be flexibly combined for the target problem:
Construct I: Secondary data collection, including publicly available or internal business data sources. These can be documents, manuals, report, programs, records, files, and any IS-related references or messages. This secondary data can be used in a qualitative or quantitative content analysis, or in other means for providing some initial propositions or hypotheses of the problems.
Construct II: The UTAUT model together with the IS success model cover the entire life cycle before and after the cutoff point of adoption. Both are likewise associated with a validated measurement of questionnaire items. They can be used in an initial but quick exploration of the problem detection, or in the final stage of problem diagnosis to confirm the validity of the potential problems discovered by the TF model.
Construct III: TF can be used to identify the incongruence between different user groups, which makes it a qualitative analysis method in nature via in-depth interviews. TF can be used to identify and confirm some potential problems as well.
As building blocks, these process constructs can be combined, reordered, and repeated in order to customize a feasible detecting approach for meeting the needs of a specific problem. Data collections can be customized as well. When applying them to the problem diagnosis, they cannot be constrained by the original model of different perspectives. For example, because the purpose is not to validate the completeness of the models in Construct II but to quickly detect potential problem sources, only the impacting factors in the original models matter and other precedent or control variables may be ignored. In addition, Construct III can be used to confirm a known proposition generated from Constructs I and II, as well as the original purpose of incongruence between user groups.
IS Success Model
An earlier key study on IS success was done by DeLone and McLean (1992) who collected over 100 papers since 1981 and proposed a six-factor IS success model, including system quality, information quality,
use, user satisfaction, individual impact, and organizational impact. However, Pitt et al. (1995) thought that their model placed an emphasis more on the technical view and ignored the IS department in a service role. Therefore, service quality was added to the IS success model. Lately, DeLone and McLean (2003) collected 144 papers that referred to their original IS success model and confirmed the necessity of service quality.
Technology Acceptance Model
Davis (1986) first proposed the TAM based on the Theory of Reasoned Action (TRA) by Fishbein and Ajzen (1975), which aimed to simplify the TRA by eliminating a subjective norm and look for a more general model to explain users’behaviortoward computer technology. Legris, Ingham, and Collerette (2003) analyzed 22 TAM papers between 1980 and 2003 and found out that despite different external factors that were included in different scenarios, only less than 40% of the variances were explained on average.
Venkatesh et al. (2003) reviewed years of TAM-related models and proposed the Unified Theory of Acceptance and Use of Technology (UTAUT), which was proven to have a high 70% explanation power. UTAUT covered perspectives in psychology, sociology, and technique by incorporating eight models. In particular, Venkatesh et al. (2003) used four moderating variables of gender, age, experience, and voluntariness of use and four precedent factors of performance expectancy, effort expectancy, social influence, and facilitating conditions. In order to overcome previous TAM-study constraints, their experiment covered four different lines of large corporations and was conducted in a six-month period with three different testing stages. The experiment demonstrated that UTAUT explained 69% of the variance in intention. A follow-up experiment was done on two different types of corporations, and again, it obtained a 70% level of explanatory power, which was much more effective than any individual or combined models in the past.
Technological Frame Model
Orlikowski and Gash (1994) proposed a TF model to explain the source of IS implementation difficulties by extending the theory into social cognition and studying the incongruence between the members of a large consulting firm in adopting Notes groupware. The incongruence came from the technical staff and user group who had different interpretations about technology use, especially in their understanding of technological assumption, expectation, and knowledge. TF consists of three domain areas: nature of technology, technology strategy, and technology in use. Nature of technology explores people’s impression of technology and understanding of the functionality and performance of the technology in use. This includes motivation and success principles. Technology strategy explores people’sopinionson why their organization is implementing a specific technology, including the motivation and vision to adopt the technology and their mission to the organization. Technology in use explores how people use technology in daily routines and the criteria and expected outcome for using such a technology, including priority and resource, educational training, difficulty level, and policy of safety quality.
Justification
Tao et al. (2005) justified their proposed framework by meeting pre-specified guidelines, and thus presented the following desirable characteristics for IS problem diagnosis:
1. Theoretically sound while practically feasible - The UTAUT model, IS success model, and TF mode1 have all been validated and used in many studies.
2. Comprehensive in scope and doubly secured - A software project life cycle was brought in to measure the adequate coverage in temporal dimension. Also, to be safe, two sets of models and processing steps were adopted to cover the complete life cycle twice.
3. Flexible in its structure - The separation of the static model and the dynamic process makes the problem-diagnosis approach customizable and their content exchangeable.
4. Flexible in its applications - It is naturally inherited from the structural flexibility.
This study conceptually agrees with these good characteristics justified by Tao et al. (2005) based on the following reasons. First of all, the UTAUT, IS Success model, and TF model have been frequently adopted in the IS literature. Second, the composed framework itself does demonstrate its complete coverage of a software development by basing the lifecycle viewpoint, its flexibility in its components of the static model, and its customization of the dynamic process. More importantly, it does not address anything specific to ERP application only. Therefore, this study thinks that this framework can work for any IS application with these claimed characteristics. However, the framework’s practical feasibility in IS problem solving remains to be empirically tested.
RESEARCH METHODS Experiment Design
Patton (1990) proposed four triangulations to measure research methods, including multiple research methods, multiple qualitative data sources, multiple informants, and multiple theories. This study inherited the multiple research methods (qualitative and quantitative methods) and multiple theories (UTAUT, IS Success model, and TF) from the framework. Even with such a problem-diagnosis nature, this study aimed to retain adequate reliability and validity like an academic research through the theoretical framework.
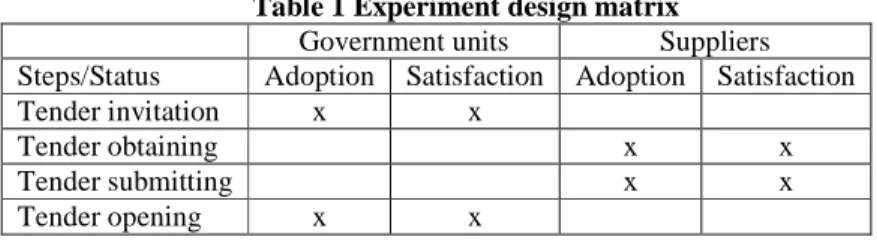
Based on the static model, the first-stage study adopted the quantitative questionnaire design for collecting data of the UTAUT and IS success model. On the other hand, the second-stage study took the qualitative interview method based on the first-stage results and TF constructs for the incongruence among participant groups. In both phases, the experiments were divided into eight different segments based on the dimensions of target and stage of adoption within the four steps of the GEPS process. As can be seen in Table 1, government units initiate the first step of tender invitation and the final step of tender opening, and suppliers participate in the middle two steps of obtaining the tender application forms and submitting their tender applications. At each step, the status of the government units or suppliers could be at before or after the adoption point of the life cycle timeline. Therefore, part of the participants qualified for the UTAUT model while the rest qualified for the IS Success Model, as illustrated by the top cycle in Figure 1.
Table 1 Experiment design matrix
Government units Suppliers Steps/Status Adoption Satisfaction Adoption Satisfaction
Tender invitation x x
Tender obtaining x x
Tender submitting x x
Tender opening x x
The survey population included both the government units and suppliers who were taken from the attendees of free training courses offered by the PCC. Even though the questionnaire was modified from the original studies of UTAUT (Venkatesh et al., 2003) and IS Success model (Myers, Kappelman and Prybutok, 1997), which have been well tested in prior studies, this study still conducted a small sample pre-test to adjust the questionnaire items to our sample.
Data Analysis Method
How can the UTAUT and IS Success Model be used in problem diagnosis instead of their original model-building purpose? Based on the facts that the UTAUT and IS Success Model have been well tested in previous studies, two approaches can be considered: adopters can either use descriptive statistics to identify the lower average scores of certain constructs as weak points for potential improvements, or the Structured Equation Modeling (SEM) to test the data collected from the GEPS users can be employed against these models to identify the inconsistent paths as weak points for improvement. Since we intended to demonstrate the usage of this framework to its full scale, this study took both approaches. The first approach is descriptive analysis, which was fairly easy to execute compared to the second approach of SEM analysis which was fairly complicated for regular adopters.
According to the abovementioned two approaches, data analysis methods used in the first stage were descriptive statistics, such as means and percentages, and confirmatory factor analysis that includes the model fitting and structural model testing as used in the original UTAUT study (Venkatesh et al., 2003). In the second stage, qualitative concepts extracted from the interview data were used, as seen in the original TF study (Orlikowski and Gash, 1994). Although there were thousands of organizations in the sample population, there were only a few tender-submitting suppliers and tender-opening government units. The numbers of returned surveys in these two steps were expected to be very small, especially compared to the first two steps. This is also why in the data analysis stage, a Partial Least Square (PLS)-based software that can tolerate smaller sample sizes was used (Fornell and Bookstein, 1982) instead of the popular covariance-based SEM software like LISREL or AMOS which require 200 observations. Another reason why PLS was used in Venkatesh et al.’s (2003) study is because it was uncertain whether or not the eight models to be tested were going to be normally distributed, which is the same situation in this GEPS case.
Figure 2 Generic theoretical network with constructs and measures (Gefen et al., 2000)
Figure 2 depicts the sample of SEM syntax as presented in the theoretical model by Gefen et al. (2000). Using the UTAUT model as an example, behavioral intention (BI) and use behavior (UB) are endogenous constructs which are predicted by the other variables or latent constructs Eta (h). Performance expectancy, effort expectancy, social influence, and facilitating conditions are considered exogenous latent constructs because no other variable in this particular model predicts them. The causal path BI (x1) UB (x2) is estimated as a βcoefficient. The actual collected and observed variables were items BI1- BI3 which are not shown here. These measures are thought to reflect the latent construct BI. Based on the above description, like other structured equation methods, PLS includes two stages of analysis (Wold, 1985). The first stage is the measurement model for measuring the relationship between latent variables and observed variables, also called outer model. The second stage is the structural model for inspecting the causal effects between endogenous latent variables and other latent variables, also called the inner model.
The measurement model includes item reliability, construct composite reliability, convergent validity, and discriminate validity. These are briefly described below. First, item reliability is the degree to which an item measuring the corresponding construct assures construct unidimensionality. Although Hair (1992) indicated that the reliability of an individual item is its factor loading, which should be greater than 0.5, the 0.7 minimum value proposed by Fornell and Larcker (1981) was adopted in this study. Second, usually a construct contains several items that measure the same concept. Fornell and Larcker (1981) proposed using Composite Reliability (CR,ρ) to measure the internal consistency of a construct, which was suggested by Nunnally (1978) to be greater than 0.7. Third, convergent validity meant that highly correlated items of the same characteristic within the same construct should be contained. Fornell and Larcker (1981) proposed using an average variance extracted (AVE) indicator to test this convergent validity in addition to item reliability and construct composite reliability. AVE extracts the average variance of the observed variables, which is suggested to be greater than 0.5. Likewise, Nunnally (1978) proposed testing whether an item loading is greater than 0.5 as the convergent threshold. Fourth, discriminant validity represents the different trait levels between a construct and other constructs. That is to say, every item should have a higher trait level within its own construct than across others. Two methods can be utilized to make sure that every construct is unique: Either factor loading of a construct is higher than the same observed items in other constructs, or the AVE in each construct is higher than the correlations between construct pairs (Fornell and Larcker, 1981).
The structural model adopts path analysis and correlations between constructs for self-evaluation. Specifically, path coefficient βand explained variance R2are used. The statistical objectives of PLS is the same as the linear regression, which rejects the null hypotheses of no-effects (Thompson et al., 1995) by showing high R2and significant t values.
DATA ANALYSIS Profile Analysis
This study sampled GEPS users from the central and local governments and their suppliers. The surveys that targeted those who have not adopted GEPS had a return that ranged from 190 to 458 respondents. The number of respondents from those who have adopted GEPS ranged from 20 to 548. In particular, the low returns occurred in submitting and opening steps with only 20 and 63 respondents, respectively. The profile is briefly summarized as follows. Except for a supplier’s electronic tender obtaining system and submitting system in the acceptance part of the survey, the male respondents were generally more than the female respondents. Majority of supplier respondents were under 35 years old while majority of government respondents were about 40 years old. Most suppliers and government respondents had over three years of Internet experience, which implies an adequate basic Internet capability. Most respondents had college-level and above degrees, but 8.58%~28.25% of them only had high school diplomas. Location wise, most respondents were from northern and southern Taiwan’smetropolitan areas. Central government units had high respondent rates of 66.61% and 71.43% in the satisfaction part of the survey. This also implies a less frequent GEPS usage by the local government units. Most suppliers had less than 10 employees, indicating a high percentage of small enterprises.
The PCC is responsible for planning, monitoring, and promoting the implementation of GEPS. Thus, only the key person from the PCC planning division was interviewed in the second stage. Since government users have different levels of GEPS usage, 20 correspondent users of high and low usages from the central and local government units were selected based on the statistical reports provided by the GEPS customer service center. This study targeted those suppliers who had either participated in GEPS or called in to the customer service center. Eight of them accepted our interview via telephone invitation. The interview adopted a semi-structured format to enhance the explanations of the data collected in the first stage. The 28 telephone interview sessions took one and half months and each lasted from 30 to 50 minutes each. The interview data were transcribed into text files for further analyses.
First-Stage Analysis
Survey average scores
Based on the calculated average scores of constructs in the UTAUT model and IS Success Model, the construct averages were all above 4 and lean toward somewhat agree (5) or agree (6) on a 7-point Likert scale. This means that the suppliers and government users had non-negative perception on these constructs. In particular, the average scores in the IS Success model were generally higher than the ones in the UTAUT model. This entails that those who had adopted GEPS had higher agreements than those who had not. This also implies that the procurement correspondents did feel that GEPS was helpful to their jobs. Another pattern was that the average scores seem to be lower in the tender submitting and opening systems by comparing their mostly below 5 averages to the above 5 averages of the invitation and obtaining systems. Although it is not easy to identify the weak points for improving directions, it is certainly clear that users may have more problems with the electronic tender submitting and opening systems. It is especially true because these were the very few users who actually adopted these two GEPS functions.
Reliability and validity testing
Since the validation process has been described in the Experiment Design subsection above, only the electronic tender invitation system is used to explain the data analysis as an illustration. Among these variables, two had factor loadings lower than the suggested value of minimum 0.7. After deleting them, all observed variables’factor loadings ranged from 0.701 to 0.966, which were all acceptable. For composite reliability (CR), all the CR values in the model were between 0.879 and 0.971. Because they were greater than the minimum suggested value of 0.7, all the constructs met the criteria of being internally consistent. All AVE values in the model ranged from 0.699 to 0.919, therefore the convergent validity holds for being greater than the minimum suggested value of 0.5. Likewise, every potential construct’s observed variables had high factor loadings (greater than .807), and all the construct’s
AVE
values were greater than the values between constructs. Together, they implied that the discriminant validity held for these potential constructs. Overall speaking, with the same procedure demonstrated above, the eight models listed in Table 1 all met the criteria after the same treatments on those exceptions.Path analysis
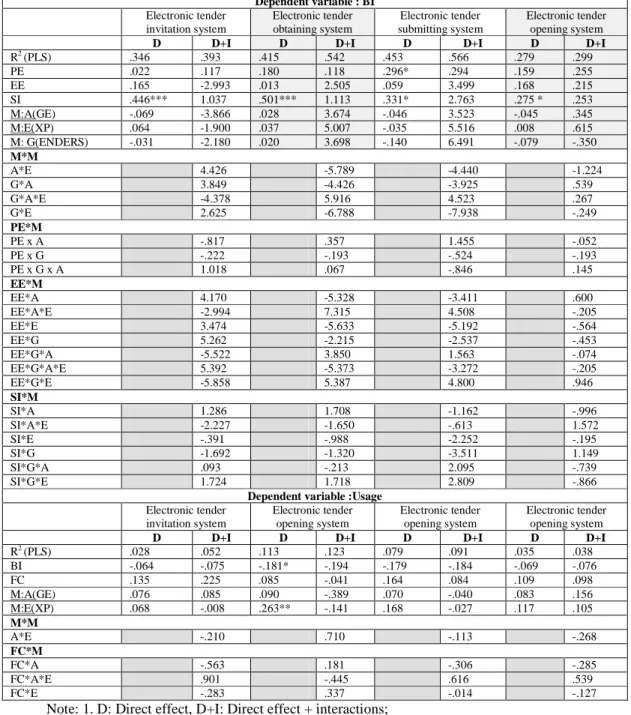
Similar to the validation process above, only the electronic tender invitation system is used to explain the data analysis as an illustration. Table 2 displays the structural model analysis for the acceptance model with the
dependent variable in the upper half as BI and the lower half as Usage. From Table 2 we know that for the upper half only one path, that is, social influence (SI) to BI, had a significant positive impact when no interaction wasconsidered,asshown underthe“D”column of“Electronictenderinvitation system”.However, afterincluding moderatevariables’interactions,no path wassignificantunderthe“D+I”column.Themain constructs of performance expectancy, effort expectancy, social influence, and moderate variables of age, experience, and sex explained behavior intention by 34.6%, in which age and sex had negative impacts. For the lower half of Table 2, the explanation power increased to 39.3% after considering the interactions brought in by moderate variables. Behavior intention, facilitating condition, age, and experience accumulated 2.8% of explanation, in which behavior intention had a negative impact on usage. After the interactions brought in by moderate variables, the explanation power had been increased to 5.2%.
Overall speaking, the outcomes of four UTAUT acceptances all looked like the tender invitation system described above. Strangely enough, UTAUT is a model with 70% of its variance explained in technology acceptance as validated by Venkatesh et al. (2003), however none of the paths was significant in our four models of electronic tender invitation, obtaining, submitting, and opening systems. In particular, we ran the UTAUT model without the moderate variables through PLS, some models did show significant paths compared with none in the full model with interactions of moderate variables. Examples of significant paths were social influence in all four models, performance expectancy in electronic tender submitting system, and behavior intention and experience in electronic tender obtaining system. This is far different than our expectation of the UTAUT model and deserves further inspections of the UTAUT model. For the path analysis on the satisfaction part of IS Success model, we obtained significant paths from empathy to user satisfaction in all four models. Among them, the electronic tender invitation system model had the highest number of significant paths. Because majority of the path analysis showed insignificant paths in the UTAUT and IS Success models in the first stage, it implies that weak points (important factors) could not be easily identified using the survey data. Therefore, in the second-stage interview, a few questions from the first phase were added to the TF question based on the 28 open-ended interview sessions.
Table 2 Structural model analysis for acceptance model Dependent variable : BI Electronic tender invitation system Electronic tender obtaining system Electronic tender submitting system Electronic tender opening system
D D+I D D+I D D+I D D+I
R2(PLS) .346 .393 .415 .542 .453 .566 .279 .299 PE .022 .117 .180 .118 .296* .294 .159 .255 EE .165 -2.993 .013 2.505 .059 3.499 .168 .215 SI .446*** 1.037 .501*** 1.113 .331* 2.763 .275 * .253 M:A(GE) -.069 -3.866 .028 3.674 -.046 3.523 -.045 .345 M:E(XP) .064 -1.900 .037 5.007 -.035 5.516 .008 .615 M: G(ENDERS) -.031 -2.180 .020 3.698 -.140 6.491 -.079 -.350 M*M A*E 4.426 -5.789 -4.440 -1.224 G*A 3.849 -4.426 -3.925 .539 G*A*E -4.378 5.916 4.523 .267 G*E 2.625 -6.788 -7.938 -.249 PE*M PE x A -.817 .357 1.455 -.052 PE x G -.222 -.193 -.524 -.193 PE x G x A 1.018 .067 -.846 .145 EE*M EE*A 4.170 -5.328 -3.411 .600 EE*A*E -2.994 7.315 4.508 -.205 EE*E 3.474 -5.633 -5.192 -.564 EE*G 5.262 -2.215 -2.537 -.453 EE*G*A -5.522 3.850 1.563 -.074 EE*G*A*E 5.392 -5.373 -3.272 -.205 EE*G*E -5.858 5.387 4.800 .946 SI*M SI*A 1.286 1.708 -1.162 -.996 SI*A*E -2.227 -1.650 -.613 1.572 SI*E -.391 -.988 -2.252 -.195 SI*G -1.692 -1.320 -3.511 1.149 SI*G*A .093 -.213 2.095 -.739 SI*G*E 1.724 1.718 2.809 -.866
Dependent variable :Usage
Electronic tender invitation system Electronic tender opening system Electronic tender opening system Electronic tender opening system
D D+I D D+I D D+I D D+I
R2(PLS) .028 .052 .113 .123 .079 .091 .035 .038 BI -.064 -.075 -.181* -.194 -.179 -.184 -.069 -.076 FC .135 .225 .085 -.041 .164 .084 .109 .098 M:A(GE) .076 .085 .090 -.389 .070 -.040 .083 .156 M:E(XP) .068 -.008 .263** -.141 .168 -.027 .117 .105 M*M A*E -.210 .710 -.113 -.268 FC*M FC*A -.563 .181 -.306 -.285 FC*A*E .901 -.445 .616 .539 FC*E -.283 .337 -.014 -.127
Note: 1. D: Direct effect, D+I: Direct effect + interactions;
2.t(.05,∞)=1.96 ;t(.01,∞)=2.576;t(.001,∞)=3.291;3. * P < .05; ** P < .01; *** P < .001
Second-Stage Analysis
Nature of technology
The opinions regarding nature of technology, relative benefit, and social influence collected from the PCC officer, government correspondents, and suppliers are summarized in Table 3. It is obvious that the PCC officer had the ideal GEPS environment in mind, while government employees and suppliers had practical difficulties in adopting the GEPS despite recognizing the potential savings in time and manpower. Moreover, government employees and suppliers had mostly negative perceptions of the relative benefits in contrast to the all positive benefits of the PCC officer. Unfortunately, the PCC officer considered making a new regulation to
enforce the usage of GEPS, while the users strongly expressed practical problems that needed to be resolved first.
Table 3 Analysis of the nature of technology
Domain PCC Government units Suppliers
Nature of technology
‧ GEPS is electronic commerce ‧ GEPS provides complete and
efficient procurement process
‧ Insufficient equipments and trained staff ‧ Small-amount tender cases need no
e-procurement approach
‧ No adequate environment to comply with this change ‧ Not easy to learn GEPS Relative
benefit
‧ Decreasing procurement manpower
‧ Decreasing resource waste ‧ Adding new procurement channel ‧ Improving procurement efficiency
‧ Saving manpower
‧ Maintaining two systems forsuppliers’ convenience
‧ Wasting time and resources ‧ Increasing workload
‧ Saving time
‧ Difficult to apply business certificate, and bidding deposit certificate ‧ Higher fees and costs Social
influence
‧ Making GEPS usage a policy ‧ Setting annual achievement rates
to promote its usage
‧ Obligate to use GEPS and meeting given achievement rate
‧ Suppliers demanding manual process
‧ New government regulation
Technology strategy
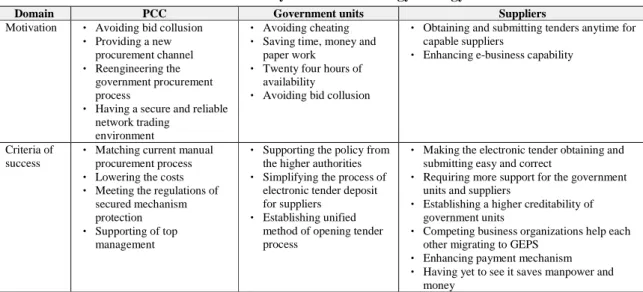
Table 4 lists the opinions regarding motivation and criteria of success from the PCC officer, government correspondents, and suppliers. The PCC officer and government users seemed to agree on the motivations for implementing GEPS, while the suppliers were less motivated in both the reasons and coverage. For GEPS to succeed, both the PCC and government employees were aware that the support from higher level government officials was critical. All three parties pointed out their interests in the technological perspective, including the secured operation mechanism by the PCC, a unified method of opening tender process by the government units, and correct and easy operations of the electronic tender obtaining and submitting processes by the suppliers. Although they are not indicated in Table 3, the suppliers had listed many technical issues, such as time consumed in making the tender documents, system interrupted due to large-file uploads, increasing costs in using GEPS and additional workload, and difficulty in downloading graphical files. These technical problems become the existing obstacles for suppliers to be highly motivated and pay high regard on GEPS usage even after the development of GEPS has ended.
Table 4 Analysis of the technology strategy
Domain PCC Government units Suppliers
Motivation ‧ Avoiding bid collusion ‧ Providing a new
procurement channel ‧ Reengineering the
government procurement process
‧ Having a secure and reliable network trading
environment
‧ Avoiding cheating ‧ Saving time, money and
paper work ‧ Twenty four hours of
availability
‧ Avoiding bid collusion
‧ Obtaining and submitting tenders anytime for capable suppliers
‧ Enhancing e-business capability
Criteria of success
‧ Matching current manual procurement process ‧ Lowering the costs ‧ Meeting the regulations of
secured mechanism protection ‧ Supporting of top
management
‧ Supporting the policy from the higher authorities ‧ Simplifying the process of
electronic tender deposit for suppliers
‧ Establishing unified method of opening tender process
‧ Making the electronic tender obtaining and submitting easy and correct
‧ Requiring more support for the government units and suppliers
‧ Establishing a higher creditability of government units
‧ Competing business organizations help each other migrating to GEPS
‧ Enhancing payment mechanism ‧ Having yet to see it saves manpower and
money
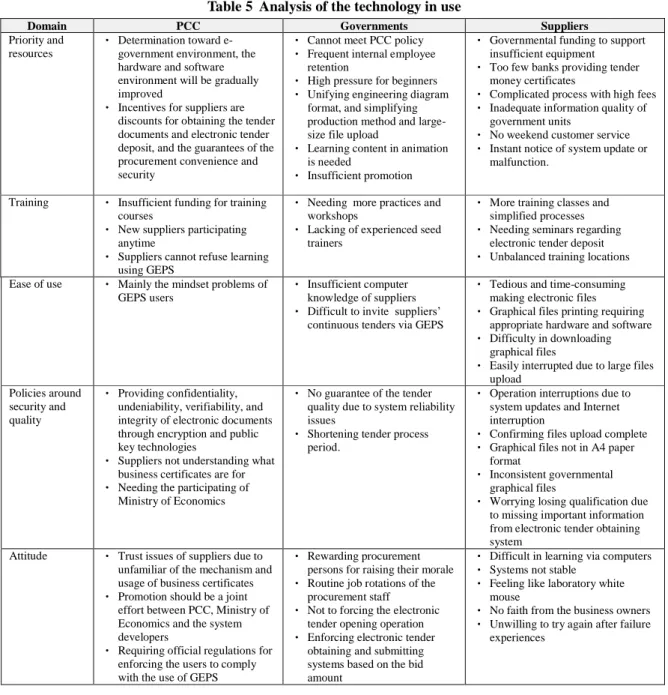
Technology in use
Domains regarding technology in use were collected and summarized in Table 5. From the priority and resources domain, we can see that the PCC officer had an opposite approach from the government employees and suppliers in that GEPS was determined to be implemented even without a user-friendly environment for the users. Users from government units and suppliers had suggested many system functionalities and usability issues that need to be resolved before the regulation enforcing the achievement rates. For training needs, all three parties agreed that more training courses are needed. However, the PCC admitted inadequate funding issue. While the end users had much to say about the ease of GEPS use, the PCC simply considered the users who had a correct-mindset problem as the only issue.
Table 5 Analysis of the technology in use
Domain PCC Governments Suppliers
Priority and resources
‧ Determination toward e-government environment, the hardware and software environment will be gradually improved
‧ Incentives for suppliers are discounts for obtaining the tender documents and electronic tender deposit, and the guarantees of the procurement convenience and security
‧ Cannot meet PCC policy ‧ Frequent internal employee
retention
‧ High pressure for beginners ‧ Unifying engineering diagram
format, and simplifying production method and large-size file upload
‧ Learning content in animation is needed
‧ Insufficient promotion
‧ Governmental funding to support insufficient equipment
‧ Too few banks providing tender money certificates
‧ Complicated process with high fees ‧ Inadequate information quality of
government units
‧ No weekend customer service ‧ Instant notice of system update or
malfunction.
Training ‧ Insufficient funding for training courses
‧ New suppliers participating anytime
‧ Suppliers cannot refuse learning using GEPS
‧ Needing more practices and workshops
‧ Lacking of experienced seed trainers
‧ More training classes and simplified processes ‧ Needing seminars regarding
electronic tender deposit ‧ Unbalanced training locations Ease of use ‧ Mainly the mindset problems of
GEPS users
‧ Insufficient computer knowledge of suppliers ‧ Difficult to invite suppliers’
continuous tenders via GEPS
‧ Tedious and time-consuming making electronic files ‧ Graphical files printing requiring
appropriate hardware and software ‧ Difficulty in downloading
graphical files
‧ Easily interrupted due to large files upload
Policies around security and quality
‧ Providing confidentiality, undeniability, verifiability, and integrity of electronic documents through encryption and public key technologies
‧ Suppliers not understanding what business certificates are for ‧ Needing the participating of
Ministry of Economics
‧ No guarantee of the tender quality due to system reliability issues
‧ Shortening tender process period.
‧ Operation interruptions due to system updates and Internet interruption
‧ Confirming files upload complete ‧ Graphical files not in A4 paper
format
‧ Inconsistent governmental graphical files
‧ Worrying losing qualification due to missing important information from electronic tender obtaining system
Attitude ‧ Trust issues of suppliers due to unfamiliar of the mechanism and usage of business certificates ‧ Promotion should be a joint
effort between PCC, Ministry of Economics and the system developers
‧ Requiring official regulations for enforcing the users to comply with the use of GEPS
‧ Rewarding procurement persons for raising their morale ‧ Routine job rotations of the
procurement staff ‧ Not to forcing the electronic
tender opening operation ‧ Enforcing electronic tender
obtaining and submitting systems based on the bid amount
‧ Difficult in learning via computers ‧ Systems not stable
‧ Feeling like laboratory white mouse
‧ No faith from the business owners ‧ Unwilling to try again after failure
experiences
Summary finding from TF
The reason why TF was proposed in the first place was actually reflected in this GEPS usage. The policy maker PCC simply had a different technological frame than both the buyer and seller-side of GEPS users. Although the GEPS may be implemented adequately in a well cultured business organization, it was not the case in loosely connected virtual organizations involving so many government units and nationwide suppliers. Most importantly, it appeared that electronic submission and opening systems deserved more usability testing and process improvement before the users are willing to adopt it.
DISCUSSION AND IMPLICATIONS
The GEPS problem
There existed a positive incongruence of GEPS technological frame across the policy maker PCC and the users of governmental buyers and private small-firm sellers, especially from the nature of technology and
attitude perspectives. The system might have been planned well as the PCC expected (Liao et al., 2002), but the suppliers had the common trust issues in electronic commerce environment as seen in the second phase of analysis and as raised in the literature (Gefen 2000; Jarvenpaa et al. 2000; Bhattacherjee 2002). The government units had different levels of preparation and resources but faced the same achievement-rate requirement. Although time may resolve this issue as the PCC believes, those less-advantaged government units were suffering and were thus against using this GEPS system. On the other hand, suppliers were mostly small business organizations with inadequate manpower and facility to comply with the PCC requirement to do business with government units online. Taiwan’s government has the responsibility to assist these small business organizations to be able to continuously conduct business with their regular governmental customers instead of making them drop out with this supposedly beneficial GEPS system. In addition to the high-level differences, free training courses evenly distributed across the country and extended telephone customer services are particularly important supplements since not all suppliers and government units adopted GEPS at the same pace and the frequency for using GEPS was different.
With a five-year experience of GEPS development and implementation, the PCC could have done better by extending the current achievement rates from electronic tender invitation and obtaining systems to the submitting and opening systems. The above diagnostic results should shed some light for the PCC to fight for a higher budget and improve what the users really need in order to adopt the GEPS with desirable satisfaction levels, which is really only a new user-centered mindset for the policy maker with power.
The IS problem-diagnosis framework
This GEPS case study clearly demonstrated a full-scale usage of this ERP-extended IS problem-diagnosis framework. Although the first stage of the UTAUT and IS Success models did not provided much useful information, the second stage of TF model did identify problem directions as discussed above. This may also illustrate the original purpose of designing such a two-cycle IS problem-diagnosis framework by Tao et al. (2005). As illustrated, the two-cycle problem-diagnosis could reduce the risk of not being able to identify the problem directions or confirm the suspected causes if one of them failed. In addition, the user has the flexibility to adopt part of the models suggested in this framework. That is, if the questionnaire data collection is not convenient or easy to conduct, the user can always fall back to the second cycle of the TF model. It is because collecting user interview data for TF analysis is more like the common approach a seasoned consultant does, except with a template of questions regarding the domains of incongruence.
To sum up, this IS problem-diagnosis framework is the first one that incorporates an IS theoretical foundation. It may still need to evolve by resolving practical issues or improving the IS models; nonetheless, the current form of this framework is still considered an ideal mental model for beginners to start with their diagnosis tasks. It is also an ideal toolset for intermediate users to efficiently conduct their problem-diagnosis routines.
Future work
First of all, although the UTAUT model has nearly 70% of explanation power for IS adoption, it was not working well in this complicated scenario of GEPS system. This may have something to do with the continuous evolution of the TAM model as suggested by Legris et al. (2003) or the cultural factors pointed out by Fife and Pereira (2005). Further inspection on the first stages of models in this framework is desirable. Secondly, even though a higher budget for a user-center mindset of a PCC decision maker might improve the achievement rates, a cost-benefit analysis of the overall investments is necessary to enable the PCC officer to fight for budget with convincing data. The cost-benefit calculation is indeed a research issue for this non-monetary-based GEPS objective. Finally, the last research issue is the need to explain how a loosely coupled huge virtual organization like the GEPS user community can reach a consistent congruence within their TFs. This is especially important for modern organizations pursuing the global expansion with increasing international collaborations around the world.
REFERENCES
Bhattacherjee, A. 2002. Individual trust in online firm: scale development and initial test. Journal of Management Information Systems, 19(1): 211-241.
ChungHwa Telecom, 2006. Internal data of customer call-in statistics for Government electronic procurement system, Customer Service Center, Kaohsiung, Taiwan.
Davis, F. D. 1986. A technology acceptance model for empirically testing new end-user information system: theory & results. Doctoral dissertation, MIT Sloan School management, Cambridge, MA.
DeLone, W. H. & McLean, E. R. 1992. Information systems success: the quest for the dependent variable. Information Systems Research, 3(1): 60-95.
Fife, E. and Pereira, F. 2005. Global acceptance of technology (GAT) and demand for mobile data services. Hong Kong Mobility Roundtable, June 2-3.
Fishbein, M. & Ajzen, I. 1975. Belief, attitude, intension, and behavior: An introduction to theory and research, Reading. MA: Addison-Wesley.
Fornell, C. & Larcker D. F. 1981. Evaluating structural equation models with unobservable variables and measurement error. Journal of Marketing Research, 18(1): 39-5.
Fornell, C. & Bookstein, F. 1982. Two structural equation models: LISREL and PLS applied to consumer exit-voice theory. Journal of Marketing Research, 19: 440-452.
Gefen, D. 2000. E-commerce: the role of familiarity and trust. Omega, 28(6): 725-737.
Gefen, D., Straub, D. and Boudreau, M.-C. 2000. Structural equation modeling and regression: Guidelines for research practice. Communication of the Association for Information Systems,.4(7): Article 7.
Hair, J. F., Anderson, L E., Tatham, L. L & Black, W. C. 1992. Multivariate Data Analysis with Readings, New York: Macmillan.
Hong, K.-K. & Kim, Y.-G. 2002. The critical success factors for ERP implementation: an organizational fit perspective. Information & Management, 40:25-40.
Jarvenpaa, S., Tractinsky, N., & Vitale, M. 2000. Consumer trust in an internet store. Information Technology and Management, 1(1-2): 45-71.
Legris, P., Ingham, J. & Collerette P. 2003. Why do people use information technology? A critical review of the technology acceptance model. Information & Management, 40(3): 191-204.
Liao, T. S., Wang, M. T. & Tserng, H. P. 2002. A framework of electronic tendering for government procurement: A lesson learned in Taiwan. Automation in Construction, 11: 731-742.
Nunnally, J. 1978. Psychometric theory. New York: McGraw-Hill.
Orlikowski, W. J. & Gash D. C. 1994 Technological frames: Making sense of information technology in organizations. ACM Transactions on Information Systems, 12(2):174-207.
PCC. 2006. Web Site of Public Construction Commission, Executive Yuan, Taiwan, Republic of China, http://www.pcc.gov.tw/
Patton, A. Q. 1990. Qualitative evaluation & research methods (2nd ed.), Sage Publiications.
Pitt, L. F., Watson, R. T. & Kavan, C. B. 1995. Service quality: A measure of information systems effectiveness. MIS Quarterly, 19(2):173-187.
Rajagopal, P. 2002. An innovation–diffusion view of implementation of enterprise resource planning systems and development of a research model. Information and Management, 40: 87–114.
Tao, Y. H., Lee, J. & Liu, S. C. 2005. A framework of problem diagnosis for ERP implementations. Sixteenth Annual Conference of Production and Operations Management Society, April 29-May 2, 2005,Chicago, IL.
Thompson, R., Barclay, D. W. and Higgins, C. A. 1995. The partial least squares approach to causal modeling: Personal computer adoption and use as an illustration, Technology Studies: Special Issue on Research Methodology, 2(2):284-324.
Venkatesh V., Morris, M. G., Davis, G. B. & Davis, F. D. 2003. User acceptance of information technology: Toward a unified view. MIS Quarterly, 27(3): 425-478.
Wold, H. 1985. Partial Least Squares. Encyclopedia of statistical sciences, Kotz, S & Johnson, N.L (Eds), 6: 581-591, New York: John Wiley & Sons.