Tao, Y.-H., Chang, C.R. and Chen, C, P., Unmet adoption expectation as the key to e-marketplace failure:A caseofTaiwan’ssteelindustry, Industrial Marketing Management, 36, 2007, 1057-1067.
Unmet Adoption Expectation as the Key to e-Marketplace Failure:
A Ca
s
e
of
Tai
wan’
s
Steel Industry
ABSTRACT
Many e-marketplaces rose and fell in recent years. In this study, we argue that unmet expectation
was the main reason why Taiwan’s steel e-marketplaces failed. To confirm this statement, we
examined the discrepancy between the original adoption factors and the factors that lead to the
current satisfaction as perceived by e-marketplace participants. Adoption factors were identified by
the factor analysis using data collected from medium-sized steel enterprises via a questionnaire
based on a preliminary literature review and a focus group interview. The importance rank of the
nine adoption factors suggested that the customers desired a safe and secured transaction-oriented
platform and that they were less concerned on the cost-saving or management efficiency for steel
e-marketplaces. However, Taiwan’s steel e-marketplaces failed to meet users’expectations as
negative scores appeared on all but “industry information”satisfaction indicators. In other words,
more efforts are needed to focus on transforming the visionary e-marketplace into a practical and
secured trading environment to earn the user’s satisfaction and support. An implication drawn from
Keywords: e-Marketplace, Adoption Factors, Steel Industry, Medium-Sized Enterprises, Business
to Business
1. Introduction
Visioning the importance of electronic marketplace (e-marketplace) to Taiwan’s international
competitive advantage, the Industrial Development Bureau of Ministry of Economic Affairs (IDB, 2001)
of Taiwan announced a project in May 2001 to fund Taiwan Industrial Marketplace (TIM) as a common
platform for connecting more than ten Taiwan industries to the world, such as mechanics, automobile,
electronics, food, and steel. In 2002, one year after TIM was established, an official public announcement
revealed that Taiwan had about twenty e-marketplaces which generated US$1.2 billion worth of
transactions and US$38.9 million worth of earnings as of 2002, and it was expected in 2005 to have over
seventy e-marketplaces with US$4.4 billion worth of transactions and US$146.1 million worth of
earnings (Tsang, 2002). In the official announcement, Taiwan’s e-marketplaces seemed to be prosperous,
but in reality, not all e-marketplaces were performing equally well. According to our investigation, as of
the third quarter of 2004, the remaining two steel e-marketplaces (Professional Steel Net in Chinese
Language-http://steelnet.com and Universal Exchange-http://steel.uxb2b.com) were not profitable due to
low actual transaction volumes, and thus have been downgraded to information-exchange oriented sites.
There were over 200 steel e-marketplaces at peak time (Schneider & Perry, 2003), including some
the U.S., isteelasia (http://www.isteelasia.com) and worldmetal (http://www.worldmetal.com) in Hong
Kong and Mysteel in China (http://www.mysteel.com). One major difference between the U.S. and the
Asian e-marketplaces is that the U.S. e-marketplaces focus more on the transaction activities while the
Asian e-marketplaces further expand their efforts into information exchange. Metal Industries Research
and Development Center (MIRDC, 2001a) has done a critical analysis on Taiwan’s steel industry as
follows: Taiwan’s raw steel production ranks number 14 worldwide with a two percent of market share.
Furthermore, Taiwan owns a superior environmental factor being the second largest steel consumption
(per person ratio) country and many nearby Asian counties are either on top of the list or have the biggest
growth of consumption. Because the average exporting rate of steel products is smaller than 50 percent
and Taiwan has been a free steel trading country with custom duty closed to WTO level of 3.5 percent,
these factors present a great opportunity for Taiwan’s steel industry growth by increasing steel export.
Therefore, business to business (B2B) electronic commerce (EC) is one strategy that can easily unify
other strategies such as national alliances in marketing or R&D, and information sharing.
Majority of Taiwan’s medium-sized steel enterprises who are major members of Taiwan’s steel
e-marketplaces share the same characteristics of small and medium enterprises (SMEs) while evolving
into larger capital-base enterprises. In principle, a typical Taiwan manufacturing SME has a capital of less
than US$2.6 million, or an employee size of less than 200 people (SMEA, 2000-2002). One major
problem being encountered by small and medium business is the lack of quality people and financial
implementation, and more critically, the awareness of IT as an enabler (SMEA, 2000-2002). This problem
echoes to some SME e-marketplace barriers summarized in Stockdale & Standing (2004).
Steel e-marketplaces do offer some attractiveness to the majority of their members which are
medium-size enterprises and have been suffering a long period of economic recession as well as the recent
impact of Taiwan entering the World Trade Organization. An industrial report by MIRDC (2001a)
identified several benefits for Taiwan’s steel industry to participate in electronic business. These include
lower purchasing costs, better inventory management, shorter expected production cycle, lower marketing
and sale costs, and limitless geographical boundary for accessing international customers. However, these
potential benefits also pose great challenges to the steel e-marketplace providers, and barriers to the steel
industry, which may be linked to the present failure of Taiwan’s steel e-marketplaces.
Combining the above descriptions of Taiwan’s steel industry and e-marketplace potentials, an
interesting question immediately follows: Why did the steel industry perform so poorly compared to other
Taiwan’s traditional or high-technology industries in the realm of e-marketplace? Grewal, Comer &
Mehta (2001) pointed out that motivation could affect the long-term activity of participation, which
Stockdale & Standing (2002) believe to have a forceful effect on the will to succeed in the electronic
environment. In responding to many e-marketplace failures, companies such as Chemdex, MetalSpectrum,
GoFish and E-Chemicals (Daniel et al., 2004), Brunn, Jensen & Skovgaard (2002) proposed a theoretical
framework to explain how an e-marketplace could achieve success by creating a powerful setup and
isteelasia e-marketplace (http://www.isteelasia.com) had demonstrated such a good application of focus,
governance, functionality, technology and partnership in Brunn et al.’sframework.
Based on the study of Grewal, Comer & Mehta (2001), we assume that Taiwan’s steel
e-marketplaces failed to focus appropriately on their members’motivation for participation. Therefore,
instead of investigating the after-failure factors, this study aims to explore the original adoption factors of
the participated members. In collaboration with MIRDC, we intend to validate our assumption by
examing the perception of the e-marketplace members in Taiwan’s medium-sized steel enterprises on the
original adoption factors. The remaining sections of this paper provide background information in Section
2, describe the formal research objectives and methods in Section 3, present data analyses and discussion
in Section 4, and draw conclusions in Section 5.
2. E-Marketplace and Adoption Factors
2.1 E-Marketplace
A general definition of B2B EC is “under specific transaction scope, both the suppliers and buyers
are willing to proceed with exchanging of money, and distribution of products and information through
the mechanism and norms provided by the Internet”(Deloitte Consulting, 2000). A major classification
for B2B EC is determined by its owner, such that it is an e-distribution if it comes from the seller’sside,
an e-procurement if it is on the buyer’sside, or an e-marketplace if it is intermediary (Gebauer, 1996;
Weller, 2000). However, scholars have extended the scope of the intermediary e-marketplace to include
e-marketplace into maintenance/repair/operating center (MRO) hubs, catalog hubs, and yield manager
exchanges based on procurement and product types.
There are also other B2B EC classifications such as bonding game, trading game, morphin game,
and value-added game based on purchasing relationship and industry fragmentation by McKinsey &
Company (2000), commerce hub, dynamic marketplace, channel enabler and content/community portal
by Piccinelli, Vitantonio & Mokrushin (2001), aggregators, trading hubs, post and browse markets,
auction markets and fully automated exchanges by Sculley & Woods (2001), and static vs. dynamic or
established vs. discovered by Gottschalk & Abrahamsen (2002). E-Marketplace can be further classified
based on industry type into horizontal, vertical, and diagonal market (de Figueriredo, 2002). The major
difference between horizontal and vertical markets is that a vertical market targets specific products and
services such as e-steel while a horizontal market targets multi-industries such as VerticalNet that covers
over 40 vertical industries, including communication, environmental services and food services. See
Daniel et al. (2004) for further references of e-marketplace classification.
In terms of functionality, Weller’s framework (2000) indicate that a complete e-marketplace portal
includes at least the following eight categories: content, catalog management, auctions, transaction
services, logistics, back-office integration, supply-chain management and value-added services.
Additional functionalities may be considered, such as e-marketplace of engineering information exchange
and management, in which a customer can post product-engineering diagrams to communicate the
there has been an evolution between e-marketplace models from third-party to either consortia-based and
then private e-marketplaces, or to private and then consortia-based marketplaces. This developmental
evolution has also transformed the functionality of e-marketplaces from being an early online catalogue to
subsequent online auction. Laseter, Long & Capers (2001) made an observational remark that only a
minority of e-marketplaces actually offer services beyond procurement, in which online actions might be
the only transaction activity they had achieved (Smart & Harrison, 2001).
2.2 Adoption Factors
The majority of technology adoption literature applied Technology Acceptance Model (TAM) by
Davis (1989) or Diffusion of Innovation (DOI) theory by Rogers (1995). However, TAM was criticized
by King & Gibbins (2003) as having the individual attitude-behavior rather than the firm behavior, and
DOI was criticized by Lundblad (2003) as being unsuitable for explaining a firm’s adoption decision.
Therefore, this research surveyed more generalized adoption factors from the firm’s perspective instead of
directly applying TAM or DOI models.
Generally speaking, the adoption factors for EC and information technology (IT) can be classified
into six items such as organization, technology, industry environment, relative advantage, compatibility
and testing (CommerceNet, 2000; Kendall, 2001; Lin, 2001; PricewaterhouseCoopers, 1999). Six benefits
can also be summarized. These include transparent information and market control, reduction of
transaction cost, increasing transaction opportunities, avoidance of human manipulation or mistakes,
2001; Yuan, 2001).
Because measuring e-marketplace success is a complex issue, scholars discuss the adoption factors
from different alternatives, such as sustainability, value proposition, and challenges. Daniel et al. (2004)
studied the sustainability of e-marketplaces from the macroeconomic and regulatory level, the industry
level that includes power of buyers and suppliers, characteristics of the product, industry’sIT readiness,
and the individual level that includes strategic intent and culture. Büyüközkan (2004) summarized the
e-marketplace value proposition of both buyers and suppliers, referring to lower transaction costs, better
prices, and increased IT effectiveness as buyer advantages, while lower transaction costs, improved
marketing, improved customer relationship, back-office facilitation, access to new revenue potential, and
increased IT effectiveness are supplier advantages. Hsiao (2003) categorized the challenges of
e-marketplace adoption into removing adoption barriers, chasing the shadow of fear (online trust building),
and persisting culture (trust-production mechanisms).
By focusing on SMEs, Stockdale & Standing (2004) identified the benefits and barriers of
e-marketplaces from the literature. The benefits to be gained from the participation of SMEs in
e-marketplaces include access to a wider range of markets, greater potential for partnerships, flexibility in
administration and communication, convenience (24/7 accessibility), information, improved customer
services, updating of information, lower transaction costs, differentiation of products and
services/customization, and ability to enter supply chain for larger companies. In contrast, the barriers to
lack of trust in the IT industry, lack of e-commerce readiness in some industry sectors, lack of recognition
of the potential to improve business appropriate to the effort and costs of adoption, and lack of
understanding of the realizable benefits.
3. Research Methods
There are no specific hypotheses to be tested in this research. Instead, in order to quantify the failure
causes of Taiwan‘s steel e-marketplaces from the original adoption factors, the specific objectives of this
research include O1) to derive the distinct factors that mainly affect the adoption of steel e-marketplaces;
O2) to establish the disconnection between current membership status and previous adoption factors; and
O3) to measure the current satisfaction levels of steel e-marketplace functionalities. These objectives were
accomplished based on the participants’perception of medium-sized enterprises that compose the
majority of steel e-marketplaces adopters. The analysis and discussion on the outcomes of the three
objectives provide a good justification for the causes of steel e-marketplace failure in Taiwan.
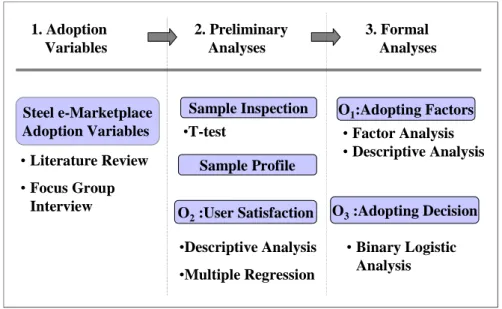
Accordingly, a three-step adoption-satisfaction approach was adopted as shown in Figure 1. The first
step was to extract steel e-marketplace adoption variables via the preliminary literature review and the
focus group interview method. A small group of industrial representatives provided in-depth
e-marketplace experiences and opinions, which helped to screen and compile the adoption variables from
the literature review. These extracted variables were then used to design a questionnaire for the survey on
the medium-sized steel enterprises.
chi-square test were used to inspect the group difference between the respondents and the
non-respondents while descriptive statistics were used to describe the respondents. Then, the satisfaction
factors were calculated and ranked to assess their relative importance to the medium-sized steel
enterprises as well as assess (Hair et al., 1998) the impacts of the eight individual satisfaction factors on
the overall satisfaction level by the multiple regression analysis.
The third step consisted of two formal analyses: the first was the factor analysis to extract the
e-marketplace adoption factors, which can be seen in many studies such as Yasin, Correia & Lisboa
(2004), Sarker, Valacich & Sarker (2003), and Scott & Shieff (1993); and then the binary logistic
regression analysis to assess the influence of adoption factors on the current membership status of the steel
e-marketplaces, which can also be seen in studies like Kuan & Chau (2001) and Laitinen (1999).
4. Data and Analyses
The process of our data analyses followed the route illustrated in Figure 1 by first extracting the
adoption variables in Section 4.1, and then conducting preliminary analyses as shown in Section 4.2 and
formal analyses in Section 4.3.
4.1 Extraction of Adoption Variables
As described in the first step of the research method in Section 3, a focus group and a preliminary
literature review were combined to extract the e-marketplace adoption variables for further analyses. Nine
with the assistance of a Steelnet e-marketplace marketing manager, and seven actually participated.
Before the focus group took place, basic information on e-marketplace was provided together with the
invitation letter for participants’references. The complete focus group discussion was audiotaped,
transcribed, and coded for further analyses. Twenty-four variables (V1~V24) of e-marketplace adoption
were extracted as shown in Table 1. These were further used to design the questionnaire for determining
the adoption factors of steel companies. The eight categories of services (V25~V32) from Weller (2000)
were also included to measure the satisfaction with Taiwan’s steel e-marketplaces.
The Taiwan Association of Steel Industry (TASI) which targets traditional steel business scope in
welding, casting, forging, stamping and so on has about 330 members. Nevertheless, the majority of the
e-marketplace members fall between large enterprises and SMEs under the categories of secondary
manufacturing and waste steel, which in this paper are called medium-sized enterprises, as referenced by
Birou & Fawcett (1993), Massey (2004), Tao, Ho & Yeh (2001), and Kamel & Hussein (2004). Therefore,
a broader scope of steel business considering the secondary manufacturing and the waste steel was
adopted, which added to the TASI total of over 1,000 members (MIRDC, 2001b).
The sources of the survey population include the 2002 membership records of the association of
steel industry and the two steel e-marketplaces. After screening out redundant candidates and big steel
corporations, three hundred and thirteen medium-sized enterprises that had registered as free members in
either of the two e-marketplaces remained in the list. Since the targeted population of the qualified steel
instead of further sampling a small subset for the survey.
The questionnaire was divided into three parts: 1) the company profile and status of e-marketplace
membership, 2) the importance of adoption variables, and 3) the satisfaction level of e-marketplace
experiences. Parts 2 and 3 contained questions to be answered based on a five-point Likert scale starting
with 1 for very important up to 5 for very unimportant.
4.2 Preliminary Analyses
The preliminary analyses, as described in the second step of the research method in Section 3,
include the sample inspection in Section 4.2.1, sample profile in Section 4.2.2, and user satisfaction in
Section 4.2.3.
4.2.1 Sample Inspection
As designed, the questionnaires were sent out to the total census size of three hundred and thirteen
companies, and fifty-one questionnaires returned. After removing four invalid questionnaires, the valid
response rate was calculated as 15 percent. Although this response rate seemed to be low, it was
comparable enough to other Taiwan’s studies on the manufacturing sector, such as 14.6 percent (Huarng
& Chen, 2002), 13.1 percent (Chen & Wei, 2002), 13 percent (Liang & Hung, 1997), and 16.5 percent
(Shang & Marlow, 2005) on large manufacturing enterprises, 12.6 percent (Tao, Ho & Yeh, 2001) on
medium enterprises, and 16.3 percent (Kao, Lee & Kuo, 1997) and 13 percent (Carr, Leong & Sheu, 2000)
attributed to the dramatic increase of higher education institutions from less than 30 to over 170 since the
90s, very limited sources of company directories such as Common Well magazine, China Credit
Information Services, and the Ministry of Economic Affairs, and a large portion of Taiwan’s business
category is in the manufacturing sector. Combining these factors with the fact that Taiwan’s
manufacturing enterprises, especially the SMEs and medium-sized enterprises lack adequate professionals
and skills to satisfactorily respond to the overflown survey studies, the low response rate has been noted to
be a common situation in Taiwan’s survey studies on the manufacturing sector.
Although this low response rate is common in Taiwan’s SME surveys, a further analysis was
conducted to assess whether the responding sample was biased by comparing to a random sample of 50
companies who did not respond from the base population. The comparison between the 50
non-respondent companies and the 47 respondent companies were conducted based on the employee size,
the capital, and the industry type as shown in Tables 2, 3 and 4.
As shown in the first half of Table 2, the average employee sizes were 65.5 and 60.1 while the
average capitals were 8.78 versus 6.63 (million US$) for the respondent sample and the non-respondent
sample, respectively. Since the Levene tests support equal variance assumption (employee size: F=0.812
p=0.37; capital: F=0.09, p=0.765) as shown in Table 3, we adopted the corresponding t values under the
equal-variance assumption. The null hypothesis assumes that there is no difference between the means of
either the employee size or the capital from the respondents and the non-respondents. As seen in Table 3,
difference were 10.2 and 4.08, respectively. Consequently, the t-tests (employee size: t=0.527, p=0.599;
capital: t=0.528 and p=0.599) indicated that there was no significant difference between the respondent
and the non-respondent samples. For the industry type, the second half of Table 2 lists the occurrences of
respondents and non-respondents by steel types of rolled, tube/frame, sheared, and others. Because
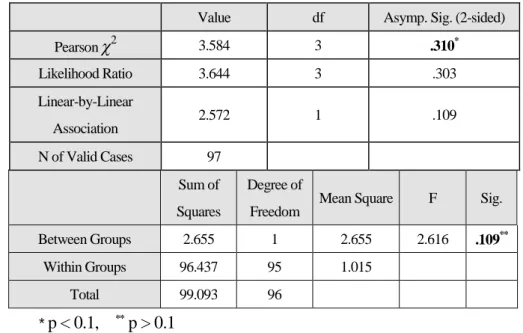
industry type is a nominal scale, the chi-square test was used to inspect the independence of responding
decision on industry type from the respondents and the non-respondents. As seen in Table 4, the result
(Pearson 2=3.584, d.f.=3, p=0.310) did not reject the indifference hypothesis. Accordingly, the above bias analyses on employee size, capital and industry type all suggested that the respondent sample was a
good representative of the targeted steel enterprises in this study.
Further investigation was conducted with a set of telephone call back. As indicated in Table 5, the
records show that 72 telephone follow-ups only resulted in 18 actual returns (25 percent), and 45 (62.4
percent) did not respond due to closing of business, business reorganization, unavailability of proper
contact personnel, and failure to return the call as agreed upon. There were only 9 (12.5 percent) who did
not feel relevant and many of them had the same reasons as the other 45, but they added their
disappointment to the e-marketplaces. According to the supporting analyses, we concluded that the
non-respondents did not indicate significant systematic bias in relation to the e-marketplaces.
4.2.2 Sample Profile
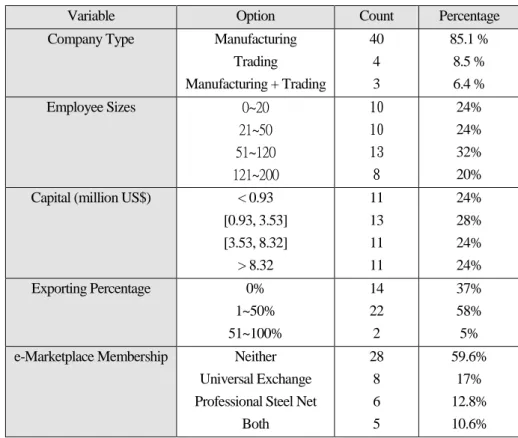
As seen in Table 6, the steel company can be classified into manufacturing (40/85.1 percent), trading
business, and most of them are in pure manufacturing business.
Among the four ranges of employee size which included 0~20, 21~50, 51~120, and 121~200, nearly
one-third of the respondents fell into the category of 51~120 people. The average employee size was 65.5
and the median was 53, which were relatively low compared to the ceiling of 200 according to Taiwan’s
SME definition. The average capital of these companies is US$8.78 million, and the median is US$6.4
million. Compared to Taiwan’s SME manufacturing standard of US$2.6 million, only 14 of the
respondents showed lower than the standard and most of the respondents were far above, which fits the
profile of a typical medium-sized enterprise as described in Sections 1 and 4.1.
Among the various exporting status, most steel enterprises fell under the categories below 50 percent
of their business. Moreover, 37 percent did not export at all, which indicates a domestic orientation among
Taiwan’s steel medium-size enterprises. This attribute of low exporting percentage matches the profile by
MIRDC (2001a). Among the respondents, 28 (59.6 percent) are not members of either steel
e-marketplaces as shown in Table 6, which is a fairly large percentage of e-marketplace dropout rate.
4.2.3 User Satisfaction
As indicated in Table 7, among the 19 current members who responded to the satisfaction part of the
questionnaire, most were negative (within the range of 3 and 3.5) in their average scores toward each of
the eight satisfaction dimensions (S2-S9). Moreover, the highest ranked dimension, “Industry
information”, only receives an extremely modest score of 2.79 (between fairly and medium satisfied),
current services provided by the two e-marketplace sites are related to “industry information”which is
indeed one demand of the steel industry (MIRDC, 2001a), it is not difficult to understand why it receives
the highest and the only positive satisfaction score. Nevertheless, this modest satisfaction level on
“industry information”dimension alone does not compensate for all other seven dimensions by the 3.16
average score on the overall (S1) satisfaction level.
As stated in Section 1, there are more critical demands that motivated these steel medium-sized
enterprises to participate in these e-marketplaces. Therefore, we further inspected the correlations between
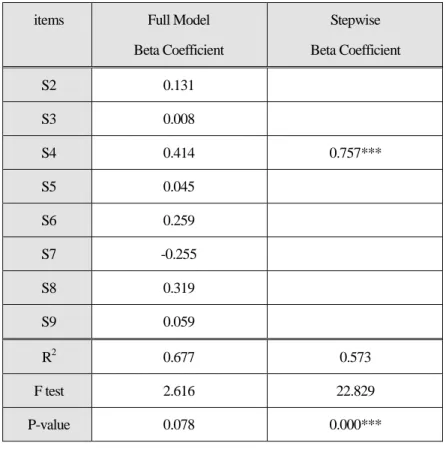
the eight single and the overall satisfaction factors by the multiple regression analysis. Results from both a
full model and a stepwise model are shown in Table 8. Although the R2 of the full model (.677) was
higher than the stepwise model (.573), only the stepwise model achieved a significant level at 0.001. In
the stepwise model, only “Auction”factor (S4) has a significant beta coefficient with regard to the overall
satisfaction level (S1). Accordingly, the overall satisfaction level will significantly increase if the
e-marketplaces can provide a better auction service, which may help the medium-sized steel enterprises
obtain lower-price products and consume overstock products as described in MIRDC (2001a). This result
again sustains our point that the two e-marketplaces simply could not satisfy the members with desirable
functionalities. However, since only nearly 60 percent of the variance is explained by this stepwise model
(R2=.573), a further analysis on discovering other factors that affect users’satisfaction is needed.
4.3 Formal Analyses
analysis of adoption factors in Section 4.3.1 and adoption decision analysis in Section 4.3.2.
4.3.1 Analysis of Adoption Factors
Kaiser-Meyer-Olkin (KMO) test for sampling adequacy and Bartlett’s test for sphericity were used to
first examine the suitability of selected adoption variables for the factor analysis (Bryman, 1989). Using
SPSS statistical software, calculations show that KMO has a 0.696 value which is larger than the
suggested minimum value of 0.5 for adequacy, and Bartlett’stest also demonstrated a very good
sphericity (2=1063.992, d.f. = 496, p < 0.000), which indicates that the 32 variables are suitable for the following factor analysis.
Before applying the factor analysis, a concern on the case-to-variable ratio needed to be addressed
first. The general rule of thumb is that at least a 5:1 ratio of case to variable is recommended when
applying the factor analysis, as seen in Hair et al. (1998) and Gorsuch (1983). However, there have been
debates regarding this issue of case-to-variable ratio, and a recent article by Roberts et al. (2001) sheds
some light to our situation. Roberts et al. claim that the rule of thumb to exploratory studies could be
loosened based on the evidences of existing references. They first enumerated 18 samples of top IS
journal articles with exploratory factor analysis below 5:1 ratio, such as Abdul-Gader & Kozar (1995)
from Management Information Systems Quarterly, and Essex, Magel & Masteller (1998) from Journal of
Management Information Systems. Among their supporting arguments are “Cattell (1988) clearly
indicates that factor analysis can be performed below that 2:1 ratio”and “Baggaley (1982) states the ratio
questionnaires are needed for satisfying the 5:1 ratio (i.e. one third of the population) is not feasible for
Taiwan’s steel manufacturing enterprises. Therefore, we still applied the factor analysis with a lower but
adequate case-to-variable ratio as supported by Roberts et al. (2001), and added this as a limitation to our
conclusion. To be safe, principle component factor analysis was adopted, which, according to McArdle
(1990) is more practical than common factor analysis in situations like low case-to-variable ratio.
In our principle component factor analysis, only those extracted factors with eigenvalues bigger than
one were selected. This demonstrates the convergent validity of the selected factors. In the end, a total of
nine factors emerged which together explains 77.6 percent of the total variance. Varimax with Kaiser
normalization was applied to ensure that the extracted factors were distinct from each other. As seen in
Table 9, most factor loadings are greater than 0.5 and this is considered “practically”significant while the
remaining five, V10, V13, V14, V16 and V20, also have “more important”loadings greater than 0.4 (Hair
et al. 1998). Therefore, the discriminant validity is thus demonstrated. Also as seen in Table 9, the nine
major factors are identified and named as internal management efficiency, market competitive advantage,
security mechanism, barrier of electronic transaction, business resource, e-marketplace trend, paying fees,
trading opportunity and authentic document.
The average scores of adoption factors were calculated and then ranked as seen in Table 10. Overall
speaking, these nine adoption factors fall into the level of importance with average scores smaller than 3.
By examining the top three adoption factors, i.e., “Barrier of Electronic Transactions”, “Authentic
cared for safety and secured transactions. On the other hand, the bottom three factors reveal that the
medium-sized steel enterprises are deemed low on basic management concerns, including cost (Paying
Fees), market share (Competitive Advantage), and management performance (Internal Management
Efficiency). The above observations imply that medium-sized steel enterprises had a high priority in
adopting e-marketplaces for the opportunity of generating actual transactions instead of regular business
values, such as cost-saving or gaining competitive advantage. This finding is similar to what Eng (2004)
concluded in his survey of U.K.’s retailer section that e-marketplace supply chain applications are more
concerned on automating transaction-based activities and procurement-related processes rather than on
strategic supply chain activities. Also, this finding matches with what the users desire in order to be satisfied,
i.e., auction (S4), transaction services (S5) and Logistics (S6) as shown in Table 7.
4.3.2 Adoption Decision Analysis
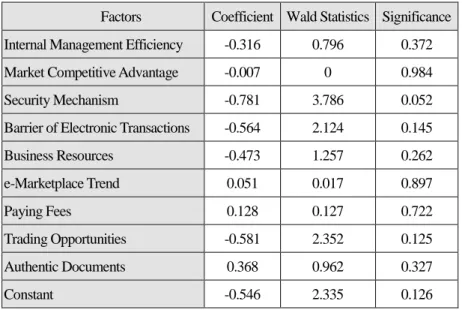
Binary logistic regression analysis was used to test whether the nine factors significantly affected the
adoption of the two steel e-marketplaces by their current membership status. The Hosmer and Lemeshow
goodness of fit test (2=8.9452, d.f.=7, significance=0.2566) as seen in Table 11 demonstrates that this logistic regression model is not significantly different from a perfect model that correctly classifies
between the members and the non-members. Also, the discriminating power is assessed by the
classification matrix as shown in Table 12, which achieves an acceptable overall classification accuracy of
68 percent.
Wald statistics was used to test the significance of the regression coefficients, which are all insignificantly
different from zeros. Meanwhile, the -2 Log likelihood (52.386) is large while both Cox & Snell R2and
Negelkerka R2are low (<0.3). Accordingly, the binary logistic regression analysis does not support the
idea that the current e-marketplace membership status is significantly affected by the extracted adoption
factors. This test result supports our view that Taiwan’s e-marketplaces failed to meet the expectation of
the medium-sized steel enterprises.
Viewing from a different perspective, Taiwan’s steel e-marketplaces, like those of Hong Kong’s and
Singapore’s, are more information-oriented, but Taiwan’s medium-sized steel enterprises expect a strong
transaction-oriented e-marketplace environment just like the ones in the U.S. Therefore, after a few years
of free membership on either e-marketplace, many medium-sized steel enterprises decreased their
participation and lowered their enthusiasm. All these complications added up to a situation where
previously perceived adoption factors were inconclusive and unable to predict the current adoption of an
e-marketplace for Taiwan’s medium-sized steel enterprises.
5. Conclusion and Implications
5.1 Limitations
As part of careful investigation, there are three research limitations identified in the conduct of this
study. First of all, because the case-to-variables ratio was only around 1.5:1 (47:32), lower than the 5:1
ratio of the general rule of thumb, the theoretically-sound common factor analysis could not be
accomplish this study. Secondly, since the initial stage of this research is exploratory in nature, some of the
failure factors that have been identified in the literature may have escaped our attention. Of all these, trust
(Gefen, 2000; Jarvenpaa, Tractinsky & Vitale, 2000; Bhattacherjee, 2002; Yousafzai et al., 2003), privacy
(Wang, Lee & Wang, 1998; Udo, 2001), and more complete coverage on security factors (Furnell &
Karweni, 1999; Kolsaker & Payne; 2002) were most notable. Finally, the eight satisfaction factors only
accounted for 60 percent of the overall variances, which means that there are other hidden factors
affecting the overall level of satisfaction.
5.2 Conclusions
We summarize the results of the research objectives listed in Section 2. First, based on the survey,
nine latent adoption factors of the Taiwan’s steel e-marketplaces were identified from 32 items.These are
1) internal management efficiency, 2) market competitive advantage, 3) security mechanism, 4) barrier of
electronic transaction, 5) business resource, 6) e-marketplace trend, 7) paying fees, 8) trading opportunity,
and 9) authentic document. From the top three and bottom three adoption factors, we found that
medium-sized steel enterprises desired an e-marketplace that generates secured and safe transactions, but
they did not care much about the conventional management concerns in cost-saving or management
efficiency. Second, a binary logistic regression analysis indicated that these originally perceived adoption
factors did not significantly reflect the current adoption status of the sample steel enterprises, thus
supporting our observation that the current e-marketplaces failed to meet the members’expectations
“Industry Information”index gained a modest satisfaction and all other seven indexes were somewhat
unsatisfied. However, “Auction Service”was the only index identified to significantly affect the overall
satisfaction. This mismatch of the satisfaction also supported our assumption that the e-marketplace
providers had not done the correct means to meet the customers’needs.
Analysis of the telephone follow-ups also revealed that steel medium-sized enterprises are not
enthusiastically concerned about e-marketplace issues as they used to. Hence, one of the marketing
challenges is to rekindle their enthusiasm on steel e-marketplace by focusing on these original adoption
factors. The highest priority of auction service is a good starting point to win back their satisfaction level.
5.3 Implication
Extending the second limitation in Section 5.1, only the security issue came out in the focus group
interview which was intended to uncover the very original adoption factors. However, security control
significantly impacts on a customer’s trust in e-commerce (Gefen, 2000; Jarvenpaa et al., 2000; Suh &
Han, 2003), and privacy protection is one component constituting the trust construct (Suh & Han, 2003)
or influence trust (Culnan & Armstrong, 1999). Furthermore, both Bauer Grether & Leach (2002) and
Luo (2002) emphasized that customer satisfaction is meant to build up customer trust over the Internet
since a higher level of uncertainty and risk exists (Grabner-Kräuter & Kaluscha, 2003). Because trust,
privacy and security are interrelated, it implies that these critical factors may need to be explicitly included
in the developmental policies of Taiwan’s steel e-Marketplace, in addition to fulfilling the member’s
Since security has been investigated in this study, we must point out that security-control
requirements are more toward the technical aspects in five categories, including authentication,
nonrepudiation, confidentiality, privacy protection and data integrity (Shu & Han, 2003) A brief
discussion on the development regarding privacy and trust follows.
Privacy affects aspects such as the obtaining, distribution or the non-authorized use of personal
information (Wang, Lee & Wang, 1998). Advances in information technologies give enterprises a great
power in manipulating personal information, therefore procedural fairness (Culnan & Armstrong, 1999)
becomes a concern to consumers and the solution relies on the collaboration between the government, the
industries and the individuals (Kruck et al., 2002). On the other hand, technical solutions for privacy
protection are also being formed. These include the technical specification, “Platform for privacy
preferences project” that was drafted in the World Wide Web (W3C) Consortium which was a
collaboration among the W3C member associations and the European Union communities (Moghe, 2003)
for a wider implementation of privacy protection.
Trust is most frequently cited as “the willingness of a party to be vulnerable to the actions of another
party based on the expectation that the other will perform a particular action important to the trustor,
irrespective of the ability to monitor or control that other party”(Mayer et al., 1995). Examples of diverse
trust studies include the study conducted by Luo (2002) who proposed a framework based on relationship
marketing and social exchange theory to increase customer’s trust of e-commerce and decrease privacy
e-Products and e-Services. Lee & Turban (2001) developed a theoretical model for investigating the four
main antecedent influences on consumer trust in Internet shopping. Recognizing the lack of consensus
about the meaning of trust in different disciplines, Grabner-Kräuter & Kaluscha (2003) facilitated a
multi-level and multi-dimensional analysis of research problems related to trust in e-commerce.
Consequently, developing a trust mechanism in an EC environment will be a great challenge for
e-marketplace providers.
Based on the implication and corresponding brief explanations, we know that for an e-marketplace to
succeed, good developmental policies and strategies on security, privacy and trust are as critical as
satisfying customers’desirable adoption factors.
References
Abdul-Gader, A. H., & Kozar, K. A. (1995) The impact of computer alienation on information technology
investment decisions: An exploratory cross national analysis. Management Information Systems
Quarterly,19(4), 535-559.
Baggaley, A. R. (1982) Deciding on the ratio of the number of subjects to the number of variables in
factor analysis. Multivariate Experimental Clinical Research, 6(2), 81-85.
Bauer, H., Grether, M., & Leach, M. (2002) Building customer relations over the internet. Industrial
Marking Management, 31, 155-163.
Management Information Systems,19(1), 211-241.
Birou, L. M., & Fawcett, S. E. (1993, April). International purchasing: benefits, requirements, and
challenges. International Journal of Purchasing Materials Management, 29(2), 28-37.
Brunn, P., Jensen, M., & Skovgaard, J. (2002). E-marketplaces: crafting a winning strategy. European
Management Journal, 20(3), 286-298.
Bryman, A. (1989) Research methods and organizational studies, London: Unwin Hyman.
Büyüközkan, G. (2004). Multi-criteria decision making for e-marketplace selection. Internet Research,
14(2), 139-154.
Carr, A. S., Leong, G. K., & Sheu, C. (2000). A study of purchasing practices in Taiwan. International
Journal of Operations & Production Management, 20(12),1427-1445.
Cattell, R.B. (1988) The meaning and strategic use of factor analysis. Handbook of Multivariate
Experimental Psychology, J.R. Nesselroade and R.B. Cattell eds.
CommerceNet (2000). Barriers to electronic commerce, 3-5.
Chen, S.-P., & Wei, T.-S. (2002). The practice of operational research in Taiwan. Journal of the
Operational Research Society, 53(12), 1330–1337.
Culnan, M. J., & Armstrong, P. K. (1999). Information privacy concerns, procedural fairness, and
impersonal trust: an empirical investigation. Organization Science, 10(1), 104-116.
Daniel, E. M., Hoxmeier, J., White, A., & Smart, A (2004). A framework for the sustainability of
Davis, F. D. (1989). Perceived usefulness, perceived case of use and user acceptance of information
technology. Management information Systems Quarterly, 13, 319-340.
De Figueriredo, J. M. (2000, summer). Finding sustainable profitability in electronic commerce. Sloan
Management Review, 41(4), 41-52.
Deloitte Consulting (2000). Development and trend of eMarketplace. E-Business Executive Report, 19,
12-13.
Detourn, N., Fischer, J., & Larson, P. (2000, March). B2B e-commerce - The dawning of a trillion-dollar
industry. The Motley Fool’s Internet Research, 11-12.
Eng, T.-Y. (2004). The role of e-marketplaces in supply chain management. Industrial Marketing
Management, 33(2), 97-105.
Essex, P., Magel, S.R., & Masteller, D. E. (1998). Determinants of information center success. Journal of
Management Information Systems, 15(2), 95-117.
Furnell, S. M., & Karweni, T. (1999). Security implications of electronic commerce: A survey of
consumers and business. Internet Research, 9(5), 372–382.
Gebauer, J. (1996, September). Electronic market from an economic perspective. 2nd International
Workshop on Electronic Markets, University of St. Gallen, Ermatingen, Switzerland.
Gefen, D. (2000). E-commerce: the role of familiarity and trust. Omega, 28(6), 725-737.
Gefen, D., & Straub, D. W. (2004). Consumer trust in B2C e-commerce and the importance of social
Gorsuch, R. L. (1983) Factor Analysis. Hilsdale, NJ: Lawrence Erlbaum.
Gottschalk, P., & Abrahamsen, A. F. (2001). Plans to utilize electronic marketplaces: the case of B2B
procurement markets in Norway. Industrial Management & Data Systems, 102(6), 325-331.
Grabner-Kräuter, S., & Kaluscha, E. A. (2003). Empirical research in online trust: A review and critical
assessment. International Journal Human-Computer Studies, 58(6), 783-812.
Grewal, R., Comer, J. M., & Mehta, R. (2001) An investigation into the antecedents of organizational
participation in business-to-business electronic markets. Journal of Marketing, 65(3), 17-33.
Hair, J. F. Jr., Anderson, R. E., Tatham, R. L. and Black, W. G.. (1998). Multivariate Data Analysis, 5theds,
London, UK: Prentice-Hall International.
Hsiao, R.-L. (2003). Technology fears: Distrust and cultural persistence in electronic marketplace
adoption. The Journal of Strategic Information Systems, 12(3), 169-199.
Hsu, G. (2001). Business Model Analysis of the B2B Electronic Marketplace, unpublished Master Thesis,
Department of International Business, National Taiwan University, R.O.C.
Huarng, F., & Chen, Y.-T. (2002). Relationships of TQM philosophy, methods and performance: A survey
in Taiwan. Industrial Management and Data Systems, 102(4), 226-234.
IDB (2001). WWW for Civil Services of Doc, http://www.moea.gov.tw/, Industrial Development Bureau,
Ministry of Economic Affairs.
Jarvenpaa, S., Tractinsky, N., & Vitale, M. (2000). Consumer trust in an internet store. Information
Kamel, S., & Hussein, M. (2004). King hotel goes online: The case of a medium enterprise in using
eCommerce. Journal of Electronic Commerce in Organizations, 2(4), 101-115.
Kao, C., Lee, T.-Z., & Kuo, S. (1997). Career paths in industrial management: A survey of Taiwan's
manufacturing industries. Career Development International, 2(4), 189-194.
Kaplan, S., & Sawhney, M. (2000, May-Jun). E-hub: the new B2B marketplace. Harvard Business
Review, 97-103.
Kendall, J. (2001). Electronic commerce adoption by SMEs in Singapore. in Proceedings of the 34th
Hawaii International Conference on System Sciences.
King, R. C., & Gribbins, M. L. (2003). Adoption of organizational internet technology: Can current
technology adoption models explain web adoption strategies in small & mid-sized organizations?
International Journal of Management Theory and Practices, 4(4), 49-61.
Kruck, S.E., Gottovi, D., Moghadami, F., Broom, R., & Forcht, K.A. (2002). Protecting personal privacy
on the internet. Information Management & Computer Security, 10(2), 77-84.
Kolsaker, A., & Payne, C. (2002). Engendering trust in e-commerce: A study of gender-based concerns.
Marketing Intelligence and Planning, 20(4), 206-214.
Kuan, K. Y. K., & Chau, P. Y. K. (2001). A perception-based model for EDI adoption in small business
using a technology-organizational-environment framework. Information & Management, 38(8),
507-521.
International Review of Financial Analysis, 8(2), 97–121.
Laseter, T., Long, B., & Capers, C. (2001). B2B Benchmark: The State of Electronic Exchanges, McLean,
VA: Booz Allen and Hamiliton.
Lee, M. K. O., & Turban, E. (2001). A trust model for consumer internet shopping. International Journal
of Electronic Commerce, 6(1), 75-91.
Liang, T.-P., & Hung, S.-Y. (1997). DSS and EIS applications in Taiwan. Information Technology &
People, 10(4), 303-315.
Lin, Y.-H. (2001). The Study on Relationships among Adoption Factors, Implementation Degree, and
Implementation Performance of e-Marketplace, unpublished Master Thesis, Tam-Kiang University,
Taiwan, R.O.C..
Lundblad, J. P. (2003). A review and critique of Rogers’diffusion of innovation theory as it applies to
organizations. Organization Development Journal, 21(4), 50-64.
Luo, X. (2002). Trust production and privacy concerns on the internet: A framework based on relationship
marketing and social exchange theory. Industrial Marketing Management, 31(2), 111-118.
Massey, C. (2004). Employee practices in New Zealand SMEs. Employee Relations, 26(1), 94-105.
Mayer, R. C., Davis, J. H., & Schoorman, F. D. (1995). An integrative model of organizational trust.
Academy of Management Review, 20(3), 709-739.
McKinsey & Company (2000). Coming in to focus using the lens of economic value to clarify the impact
MIRDC (2001a). Menu for electronic manufacturing environment - Steel industry. Metal Industries
Research and Development Center, http://www.ecos.org.tw/include/getfile.php?fid=287.
MIRDC (2001b), Steel Industry Almanac, Metal Industries Research and Development Center.
Mcardle, J. (1990). Principles versus principals of structural factor analyses. Multivariate Behavioral
Research, 25(1), 81-87.
Moghe, V. (2003). Privacy management -A new era in the Australian business environment. Information
Management & Computer Security, 11(2), 60-66.
Piccinelli, G. G., Vitantonio, D., & Mokrushin, L. (2001). Dynamic service aggregation in electronic
marketplaces. Computer Networks, 37(2), 95-109.
PricewaterhouseCoopers (1999). SME electronic commerce study. Asia Pacific Economic Cooperation,
3-4 & 12.
Roberts, T. L. Jr., Gibson, Jr. M. L., Rainer, R. K., Jr., & Fields, K. T. (2001). Responseto ‘comments on
factors that impact the implementation of a systems development methodology’. IEEE Transactions
on Software Engineering, 27(3), 282-286.
Rogers, E. M. (1995). Diffusion of Innovations, 4thedition, New York: Free press.
Sarker, S., Valacich, J. S., & Sarker, S. (2003). Virtual team trust: instrument development and validation
in an IS educational environment. Information Resources Management Journal, 16(2), 35-55.
Scott, D., & Shieff, D. (1993). Service quality components and group criteria in local government.
Schneider, G. P., & Perry, J. T. (2003), Electronic Commerce, 4theds., Course Technology.
Sculley, A. B., & Woods, W.A. (2001). B2B Exchange: the killer application in the business-to-business
Internet revolution, New York, NY: Harper Collins.
Shang, K.-C., & Marlow, P. B. (2005). Logistics capability and performance in Taiwan’s major
manufacturing firms. Transportation Research Part E , 41, 217–234.
Smart, A., & Harrison, A. (2001). Online reverse auctions and their impact on buyer-supplier
relationships, in review.
SMEA (2000-2002). White paper report of small and medium enterprises. Small and Medium Enterprises
Administration, Ministry of Economic Affairs, http://www.moeasmea.gov.tw.
Stockdale, R., & Standing, C. (2002). A framework for the selection of electronic marketplaces: a content
analysis approach. Internet Research, 12(3), 221-234.
Stockdale, R., & Standing, C. (2004). Benefits and barriers of electronic marketplace participation: an
SME perspective. Journal of Enterprise Information Management, 17(4), 301-311.
Suh, B., & Han, I. (2003). The impact of customer trust and perception of security control on the
acceptance of electronic commerce. International Journal of Electronic Commerce, 7(3), 135-161.
Tao, Y., Ho, I., & Yeh, R. (2001). Building a user-based model for web executive learning systems-A
study of Taiwan's medium manufacturing companies. Computers & Education, 36(4), 317-332.
Tsang, S.-W. (2002, November 12). Electronic marketplaces: Three times of growth three years later.
Udo, G. (2001). Privacy and security concerns as major barriers for e-commerce: A survey study.
Information Management & Computer Security, 9(4), 165-174.
Wang, H., Lee, M., & Wang, C. (1998). Consumer privacy concerns about internet marketing.
Communications of the ACM, 41, 63–70.
Weller, T.C. (2000, Spring). B to B eCommerce- The risk of eMarketplace. Legg Mason Equity Research,
p. 8.
Yasin, M., Correia, E., & Lisboa, J. (2004). The profitability of customer-targeted quality improvement
efforts: An empirical examination. The TQM Magazine, 16(1), 45-49.
Yousafzai, S., Pallister, Y., Foxall, J. G.., & Gordon, R. (2003). A proposed model of e-trust for electronic
banking. Technovation, 23(11), 847–860.
Yuan, J.-K. (2001). AnEmpiricalStudy:FactorsAffecting Taiwan’sLeadingManufacturers in Adopting
Steel e-Marketplace Adoption Variables
Sample Profile
Sample Inspection O1:Adopting Factors
O2:User Satisfaction O3:Adopting Decision 1. Adoption Variables 2. Preliminary Analyses 3. Formal Analyses •Literature Review •Focus Group Interview •T-test •Descriptive Analysis •Multiple Regression •Factor Analysis •Descriptive Analysis •Binary Logistic Analysis
Table 1 Adoption Variables (Translated from Chinese)
Adoption Variables V1. Increasing business publicity
V2. Shortening A/P collecting length V3. Stimulating business changes V4. Increasing credit limit
V5. Building decision efficiency with gains in formation V6. Emerging trend of e-commerce
V7. Membership fees V8. Support of e-business
V9. Qualified employees and equipments V10. Stability of buyers and suppliers V11. Opportunities for foreign trades V12. Compatibility of computer systems
V13. Uncertainty of Internet V14. Fair Web bid
V15. Authority of human signature V16. Completeness of e-marketplace laws V17. Safety of money flow
V18 Inventory information leaks V19. Value-added services
V20. Differences between specification and actual product
V21. Appropriateness of Web steel trading V22. Perfection of money and product flows V23. Human manipulations of e-marketplace V24. Government interfering marketplace V25. Forming business advantage
V26. Reducing product inventory V27. Reducing transaction cost V28. Collaborative opportunity
V29. Equal-opportunity of platform V30. Reducing human mistakes
V31. Integrated industry and procurement V32. Transaction service fees
Table 2 Statistics of Respondents versus Non-Respondents Statistics Category Number of Company Average Standard Deviation Standard Error of the Average Respondent 41 65.5 51.0 8.0 Employee Size Non-respondent 50 60.1 46.5 6.6 Respondent 46 8.78 19.23 2.67 Capital
(million US$) Non-respondent 50 6.63 20.60 2.91
Statistics Industry Type Number of Companies Percentage (%) Respondent 16 34 Rolled Non-respondent 10 20 Respondent 12 25.5 Tube/Framed Non-respondent 15 30 Respondent 15 31.9 Sheered Non-respondent 16 32 Respondent 4 8.6 Others Non-respondent 9 18
Table 3 Equivalent Sample Test for Respondents vs. Non-respondents on Employee Size and Capital
Levene Test for Equal Variance
t-Test for Equivalent Averages Statistics Category F Test Sig. t Level. t-value Degree of freedom Sig. Level (Two-Tailed) Average Difference Std. Error of Difference E. V. Assumption 0.812 0.37 0.527 89 0.599* 5.4 10.2 Employee
Size Un -E.V. Assumption 0.522 82.018 0.603 5.4 10.3
E. V. Assumption 0.09 0.765 0.528 94 0.599* 2.15 4.08
Capital
Un-E.V. Assumption 0.529 93.978 0.598 2.15 4.07
Table 4 Equivalent Sample Test for Respondents vs. Non-respondents on Industry Type
Value df Asymp. Sig. (2-sided)
Pearson2 3.584 3 .310* Likelihood Ratio 3.644 3 .303 Linear-by-Linear Association 2.572 1 .109 N of Valid Cases 97 Sum of Squares Degree of
Freedom Mean Square F Sig.
Between Groups 2.655 1 2.655 2.616 .109**
Within Groups 96.437 95 1.015
Total 99.093 96
*p < 0.1, **p > 0.1
Table 5 Questionnaire Follow-up Analysis
Statistics
Item Number of Companies Ratio
Returned 18 25%
Empty number or closed 8 11.1%
Too busy or no proper person to fill out the questionnaire
9 12.5%
Organization downsized 5 6.9%
Not fulfilling the promise 23 31.9%
Not relevant to the company 9 12.5%
Not Returned
Sub Total 54 (100%) 75%
Table 6 Profile of the Respondents
Variable Option Count Percentage
Company Type Manufacturing 40 85.1 %
Trading 4 8.5 % Manufacturing + Trading 3 6.4 % Employee Sizes 0~20 10 24% 21~50 10 24% 51~120 13 32% 121~200 8 20%
Capital (million US$) < 0.93 11 24%
[0.93, 3.53] 13 28% [3.53, 8.32] 11 24% > 8.32 11 24% Exporting Percentage 0% 14 37% 1~50% 22 58% 51~100% 2 5%
e-Marketplace Membership Neither 28 59.6%
Universal Exchange 8 17%
Professional Steel Net 6 12.8%
Both 5 10.6%
Table 7 Satisfaction Analysis of e-Marketplace
Frequency of Satisfaction Level Aggregation Statistics
Dimension Very(1) Fairly(2) Medium(3) Un-(4) Very Un- Average* Rank(5)
S1 Overall 0 5 6 8 0 3.16 3 S2 Industry Information 0 7 9 3 0 2.79 1 S3 Catalog Management 0 4 10 4 1 3.11 2 S4 Auction 0 2 8 8 1 3.42 6 S5 Transaction Services 0 3 11 4 1 3.16 3 S6 Logistics 0 2 9 6 2 3.42 6 S7 Back-Office Integration 0 0 13 4 2 3.42 6
S8 Supply Chain Management 0 0 12 6 1 3.42 6
S9 Value-Added Services 0 2 10 6 1 3.32 5
Table 8 Multiple Regression Analysis of Satisfaction Factors
items Full Model
Beta Coefficient Stepwise Beta Coefficient S2 0.131 S3 0.008 S4 0.414 0.757*** S5 0.045 S6 0.259 S7 -0.255 S8 0.319 S9 0.059 R2 0.677 0.573 F test 2.616 22.829 P-value 0.078 0.000*** *p<0.05 **p<0.01 ***p<0.001
Table 9 Adoption Variables and Factors with Loadings
Internal Management Efficiency Security Mechanism V2 (0.788), V4 (0.735), V5 (0.617),
V3 (0.602), V30 (0.598), V1 (0.579)
V29 (0.716), V17 (0.671), V21 (0.615), V12 (0.555), V16 (0.488)
Market Competitive Advantage Barrier of Electronic Transactions V25 (0.779), V26 (0.753),
V27 (0.743), V28 (0.73)
V22 (0.808), V18 (0.736), V23. (0.582), V20. (0.476) Business Resources e-Marketplace Trend
V6 (0.811), V19 (0.531) Paying Fees V9 (0.727), V31 (0.617), V8 (0.599),
V24 (0.594), V14 (0.411)
V7 (0.796),V32 (0.778) Trading Opportunities Authentic Documents V11 (0.83),V10 (0.452) V15 (0.86), V13 (0.412)
Table 10 Averages and Ranks of Adoption Factors
Adoption Factors Average* Rank
Barrier of Electronic Transactions 1.91 1
Authentic Documents 2.07 2
Security Mechanism 2.08 3
Business Resources 2.35 4
e-Marketplace Trend 2.39 5
Trading Opportunities 2.58 6
Market Competitive Advantage 2.59 7
Paying Fees 2.73 8
Internal Management Efficiency 2.95 9 * 1 for very important and 5 for very unimportant
Table 11 Results of Binary Logistic Regressiona
Factors Coefficient Wald Statistics Significance Internal Management Efficiency -0.316 0.796 0.372 Market Competitive Advantage -0.007 0 0.984
Security Mechanism -0.781 3.786 0.052
Barrier of Electronic Transactions -0.564 2.124 0.145
Business Resources -0.473 1.257 0.262 e-Marketplace Trend 0.051 0.017 0.897 Paying Fees 0.128 0.127 0.722 Trading Opportunities -0.581 2.352 0.125 Authentic Documents 0.368 0.962 0.327 Constant -0.546 2.335 0.126 a
-2 Log likelihood =52.368; Cox & Snell R2=.210, Nagelkerke R2=.283 Goodness of Fit = 8.9452 (d.f.=7), significance=0.2566
Table 12 Classification Matrix of the Logistic Regression
Predicted
Observed Non-Adopters Adopters % correct
Non-Adopters 21 7 75%
Adopters 8 11 57.89%