國立交通大學
管理科學系碩士班
碩士論文
公債市場之動態相關分析-以 DCC 模型為研究方
法
Dynamic Correlation Analysis of Sovereign Debts
with the Dynamic Conditional Correlation Model
研 究 生: 游志勤
指導教授:周雨田 教授
謝國文 教授
公債市場之動態相關分析-以 DCC 模型為研究方
法
Dynamic Correlation Analysis of Sovereign Debts
with the Dynamic Conditional Correlation Model
研 究 生:游志勤 Student:Chih-Chin Yu
指導教授:周雨田 教授 Advisor:Dr. Ray Yeutien Chou
謝國文 教授 Dr. Gwowen Shieh
國 立 交 通 大 學
管 理 科 學 系
碩 士 論 文
A Thesis
Submitted to Department of Management Science College of Management
National Chiao Tung University in Partial Fulfillment of the Requirements
for the Degree of Master
in
Management Science
June 2008
Hsinchu, Taiwan, Republic of China
I
公債市場之動態相關分析-以 DCC 模型為研究方
法
研究生:游志勤 指導教授:周雨田 教授
謝國文 教授
國立交通大學管理科學系碩士班
摘 要
本篇論文利用Engel (2002)提出的DCC模型及廖維苡(2008)所提出的 DCCX 模型分析公債市場的動態信用風險相關性。本文分別使用日 本、香港、南韓、泰國、台灣及美國等六國公債市場的信用價差週資 料來衡量公債市場信用風險的狀況,並加入了芝加哥選擇權交易所 (CBOE)的波動性指數(VIX)做為市場不確定性的代理變數。樣本期間 從2000/11/1至2008/2/20。DCC模型估計結果證實公債市場之間相關具 有時變的現象,且DCCX 模型的結果顯示市場不確定性會對於公債市 場的信用相關程度產生顯著的影響,當不確定性增加時,風險的相關 程度也會提高。因此在分析債券市場風險以及風險分散上,投資人可 藉由觀察VIX的波動判斷市場間連結的變化。本篇論文的研究結果可 為投資人資產配置及投資決策的一個參考依據。 關鍵詞:信用價差、DCC 模型、公債II
Dynamic Correlation Analysis of Sovereign Debts
with the Dynamic Conditional Correlation Model
Student:Chih-Chin Yu Advisor:Dr. Ray Yeutien Chou
Dr. Gwowen Shieh
Institute of Management Science
National Chiao Tung University
ABSTRACT
This paper investigates the dynamic correlation of credit risk of sovereign debts by the DCC model and the DCCX model. We use the credit spread as the proxy for credit risk. The credit spread data are 10-year sovereign bond yield of the US and five Asia countries – Japan, Hong Kong, South Korea (henceforth Korea), Thailand, and Taiwan – relative to the US 1-year treasury yield. Furthermore, we take CBOE volatility index (VIX) as the measurement of market uncertainty. The data begin on 2000/11/1 and end on 2008/2/20. The estimation by the DCC model indicates the time-varying correlation between credit spreads. The results also show that the market uncertainty has significant impact on the correlations. That is, the credit correlations between countries increase when the uncertainty of financial markets rise. International investors could estimate the connection of debt markets by investigating the variation of VIX. Our empirical results contribute to the management of asset allocation and the diversification of risks.
III
誌謝
這篇論文的完成要感謝的人太多了,首先感謝周雨田老師不辭辛勞的
教誨,不僅給了我許多研究上的啟發和指導,老師豐富的涵養也激勵
我在未來不斷精進自己,成為一個對社會有貢獻的一份子,此外也感
謝謝國文老師的指教和建議。另外,感謝一起作研究的同學們,謝謝
他們的協助和包容,一點一滴陪我累積每一個章節,在討論及日常談
話中,他們的開朗也紓解了寫作期間的壓力。最後要感謝的我的家人
以及時常陪在我身邊的同學、朋友,因為他們長久的支持讓我毫無顧
慮的專心地在課業上。
IV Table of Contents 中文摘要... I ABSTRACT ... II 誌謝 ………..III Table of Contents ... IV List of Tables ... V List of Figures ... V I. Introduction ... 1
II. Literature Review... 6
2.1. The modeling of credit spread ... 7
2.2. Cross-market hedge... 9
2.3. The Development of the Methodologies-Dynamic Conditional Correlation model ………..14
III. Methods... 17
3.1. The Dynamic Conditional Correlation (DCC) Model... 17
3.2. The Modified Dynamic Conditional Correlation (DCCX) Model ... 20
IV. Results ... 25
4.1. Sample ... 25
4.2. Descriptive statistics ... 26
4.3. Empirical analysis ... 28
4.4. Joint volatility and correlation dynamics ... 32
4.5. Implication in international diversification ... 33
V. Conclusion ... 36
V
List of Tables
Table 1 Descriptive Statistics ………..41 Table 2 Two Stage Estimation of the DCC and DCCX Models……..…….….……..43 Table 3 Investigation of Credit spread Correlations by Regressions……….. 46 Table 4 Average correlation between volatility and correlation ………...48 Table 5 The minimum-variance portfolio of Asia and US debts………...……..49
List of Figures
Figure 1 Credit spreads and changes of five Asia countries and US……….…….50 Figure 2 Credit spread correlation with DCCX ………..………..52 Figure 3 Average credit spreads correlation with DCCX ……….……...54
1
I. Introduction
Credit risk management has long been considered an important issue since the
world financial markets started to grow and integrate. Investigation of credit quality is
based on inspection of the credit or finance history from financial statements and
historical data. Furthermore, because of the improvement of information transmission
and closer trading relationship between countries, the contagion effect between
financial markets has become worldwide and significant over time. That is, shock
originating from one market actually transmits to other markets, which makes the
credit management more complicated. Therefore, the credit risk correlations, which
are the dependence among risks, become important issues in the research of risk
management. The purpose of this study is to explore the credit risk relations among
debt markets and to explain how the relations vary over time.
The sovereign debt markets provide high-quality data sources for the measurement
of credit risk. Investigating price and yields involves a more quantitative analysis of
credit quality characteristics. According to Bank of International Settlement, the total
size of government bond markets had grown from 24,154.2 billion in 2006 to
26,200.7 billion dollars in September, 2007. Particularly, the Asia local currency
2
2007. Although debt credit contagion has a great impact on construction of
credit-sensitive portfolios for the banking and investment management (see Zhou,
2001), it is a source of substantial instability. The observation of price and credit
spread change of bonds directly recovers the credit variation. Theoretically, credit
spread is always viewed as a measurement of credit risk for debt (Manzoni, 2002).
There have been a lot of researches on the determinants of bond price and yield,
especially on bond return and credit spread. Taking credit spread for example,
macroeconomic and financial variables, such as GDP growth, inflation and stock
market return, are considered crucial factors of credit spread change (see
Collin-Dufresne, Goldstein and Martin, 2001).
The objectives of this study are to investigate the credit risk correlations among
sovereign debts and the factors associated with the correlation of debts issued by
sovereigns. To our knowledge, the phenomenon of contagion among financial
markets is obvious that the crisis from one country may be triggered or extends to
others. Suggested by existing literatures, credit risk is closely connected with the
financial market uncertainty which could be reflected by the implied volatility of
stock. Also, the importance of stock volatility on credit spread at the aggregate level
has also been discussed extensively in the literature (see Cambell and Ammer, 1993).
3
world factors because the US financial markets have great influence on emerging
countries. For our purpose of analysis credit risk correlation, the financial markets
factors from the US are adopted. Thus, the implied volatility from equity index
options, specifically the Chicago Board Options Exchange Volatility Index
(henceforth VIX), is used to measure the uncertainty of financial market and its
influence on the credit spreads correlations.
Since the credit spread, like default rate, shows to be not constant over time (see
Dungey, Martin and Pagan, 2000), it requires an approach which is capable of
capturing time-varying behavior of credit spread as well as the exogenous variables.
For the past few years, the GARCH family models have been used widely in
time-series studies. Engle (2002) proposed the dynamic conditional correlation model
(the DCC model), which is modification of multivariate GARCH model, to study
dynamic correlation between assets. In our study, we also adopt the modified DCC
model, called DCCX model, proposed by Liao (2008). This model allows adding an
exogenous variable while we estimate conditional correlation. As we described in
previous paragraph, the exogenous variable is VIX as measurement of market
uncertainty to investigate the variation of correlations (see Connolly, Stivers and Sun,
4
This paper provides a new perspective and methodology to analyze credit spread.
Credit spread is always considered a proxy for credit risk, which had been use to
estimation the credit correlation between markets. However, this is the first research
to investigate the dynamic relation between credit spreads and also the determinants.
The empirical results of our study present that there are dynamic correlations among
Asian debts markets and among those with the US. The standard and modified DCC
models provide estimation of dynamic correlations and help explain for the major
economic issues. The results from the DCCX model show that the credit correlation
tends to be positively related with VIX. That is, the debts markets connect closer
when crisis occurs and economic events happen. Works on credit correlation are
beneficial from preventing asset value loss on one side and from well diversifying risk
of portfolio on the other side. The results will assist those responsible for managing
the risks of sovereign debt as well as diversifying portfolio assets allocation. Besides,
investors would benefit from consideration of market uncertainty while they analyze
credit risk and make decisions.
The remainder of this paper proceeds as follows. The relevant literatures about
credit risk, cross-market hedge and methods are reviewed in section II. In section III,
we provide the methodology applied in our study. It includes DCC and DCCX
5
and discussion of estimations are listed in section IV. The conclusion is given in the
last part of Section V.
6 II. Literature Review
In this section we provide a review of literatures related to objectives and methods
of our research. Baig and Goldfajn (1999) study the correlation between Asian
countries respective equity and sovereign bonds markets, testing if the correlations in
various markets increase significantly during the crisis period. The credit spreads over
U.S. Treasury bill yield for Indonesia, Korea, Malaysia, Philippines, and Thailand is
taken as proxies for credit risk. The results indicate the cross-country correlations are
extremely significant. Also, there is a significant increase in correlation coefficients
during the Asian crisis, concluding that there was a contagion effect among the Asian
debt markets. It suggests that sovereign debt markets are more prone to be driven by
contagion factors.
In sight of Baig and Goldfajn (1999), this section is divided into three parts. First,
we review the papers work on modeling the credit spread of debt, as the measurement
of credit risk. The second part is about the papers modeling credit relation between
markets and determinant related to the relations. The last part is about literatures of
GARCH family models, including the DCC and the DCCX model, and their empirical
7 2.1. The modeling of credit spread
The most of credit spread variation is related to credit risk of debts. Investors
require a higher premium for the riskier debts so the debts with more risky have
higher yields and also spreads. Cantor and Packer (1996) investigate the impact of
sovereign rating announcements-the risk assessment assigned by credit rating
agencies-on credit spreads of sovereign bonds. A regression of the log of these countries’ bond spreads against their average ratings, which explain 92 percent of variation, shows that ratings have considerable power to explain sovereign credit
spreads. The sovereign spreads tend to increase when ratings decline. Other factors
related to credit spread are macroeconomics variables and shocks from stock market.
In the recent finance-related literatures, much attention have been drawn to models
of the credit spreads (see Elton, Gruber, Agrawal and Mann, 2001). Collin-Dufresne,
Goldstein and Martin (2001) investigate the determinants of credit spread changes of
corporate bonds. They assume that the debt is like a short position in a put option
whose values increase with volatility measured by VIX. This prediction is that
increased volatility increases the probability of default. The result of this study
propose factors, such as changes in the spot rate, changes in the slope of the yield
curve, changes in volatility, and changes in the business climate, have ability to
8
on credit spread: an increase in volatility has a great impact on spreads while a
decrease does not.
There are also papers which study about the determinants of sovereign bonds.
Duffie, Pedersen and Singleton (2003) study the determinants of the Russian debt
credit spread, the yield differential across different Russian bonds. The credit spread
of Russian spreads were high in 1995 when there are significant uncertainty regarding
its ability to repay the debt and also high until the default in August, 1998. They find
that Russian credit spreads vary over time, respond to political events, and are
negatively related to Russian foreign currency reserves and the oil price.
Westphalen (2001) investigates the determinants of credit spread changes of
sovereign bonds by regression. The historic volatility over the last 20 trading days of
the local MSCI country stock index is a proxy for the volatility. For different
countries, the explanations of regressions are ranged from 10.8% for Emerging
Europe to 21.5% for Africa. The rating classes, one of the variables in the regression,
can explain more variation in the long- term bonds than in the short-term bonds. That
is, the factors related to credit spread are different based on credit risk. Also, changes
in local stock market volatility, proxy for change in the volatility of country, have a
significantly positive effect on the spreads of sovereign bonds. It suggests that higher
9
The variation of credit spread is not constant overtime. Most of the models cannot
explain the time-series behavior of credit spreads (see Cooper and Mello, 1988).
Dungey, Martin and Pagan (2000) and Manzoni (2002) use time-varying volatility
model to capture behavior of credit spread. Dungey, Martin and Pagan (2000) take
AR (2)-GARCH (1, 1) and factor model to model credit spreads of sovereign debts
and their latent factors. All countries feature strong positive autocorrelation and
persistence of volatility to shocks. Furthermore, they find that the world factor has
dominant influence on sovereign spreads when it comes to factor model. For example,
the world factor accounts for nearly 90% of total volatility for Germany, Canada and
the UK, which indicate world financial factor has a great impact on credit spreads.
Manzoni (2002) follows time-series approach to study sterling Eurobonds credit
spreads and the force drives the change and volatility of credit spread. The time-series
properties of credit spread provide strong evidence of nonlinearities. Also, the
macroeconomic and financial factors have driven changes in the sterling Eurobond
credit spreads. Particularly, the return and volatility from stock market carries
significant influence on credit spreads.
2.2. Cross-market hedge
To our knowledge, the correlation between markets in Asia is proved by several
10
Asia bond markets to indicate that international correlation increase in the periods of
high market volatility and strongly affected by national factors. Studying for crisis,
Masih and Masih (1997) present the fact that the correlation of the international
markets revealed obviously after the crash of the New York Stock Exchange in 1987,
the financial crisis in Mexico in 1994 and the Asian Financial Storm from 1997 to
1998. Baig and Goldfajn (1999) also show the significant correlation among Asia
stock, currency, and bond markets.
Chiang, Jeon and Li (2007) investigate the stock market contagion in eight Asian
countries and the US as well. The results show significant contagion effects that the
correlations for any pairs of countries increase after Asian crisis. According to the
results, the gain from international diversification by holding a portfolio consisting of
diverse stocks from these contagion countries declines since these stock markets are
commonly exposed to systematic risk. Also, this study suggests that both investors
and international rating agents play significant roles in shaping the structure of
dynamic correlations in the Asia markets.
Moreover, in recent studies, the cross-market credit correlation is studied for
construction of portfolios and international investment. The literatures suggest that the
credit correlation exists under certain situations and has some characteristics. For
11
than those in different industries (regions). Zhou (2001) develops a model to calculate
default correlation and joint default probability of two firms to calculate the
probability of a two-dimensional stochastic process passing a boundary. The model
theoretically implies that the high credit quality implies a low default correlation
which is consistent with the well-known empirical feature regarding the relation
between default correlation and credit ratings. Also, the default correlation and the asset level correlation are positive related. That’s why firms in the same industry (region) often have higher default correlations than those in different industries
(regions). Also, because the time of peak default correlation depends on the credit
quality of the underlying firms which is time-varying, the default correlation is
dynamic. Loffler (2003) estimates default correlation based on the joint distribution of
assets values and shows similar results.
The Latin American and Asian countries credit correlation is worth focusing on
because those emerging countries are more risky than developed countries. Cowan
and Cowan (2004) suggest that it is more worthwhile to focus on the lower grade
portfolios which are sensitive to changes in default correlations. Furthermore, the
magnitude of default correlation increases as the internally assigned risk grade
declines. They study the credit correlation of subprime lenders under loan portfolio,
12 lenders with higher credit spread.
To figure out factors related to credit quality, Weigel and Gemmill (2006) have
extracted the distance-to-default implied by bond prices, for Argentina, Brazil,
Mexico and Venezuela, to investigate the impact of global, regional and
country-specific factors on creditworthiness. Overall, the results show that global and
regional factors are far more important than country-specific factors in determining
changes in creditworthiness for these four emerging-market countries. It also
considers the S&P 500 volatility as a proxy for global market uncertainty. The results
indicate that it is positive and significant for credit quality, which is consistent with
the modeling of credit spreads. It indicates that the dependence of emerging markets
on industrial countries increase because of globalization.
Actually, the cross-market hedge is also related to the uncertainty. Chordia, Sarkar
and Subrahmanyam (2001) explore both trading volume and spreads in the stock and
bond markets respectively from June 1991 to December 1998 to find the evidence
consistent with linkage between dynamic cross-market hedging and uncertainty. They
ponder over the Asian crisis in 1997 and the Russian default crisis in 1998, and the
results suggest that greater market uncertainty during the crisis periods leads to an
dramatical changes in correlation between stock and bond spread and volume relevant
13
significantly stronger in the crisis periods. Thus, the uncertainty of financial market is
a critical factor while we consider market correlation.
Connolly, Stivers and Sun (2005) study whether stock-government bond return
relation in nine European countries from 1992 to 2002 varies due to the influence of
stock market uncertainty which is measured by equity implied volatility. The stock
market uncertainty is measured by the implied volatility from equity index options, specifically the Chicago Board Options Exchange’s Volatility Index (VIX). The results indicate bond returns tend to be high during days when implied volatility
increases. They also find a negative relation between the uncertainty measures and the
future correlation of stock and bond returns that the correlation of daily stock and
bond returns swing from significantly positive in low uncertainty periods to
significantly negative in high uncertainty periods in most countries. This study
presents additional evidence supporting these stock market uncertainty effects may
stem from cross-market rebalancing. When considering cross-market pricing
influences, variation in stock market uncertainty (as measured by stock volatility) is
likely to be more important than variation in bond market volatility.
According to the articles mentioned above, the contagion is significant for financial
markets and regions as well as the credit correlation. Because equity implied volatility
14
market uncertainty which has an impact on cross-market hedge, it is taken as an
exogenous variable while we explain the variation of credit correlations. The US
stock market volatility is adapted because of dependence of emerging markets on
industrial countries increasing due to globalization. Therefore, our study of credit
contagion of Asia countries will take credit spread of sovereign debts as the
measurement of credit quality and VIX as the uncertainty of world financial markets.
However, the credit spread analysis is lack of time-varying. Our study applies an
appropriate model to improve estimation.
2.3. The Development of the Methodologies-Dynamic Conditional Correlation model
The Autoregressive Conditional Heteroskedasticity (ARCH) proposed by Engle
(1982) is among the most widely used time-varying covariance models. ARCH model
which would be possibly the most important innovation in modeling markets
volatility changes adopts the effect of past residuals and helps explain the volatility
clustering phenomenon. Bollerslev (1986) proposes Multivariate Generalized
Autoregressive Conditional Heteroskedasticity model (GARCH) which opens a new
field in research of volatility and is widely applied in research of financial and
economic time series (see Bollerslev, Chou and Kroner, 1992). The GARCH models
are with flexible adoption of dynamic of volatility ant it does simplify of estimation. It
15 Jones (2005) for EGARCH models.
Large time-varying covariance matrices are needed in portfolio management.
Bollerslev (1990) introduced the constant conditional correlation multivariate
GARCH model for estimation assets correlations. The assumption of constant
correlation makes estimation a large model which is feasible. However, Tsui and Yu
(1999) find the constant correlation assumption is rejected for certain assets.
Alexander (2000) proposes the factor GARCH model for estimation of large
covariance matrices with limited number of factors. However, this approach is
constrained by the difficulty in interpreting the coefficients on the univariate GARCH
model. Engle (2002) proposes dynamic conditional correlation model to improve the
weakness of CCC model. The correlation is time-varying rather than constant when it
is estimated by two-stage estimation. This model has a clear advantage over
multivariate GARCH models in that the number of parameters to be estimated in the
process which is independent of the number of series to be correlated. Cappiello,
Engle and Sheppard (2006) develop asymmetric DCC to allow news impact on
correlation estimation. Equity returns show strong evidence of asymmetries in
conditional volatility while little is found for bond returns.
Liao (2008) proposes a Modified Dynamic Conditional Correlation model (the
16
returns. The DCCX model allows adding exogenous variables when we estimate
correlation. The result shows a high positive correlation between returns of the
S&P500 and 10-year-treasury-bonds. Also, estimated by the DCCX model, it suggests
17 III. Methods
The main objectives of this study are to examine the credit correlations between
sovereign bonds by dynamical conditional model, so called DCC model. It was first
proposed by Engle and Sheppard (2001) and then extended by series of papers such as
Engle (2002) and Cappiello, Engle and Sheppard (2006). There are two stages of the
estimation- the first is to obtain volatility and residual for each series by univariate
GARCH, and the second is to transform standardized residual to estimate conditional
correlation estimators- by maximum likelihood method. The DCC model is a new
class of multivariate GARCH models which have the flexibility of univariate GARCH
but not the complexity of multivariate GARCH (see Engle, 2002). Furthermore, the
DCCX model is the modification from the DCC model. The only difference between
two models is that the DCCX model allows us to include the additional explanatory
variables in the equation to investigate the determinants of correlations. This
improvement helps us to explain the behavior of correlations. This section provides
the overview of the models
3.1. The Dynamic Conditional Correlation (DCC) Model
The conditional correlation between two variables, r and 1,t r , that each have 2,t
18 1 1, 2, 12, 2 2 1 1, 1 2, ( ) ( ) ( ) t t t t t t t t E r r E r E r (1)
As equation (1) presents, the estimation is based on previous information. However, it
requires premature data and assigned equal weights for every previous lags which
complicates the process of estimation.
Bollerslev (1990) introduces the constant conditional multivariate GARCH model
specification (CCC model), where univariate GARCH is fitted to each series and then
transformed residuals are used to estimate a correlation matrix. A multivariate
conditional covariance is defined as follows: t t t H D RD (2)
, , t i t D diag h (3) tH is covariance matrix, and R is sample correlation matrix. D is the t k k
diagonal matrix of time varying standard deviations from univariate GARCH model.
t
D is with h , which is the square root of conditional variance of the i t, th
i series,
on th
i diagonal. We propose to write the elements of D as estimated by GARCH t
model:
2
, , -1 , -1
i t i i i t i i t
h h (4)
The model with assumption of constant correlation ensures the feasibility of
19
constant correlation could be rejected for certain assets. Therefore, Engle (2002)
generates and extends the CCC model into a new class of estimator which allows for
correlations to change over time. The main improvement isR could be time-varying t
rather than constant.
The dynamic conditional correlation GARCH model proposed by Engle (2002) is
defined as follows: t t t t H D R D (5) * 1 * 1 t t t t R Q Q Q (6) 1 1 1 ( ' ) ' , t t t t Q S A B A Z Z BQ (7) or in a bivariate case, 2 , , , -1 , -1 , -1 , -1 , -1 2 , , , -1 , -1 , -1 , -1 , -1 1 (1- - ) 1 ii t ij t ij i t i t j t ii t ij t ji t jj t ij j t i t j t ij t jj t q q q z z z q q a b a b q q q z z z q q (8) where qij E z z( i t, j t,).
It can be expresses in the mean reverting process given by:
, (1 ) , 1 , 1 , 1
ij t ij i t j t ij t
q a b q az z bq
(9)
t
H is covariance matrix and D is the t k k diagonal matrix of time varying
standard deviations from univariate GARCH model with h which are same as the i t,
CCC model. Furthermore, R is a possible correlation matrix containing the t
20
which contains elements qij , and S are the conditional and unconditional
covariance of standard residuals zi t, and zj t, , respectively. A and B are diagonal
parameter matrices and denotes Hadamard matrix product operators. is vector of
one. * 1
t
Q is diagonal matrix composed of square root of diagonal elements of Q : t
11 * 1 22 0 0 0 0 0 0 0 0 0 t kk q q Q q
If A and B are zeros, DCC model will revert to the structure of the CCC model.
The related papers show that Q will be positive definite as it is a weighted average t
of a positive definite matrix S, a positive semi-definite matrix Z Zt1 t1' and a
positive definite matrix Qt1(see Engle and Sheppard (2001)). As long as the
covariance matrix Qt is positive definite, R is positive definite which contains t
ones on the diagonal and every other element1 in absolute value. The conditional
correlation coefficient is defined as:
, , , , ij t ij t ii t jj t q q q (10)
For conditional covariance, it needs to use the conditional correlation in equation
(10) and the conditional standardize residuals in which.
21
The DCC model has been widely used and verified into different versions such as
asymmetric DCC (see Cappiello, Engle and Sheppard (2006) ). The DCCX model is
with the same idea as DCC model and modifies the correlation evolution equation to
be: t t t t H D R D (11) * 1 * 1 t t t t R Q Q Q (12) 1 1 1 1 ( ' ) ' , t t t t t Q S A B CXA Z Z BQ C X (13) 11 * 1 22 0 0 0 0 0 0 0 0 0 t kk q q Q q or in bivariate case, 2 , , , -1 , -1 , -1 , -1 , -1 2 , , , -1 , -1 , -1 , -1 , -1 1 0 (1- - ) -1 0 ii t ij t ij i t i t j t ii t ij t ji t jj t ij j t i t j t ij t jj t q q q cx z z z q q a b a b q q q cx z z z q q -1 -1 0 0 t t x c x (14) 2 , (1 ) , 1 , 1 ii t i t ii t q a b az bq (15) 2 , (1 ) , 1 , 1 jj t j t jj t q a b az bq (16) , (1 ) , 1 , 1 , 1 1 ij t ij i t j t ij t t q a b q cxaz z bq cx (17) t H , D , t R , t Q , and t * 1 t
Q remain the same meanings as the DCC model. A, B,
22
variable included to investigate the correlation between series. Xt1 represents the
determinant of X at the time t-1, and X is unconditional expectation of X . The
mean reverting requires to subtract the long-term expected mean of X . We refer to
this model as DCCX.
The DCC model was assigned to allow two stage estimations of conditional covariance matrices. At the first stage, univariate volatility model is fitted to each time series for obtaining residuals. At the second stage, residuals, transformed by
their standard deviation estimated during the first stage, are used to estimate the
parameter of the conditional correlation.
The log-likelihood function of this estimator can be written:
1 1 1 1 1 1 1 1 1 ( log(2 ) log ' ) 2 1 ( log(2 ) log ' ) 2 1
( log(2 ) 2 log log ' )
2 1
( log(2 ) 2 log ' ' log ' )
2 t t t t t t t t t t t t t t t t t t t t t t t t t t t t t t t t L k H r H r k D R D r D R D r k D R Z R Z k D r D D r Z Z R Z R Z
where Zt N(0,Rt) are the residual standardized by their conditional standard
deviation.
Let the parameters in model be written in two groups,
1, 2
. The elements of1,i
correspond to the parameters of the univariate GARCH model for the ith series,
23 1,i ( i, i, i)
. 2
corresponds to additional parameters in R . The log-likelihood t
function could be divided into two parts:
1, 2
vol( )1 corr( ,1 2)L L L . (19)
The former represents the volatility estimation at the first stage:
2 1 2 , , 1 , 1 ( ) ( log(2 ) log ' ) 2 1 ( log(2 ) (log( ) )) 2 vol t t t t t t t k i t i t t i i t L k D R D r D r r k h h
which is the sum of log-likelihood function of the individual GARCH model for theseries. This can be jointly maximized by separately maximizing each term. The
second part of equation (19) is estimation of correlation component, conditioning on
the parameters in the first stage:
1 1 1 1 2 1 1 ( , ) ( log(2 ) log ' ) 2 1
( log(2 ) 2 log log ' ' )
2 corr t t t t t t t t t t t t t t t t t L k D R D r D R D r k D R Z R Z Z Z
Since the estimation is conditioning on 1, it is often easier to exclude the constant
terms and simples to:
1 1 2 1 ( , ) (log ' ' ) 2 corr t t t t t t t L
R Z R Z Z Z (22)Engle (2002) proposes that it can perform the estimation by qusi-maximum
likelihood estimation (QMLE) to obtain consistent parameter estimates. Although the
estimations are consistent, they are inefficient. The estimation in first stage can pick
up 1 to satisfy equation (19). Given the 1 in fist stage, it can be maximized
(20)
24
equation (21) with respect to optimized 1 and 2. The two-stage approach to
maximizing the likelihood is to find the following:
1 1 ˆ arg max ( ) vol L (23)
2 1 2 ˆ max Lcorr( , ) (24)The DCCX model follows the same stages of estimation as DCC model. It firstly
estimates volatility for each series and obtain standardized deviation. For all series,
the GARCH volatility structure is using at stage one:
, ,, , -1 (0, ,), 1, 2, , 6 i t i t i t t i t r N h i (25) 2 , , -1 , -1 i t i i i t i i t h h (26) , , / , i t i t i t z r h (27)
25 IV. Results
4.1. Sample
The investigated data set consists of credit spreads calculated by 10-year sovereign
bond yield of the US and five Asia countries - Japan, Hong Kong, South Korea
(henceforth Korea), Thailand, and Taiwan – relative to US 1-year treasury yield.
Japan, Korea, Thailand and Hong Kong have the largest amount of local currency
Bond Markets in Asia despite China1. The yield data begin on November 1, 2000 and
end on February 20, 2008 reported by DataStream, given the sample size of 382
observations.
Moreover, to investigate the determinants of correlations between two credit spread
changes, Chicago Board Options Exchange Volatility Index (VIX) is included as
proxy of uncertainty of financial market which is suggested by prior literature. The
VIX is a key measure of market expectations of near-term volatility conveyed by the
S&P 500 stock index option prices. Introduced in 1993, it initially was a weighted
average of implied volatility of eight at-the-money put and calls options on S&P100
index. In 2003, it was expanded to a broader index, S&P 500, to estimate the implied
volatility of at-the-money index option, with 30 days to expiration. The VIX is a
1 The amount of bond market size in 2007 for US, Japan, Korea, Thailand and Hong Kong are 6,480.8, 6,879.28, 722.11, 107.47 and 107.52 in billions of US dollars.
26
widely used measure of market risk2. Investors expect the volatility of market to
increase when the VIX index goes up. The higher the ratio, the lower is the investors’
confidence. It has been considered to be sentiment and market volatility by the
world's premier of investor. The data of VIX is obtained from DataStream as well.
Here, the natural log of VIX (ln(vix ) )t-1 at the period t-1 is including in the process of
estimating dynamic conditional correlation3.
4.2. Descriptive statistics
To calculate the credit spreads for bond i at time t, we use the US Treasury bond.
The credit spread is defined as 10-year bond yields over US treasury yield, and credit
spread change is defined as first-difference of credit spread as Cantor and Packer
(1996):
Credit Spread =yield on sovereign bondi,t - yield on US treasury bond
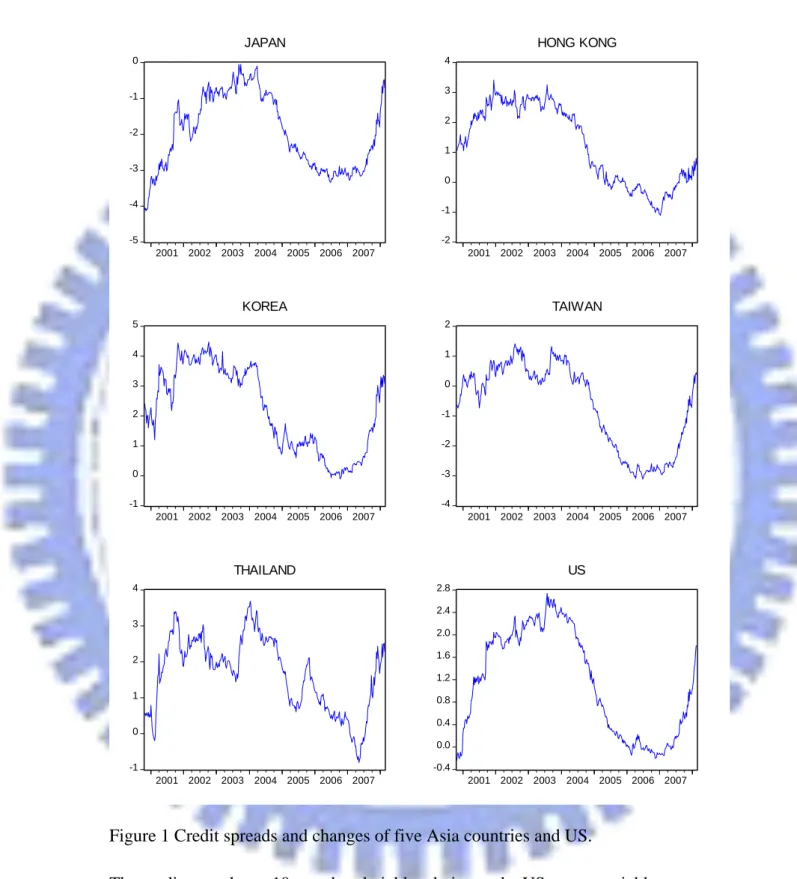
<Figure 1 is inserted about here>
Figure 1 shows the graphs of credit spreads and the changes of six countries over
the sample period. The credit spread and the volatility fluctuate over time and seem to
arise in the late 2001, 2003 and 2007. The 911 territory attack of 2001 damages the
2 CBOE volatility index is referred to as the investor fear gauge. 3
The MSCI world index is considered as proxy for world economic climate when we choose exogenous variables. However, the results of this variable show statistically insignificant impact on the correlation of credit spreads. The data are not listed in the following tables.
27
worldwide economic markets. In 2003, because the US government urges to get rid of
recession and afford the expenditure used in the arms with Iraq, it issued debts with
higher yields which also increases the credit spreads in domestic debt market as well
as Asian countries which are closely related with the US. In 2007, the subprime
mortgage crisis also increases the credit risk in debt markets. The time-varying
characteristics and volatility cluster evidence suggest capturing the time-varying
volatility series by the GARCH model. Table 1 provides descriptive statistics of the
credit spread changes and unconditional correlation among countries and VIX.
<Table 1 is inserted about here>
In Panel A, the mean of every credit spread changes are positive over the sample
period except Hong Kong. By investigating standard deviation, it shows that Korea’s
spread change is more volatile than any other country. Almost all series present
positive skewness and excess Kurtosis. Jarque-Bera4 for null hypothesis is far beyond
the critical value at 5% level, which suggests that the series are not normal
distribution. In sum, the characteristic of fat-tail and also statistics of Jarque-Bera
indicates the non-normality distribution.
Information on the contemporaneous relationships of the spreads across countries
4
The Jarque-Bera test is a goodness-of-fit measure of departure from normality, based on the sample kurtosis and skewness. The test statistic JB is defined as
2 2 ( 3)
( ) 6 4
n K
S , where S is the skewness, K
28
as well as those between VIX is given by the unconditional correlation in Panel B. It
suggests that there is some commonality in the time series properties of the spreads.
The correlations between two Asian countries are higher than correlations between
those with the US, which indicates the connection of markets within the Asian
continent is closer. The results are consistent with Zhou (2001) that markets in the
same region often have higher default correlations than the firms in different regions.
Particularly, the correlation between Taiwan and Japan is extremely obvious.
Furthermore, VIX is negatively related to credit spreads. This result is consistence
with research before (see Westphalen, 2001). When the market uncertainty goes up,
the credit quality of sovereign bond moves in the opposite direction. To sum up, the
identification of unconditional correlations is important before we take a look into the
time-series analysis of dynamic conditional correlations.
4.3. Empirical analysis
As mentioned previously, the DCC model, which needs two stages of estimation, is
used to estimate dynamic conditional correlation between assets. At the stage 1, the
credit spread series fit the univariate GARCH for estimating the volatility and
standard deviation of each series. Then, at stage 2, it processes to obtain the
conditional correlation by standard deviation and q12E z( 1,t,z2,t). In this study, we
29
difference between DCC and DCCX is that the DCCX model includes an extra
exogenous variable, VIX, when we estimated correlations. Table 2 provides two-stage
estimation results of the DCC models of credit spread changes by maximum
likelihood method over the sample period.
<Table 2 is inserted about here>
In Panel A of Table 2, we could see the coefficients of estimation at stage 1 are all
significant at 5% level except some coefficients of constant parameters. Specifically,
it implied that the volatility of spread change is mainly driven by its own volatility on
the previous period- as indicated by the size of ˆ, which measures the long-term
persistence in volatility. The strong persistence of volatility to shocks is in the range
of 0.690 and 0.918 while the rather weak effects of
ˆ are in the range of 0.071 and0.398. The sum of estimated coefficients (
ˆ+ˆ) is close to unity for all the cases,implying that the volatility display a highly persistent fashion.
After fitting the series to GARCH (1, 1), we investigate correlation estimation in
Panel B. First, in the DCC model, the results present all coefficients are significant
under 95% confidence except ˆa . The results show that the correlations are
significantly dynamic. Second, the estimation of the DCCX model concerning VIX
30
of fifteen coefficients ( ˆc) of exogenous variable, ln(vix ) , are significantly positive t-1
at 1% or 5% level, which means correlations between credit spread changes tend to
vary in an opposite direction of VIX during periods. That is, the credit correlations
among countries increase when the uncertainty of financial markets is high.
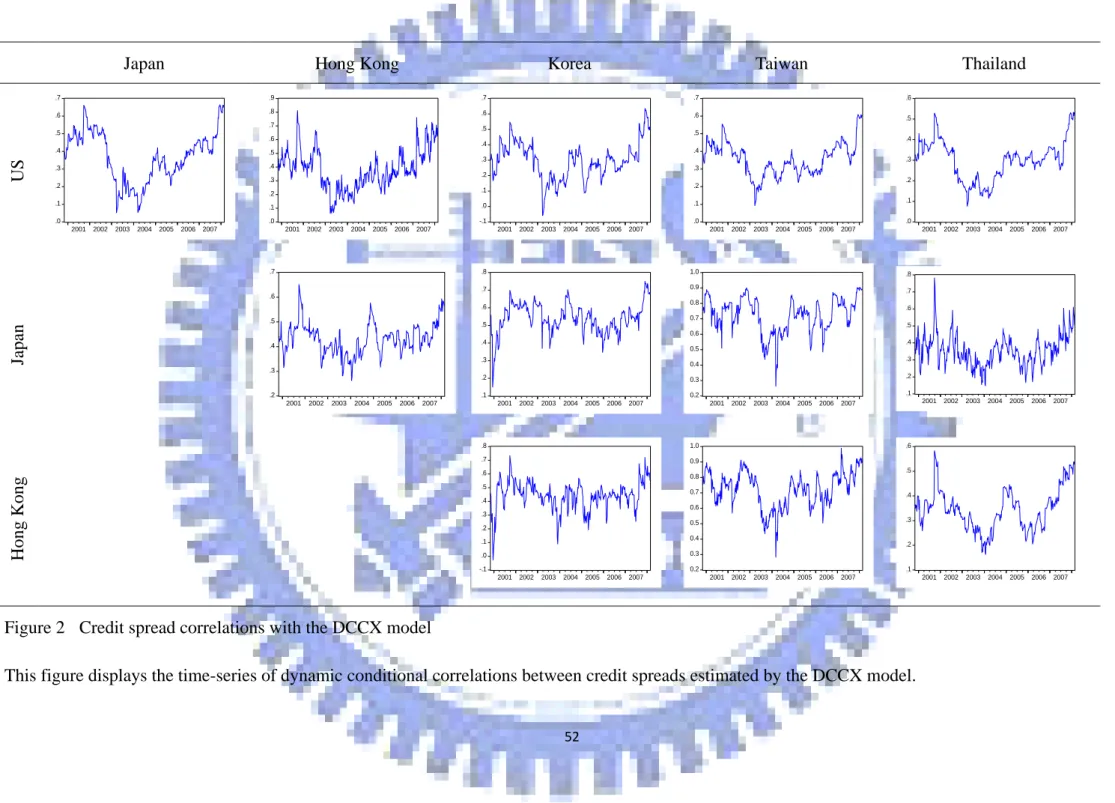
<Figure 2 is inserted about here>
Figure 2 shows that all pair-wise correlations estimating by the DCCX model. The
correlations are fluctuating over time and have similar patterns.
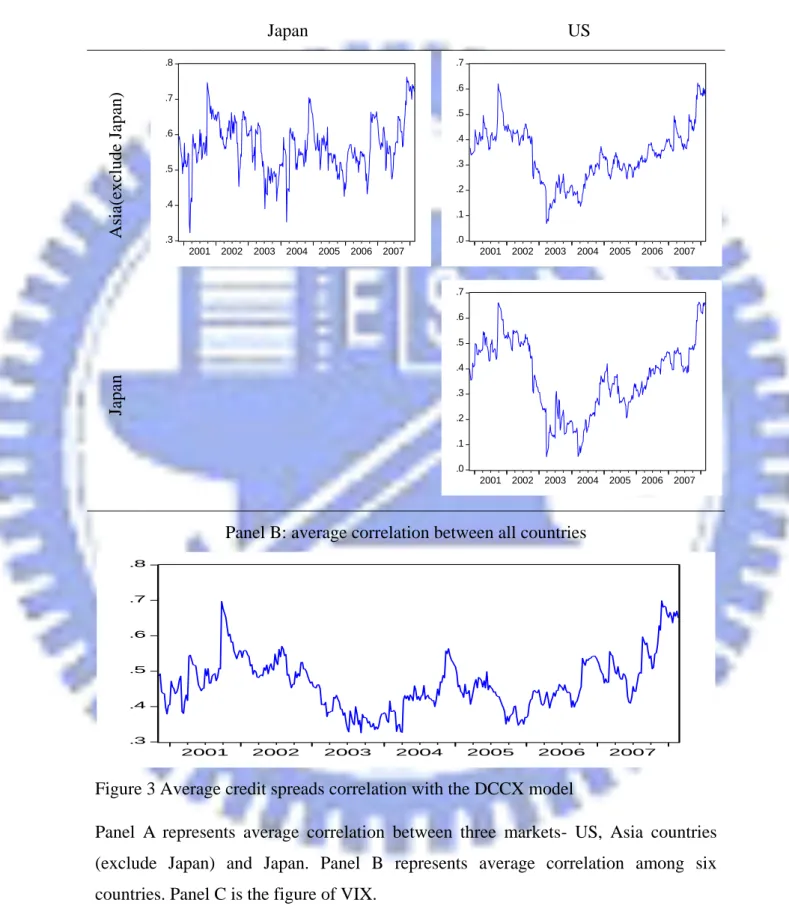
<Figure 3 is inserted about here>
Panel A in figure 3 indicates more clearly that the average correlations between
two Asian countries are around 0.4 to 0.8, which is higher than the average
correlations between Asian and the US that are around 0.1 to 0.6. The results are
consistent with the unconditional correlation in Table 1 that the connection of markets
within the Asian continent is rather closer than those with the US. From the average
correlation graphs between countries in Panel B, we can see there is a significant peak
at the last season of 2001 which is the time after the 911 terrorist attacks. There is a
higher correlation from 2004 to 2005. Since the bloom of world economic after 2004,
especially in emerging markets, the credit quality is improved in debt markets. The
31
increasing. The significant ascending correlation from 2007 summer until the end of
sample period coincides with the subprime mortgage crisis which causes the higher
credit risk of debt markets. The results are consistent with literatures that suggest the
correlations for any pairs of countries increase after the crisis. Compared with Panel B,
the VIX graph in Panel C also increases in late 2001 and 2007. It provides same
empirical results in DCCX model that correlations are moving is the same direction
with market uncertainty.
We turn to simple OLS regressions to explore the determinants of credit spread
correlation again. The following equation is used to test how these variables affect
correlations:
, , 0 1 , , -1 2
ln(
-1)
i j t i j t t t
corr
a
a corr
a
vix
v
(28)
The dynamic conditional correlations estimated by the DCC model (corri j t, , )
regress with correlation in the period t-1 (corri j t, ,1) and proxy for market uncertainty,
t-1
ln(vix ) . The results of regressions estimated by OLS are reported in table 3.
<Table 3 is inserted about here>
The regressions can explain large part of correlations with the range of 71% and
95%. The correlations are mainly determined by correlation in the last period. All of
32
positively and significantly influenced by ln(vix )t-1 under the 5% or 10% level
except few pairs. Specifically, the correlation would slightly increase when the
uncertainty increases. This result is consistent with the DCCX model.
4.4. Joint volatility and correlation dynamics
For many financial decisions and strategies like risk management and pricing
derivatives, the relationship between volatilities and correlations are important. The
high correlation values associated with the extreme volatility in the underlying
markets would make international diversification benefits disappear (see Cappiello,
Engle and Sheppard, 2006). If correlations move in the same direction, then risks in
the long run are greater than they seem in the short run. For the investors who
diversify internationally, it would be beneficial to identify markets where the
correlations are less sensitive to values of the volatilities in these markets. After
investigating credit correlation between two countries, here we examine the average
relations of volatility and correlation for the underlying country. We also examine
whether the relations increase or decrease after we consider VIX as we estimate
correlations. We define the average correlation (i) as follows:
T it i ijt ij k t i T T j i j it i ijt ij t t h h k h h
1 1, 2 2 1 1 ( )( ) 1 1 ( ) ( ) ρ ρ ρ ρ (29)33
For country i, hit is its variance, and ijt is its associated pair-wise correlation
with other the countries. Table 4 reports the value of i relative to each spread
series.
<Table 4 is inserted about here>
In table 4, i are positive which suggest that volatility and correlation are move
together. For example, as Japan volatility rise, all its pair-wise spread correlations
increase as well. Moreover, the indicators in the right column are lower than those in
the left one. To take average of all countries, the correlation decrease from 0.368 to
0.3. That is, it benefits from considering uncertainty of financial markets when
estimating correlation between markets. This will helps reduce risk in the long run.
4.5. Implication in international diversification
From the application above, we could see it is important for investors to deliberate
the influence from uncertainty of financial markets. Another application is to use the
estimation of correlation in portfolio construction. We assume there is a
minimum-variance portfolio containing two assets, one is an Asian bond and the other
is a US bond. From the DCCX model, the dynamic conditional correlation concerning
VIX is generated before. To take average of conditional variance of Asia bonds and
34 weights of two assets by following equations:
Min ht w ha t a t2, , w hu t u t2, , 2w wa t, u t, h hu t a t, , t (30) , , , , , , , , 2 , , , , u t u t a t a u t a t a t u t u t a t a u t h h h w h h h h (31) 1 u a w w (32) a
w and w are portfolio weight of Asian and the US sovereign debts. u ha and h u
are variance. ht and tare covariance and correlation between Asian and the US
sovereign debts.
We would like to measure how natural log of VIX in the last period affects the
weights of portfolio by regressions, and then, we can identify how much weight
investors should increase or decrease for certain assets. The weights are regressive
against the natural log of VIX in the last period:
, ln( 1) a t t t w vix (33) , ln( 1) u t t t w vix (34)
<Table 5 is inserted about here>
The results show in Table 5. It should decrease weight by 7.6% in the Asia bond if
VIX increase by 1%, the US bond weight otherwise. That is, when the market
35
active strategy helps manage portfolio weight avoid risks according to different world
36 V. Conclusion
It is particularly important to check how credit correlations among countries vary
over time for risk diversification and portfolio management. In this study, we use
credit spreads of five Asian countries and the US sovereign debts relative to US
1-year treasury yield as the measurement of credit risk to examine correlations by the
DCC and DCCX model. Furthermore, in the DCCX model, it includes CBOE
Volatility Index as the measurement of financial market uncertainty, analyzing
whether it is associate with credit correlations.
The main results of our investigation into the behavior of credit spread correlations
between sovereign debts as well as determinants can be summarized as follows. First,
the credit spreads show time-varying characteristics and volatility cluster evidences.
From estimation of DCC model, the dynamic correlations are significant and vary
over time. The results are consistent with findings from unconditional estimation and
also the results of Baig and Goldfajn (1999). Evidence shows that there is a close
connection of credit quality among Asian countries and among those with the US.
Second, the results of DCCX model indicate that correlations vary positively with
VIX, that is, the correlation increases during the period when financial market
uncertainty rises. Based on our results, investors could modify their estimation of
37
average correlation of volatility and correlation for underlying countries will be lower
if we consider financial market uncertainty into the estimation of credit correlations.
The other application is it helps investors to construct portfolio and provides a
management strategy.
Our paper results contribute to understanding the time-varying correlation of credit
risk. Overall, the main results of this paper could be beneficial from preventing asset
value loss on one side and from well diversifying risk of portfolio on the other side.
Our investigation can be refined by further exploring other exogenous variables for
better explanation of dynamic correlations. For example, macroeconomic variables
such as GDP growth and inflation are worth investigating. It also remains to be
investigating whether other regions such us Latin America can provide further
38 References
Alexander, C., 2000, A Primer on the Orthogonal GARCH Model, manuscript ISMA
Centre, University of Reading, UK.
Baig, T., and I. Goldfajn, 1999, Financial market contagion in the Asian crisis,
International Monetary Fund Staff Papers 46, 167-195.
Bollerslev, T., 1986, Generalized Autoregressive Conditional Heteroskedasticity,
Journal of Econometrics 31, 307-327.
Bollerslev, T., 1990, Modelling the coherence in short-run nominal exchange rates: A multivariate generalized ARCH approach, Review of Economics and Statistics 72, 498-505.
Bollerslev, T., R. Y. Chou, and K. F. Kroner, 1992, ARCH modeling in finance - a review of the theory and empirical-evidence, Journal of Econometrics 52, 5-59.
Brandt, M. W., and C. Jones, 2005, Volatility Forecasting with Range-Based EGARCH Models, Journal of Business and Economic Statistics, forthcoming. Cambell, J., and J. Ammer, 1993, What Moves the Stock and Bond Markets? A
Variance Decomposition for Long-term Returns, Journal of Finance. March 3-37.
Cantor, R., and F. Packer, 1996, Determinants and Impact of Sovereign Credit Ratings,
FRBNY Economic Policy Review 2.
Cappiello, L., R. F. Engle, and K. Sheppard, 2006, Asymmetric Dynamics in the Correlations of Global Equity and Bond Returns, Journal of Financial
Econometrics 4, 537.
Chiang, T. C., B. N. Jeon, and H. M. Li, 2007, Dynamic correlation analysis of financial contagion: Evidence from Asian markets, Journal of International
Money and Finance 26, 1206-1228.
39
and Stock Market Liquidity the Impact of Financial Crises, Monetary Policy, and Mutual Fund Flows (Federal Reserve Bank of New York).
Collin-Dufresne, P., R. S. Goldstein, and J. S. Martin, 2001, The determinants of credit spread changes, Journal of Finance 56, 2177-2207.
Connolly, R., C. Stivers, and L. Sun, 2005, Stock market uncertainty and the stock-bond return relation, Journal of Financial and Quantitative Analysis 40, 161-194.
Cowan, A.M., and C. D. Cowan, 2004, Default correlation: An empirical investigation of a subprime lender, Journal of Banking & Finance 28, 753-771.
Duffie, D., L. H. Pedersen, and K. J. Singleton, 2003, Modeling sovereign yield spreads: A case study of Russian debt, Journal of Finance 58, 119-159.
Dungey, M., V. L. Martin, and A. R. Pagan, 2000, A multivariate latent factor decomposition of international bond yield spreads, Journal of Applied
Econometrics 15, 697-715.
Elton, E. J., M. J. Gruber, D. Agrawal, and C. Mann, 2001, Explaining the rate spread on corporate bonds, Journal of Finance 56, 247-277.
Engle, R F., 2002, Dynamic conditional correlation: a simple class of multivariate GARCH, Journal of Business and Economic Statistics 17, 425-446.
Engle, R. F., 1982, Autoregressive Conditional Heteroscedasticity with Estimates of the Variance of United Kingdom Inflation, Econometrica 50, 987-1007.
Engle, R. F., and K. Sheppard, 2001, Theoretical and Empirical properties of Dynamic Conditional Correlation Multivariate GARCH, (NBER).
Liao, W. Y., 2008, Explaining the Great Decoupling of the Equity-Bond Linkage with a Modified Dynamic Conditional Correlation Model, Working Paper, National
Chiao Tung University.
Loffler, G., 2003, The effects of estimation error on measures of portfolio credit risk,
Journal of Banking and Finance 27, 1427-1453.
40
Eurobond market, International Review of Financial Analysis 11, 183-218. Masih, A. M. M., and R. Masih, 1997, Dynamic Linkages and the Propagation
Mechanism Driving Major International Stock Markets: An Analysis of the Pre-and Post-Crash Eras, Quarterly Review of Economics and Finance 37, 859-885.
Nelson, D., 1991, Conditional heteroskedasticity in asset returns: a new approach,
Econometrica 59, 347370.
Tsui, A. K., and Q. Yu, 1999, Constant conditional correlation in a bivariate GARCH model: evidence from the stock markets of China, Mathematics and
Computers in Simulation 48, 503-509.
Weigel, D. D., and G. Gemmill, 2006, What drives credit risk in emerging markets? The roles of country fundamentals and market co-movements, Journal of
International Money and Finance 25, 476-502.
Westphalen, M., 2001, The Determinants of Sovereign Bond Credit Spread Changes,
unpublished paper, Universite de Lausanne.
Zhou, C. S., 2001, An analysis of default correlations and multiple defaults, Review of
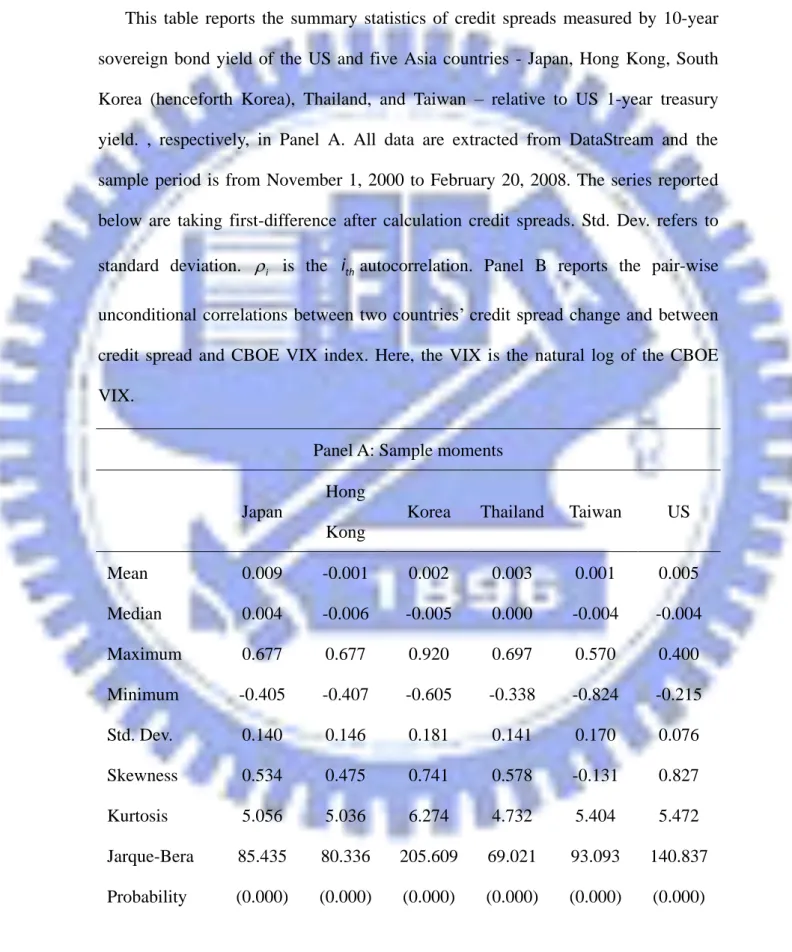
41 Table 1 Descriptive Statistics
This table reports the summary statistics of credit spreads measured by 10-year sovereign bond yield of the US and five Asia countries - Japan, Hong Kong, South Korea (henceforth Korea), Thailand, and Taiwan – relative to US 1-year treasury yield. , respectively, in Panel A. All data are extracted from DataStream and the sample period is from November 1, 2000 to February 20, 2008. The series reported below are taking first-difference after calculation credit spreads. Std. Dev. refers to
standard deviation. i is the ithautocorrelation. Panel B reports the pair-wise
unconditional correlations between two countries’ credit spread change and between credit spread and CBOE VIX index. Here, the VIX is the natural log of the CBOE VIX.
Panel A: Sample moments
Japan
Hong Kong
Korea Thailand Taiwan US
Mean 0.009 -0.001 0.002 0.003 0.001 0.005 Median 0.004 -0.006 -0.005 0.000 -0.004 -0.004 Maximum 0.677 0.677 0.920 0.697 0.570 0.400 Minimum -0.405 -0.407 -0.605 -0.338 -0.824 -0.215 Std. Dev. 0.140 0.146 0.181 0.141 0.170 0.076 Skewness 0.534 0.475 0.741 0.578 -0.131 0.827 Kurtosis 5.056 5.036 6.274 4.732 5.404 5.472 Jarque-Bera 85.435 80.336 205.609 69.021 93.093 140.837 Probability (0.000) (0.000) (0.000) (0.000) (0.000) (0.000)
42 Table 1 (Continued) Japan Hong Kong
Korea Thailand Taiwan US
ρ1 -0.086 -0.178 -0.065 -0.075 -0.021 -0.021
ρ2 0.053 -0.014 0.005 0.029 0.008 0.100
ρ3 0.003 0.027 0.034 -0.077 -0.080 0.022
ρ10 0.034 0.017 0.001 0.080 0.067 0.008
Panel B: Correlation Matrix
Japan Hong Kong Korea Taiwan Thailand US
Hong Kong 0.445 Korea 0.555 0.458 Taiwan 0.754 0.424 0.513 Thailand 0.589 0.366 0.490 0.551 US 0.398 0.535 0.310 0.390 0.329 VIX 0.235 0.150 0.185 0.183 0.109 0.279