An investigation of dust emissions from unpaved surfaces in
Taiwan
Chuen-Jinn Tsai *, Chung-Tso Chang
Institute of En6ironmental Engineering, National Chiao Tung Uni6ersity, No.75, Poai Street, Hsin Chu300, Taiwan
Abstract
One of the critical problems in making an effective strategy to control fugitive road dust is to estimate the emission factor accurately. The paper presents measured results of emission factor at field and in a wind tunnel. For the field study, three unpaved roads in Hsin Chu, Taiwan were tested. For the wind tunnel testing, the tested road dust was also collected from the field. Results of field study indicate that the emission factor of unpaved roads increases with the increasing wind speed, the number of vehicles and the speed of vehicles. It can be predicted as e (g/m2-day) =
8.72 × 10− 3× V
w0.64× s0.19× M− 0.05× Vv1.32× Nv1.11 (Vw, m/s — wind speed; s, % — silt content of road dust; M,
% — moisture content of road dust; Nv, c/h—number of vehicles; Vv, km/h — speed of vehicles) by the
multi-vari-able regression technique. The fractions of PM10 and PM2.5 in the TSP reentrained from the unpaved roads are
20.6912.9% and 2.391.2%, respectively. The wind tunnel test results show that air acceleration rate and edge effect of the dust surface increase the emission factors considerably. As air acceleration rate increases from 0.1 to 1.5 m/s2,
the emission factor increases linearly from 1.0 × 10− 4to 7.0 × 10− 4kg/m2s. However, test results show no significant
effect of air acceleration and edge effect of dust surface on the threshold wind speed of reentrainment. © 2002 Elsevier Science B.V. All rights reserved.
Keywords:Fugitive dust; Emission factor; Reentrainment; Wind tunnel; Unpaved road
www.elsevier.com/locate/seppur
1. Introduction
PM10 has been one of the most serious air
pollutants in Taiwan. According to previous stud-ies, PM10 has been the major index pollutant for
the pollutant standard index to exceed 100 in Taiwan from 1994 until now. To develop a better control strategy and better estimate the emission factor, many researchers suggested that the water
content of the road dust, wind speed, mechanical disturbance by vehicles and silt loading of the road testing the field considered as the main fac-tors affecting dust emission strength.
The mechanism of particle reentrainment from surface has been studied extensively both theoreti-cally and experimentally. There are three different models proposed to explain the phenomenon of the particle reentrainment from surface by airflow. They are force balance, moment balance and energy balance models, respectively (Cleaver and Yates [1], Kousaka et al. [2], Wang [3], Tsai et al. [4], Matsusaka and Masuda [5], Lazaridis and
* Corresponding author. Tel.: + 3-5731880; fax: + 886-3-5727835.
E-mail address:cjtsai@cc.nctu.edu.tw(C.-J. Tsai).
1383-5866/02/$ - see front matter © 2002 Elsevier Science B.V. All rights reserved. PII: S 1 3 8 3 - 5 8 6 6 ( 0 2 ) 0 0 0 7 4 - 6
Drossinos [6]). In the force balance model, the critical condition for particle reentrainment is when the lift force exerted on a particle by airflow exceeds the adhesion force between the particle and the attached surface. In the moment balance model, the airflow is assumed to impose a bending moment on the particle. When the bending moment overcomes the moment from the adhesion force on the particle, the reentrain-ment of the particle will occur and the particle will roll on the surface at first and subsequently be detached from the surface. In the energy bal-ance model, the attached particle is assumed to accumulate the energy obtained from the flow field. Once the energy is greater than the pro-posed adhesive potential well of the particle, the particle will escape from the surface. However, these models cannot be applied directly to the actual field conditions since they do not consider many other influencing parameters such as vehi-cle disturbance, dust surface conditions, etc.
In the previous study of emission factors of unpaved road, Evans et al. [7] proposed that the wind erosion of road surface and the mechanical and aerodynamic disturbances of surface caused by vehicular travel result in the emission of par-ticles. The quantity of dust emission of vehicle traffic on unpaved road may be estimated by using the following empirical equation (AP-42, US EPA [8]): e = k
s 12
a
W 3
b
M 0.2
− c (1) where e (g/VKT) is the particulate emission fac-tor for PM30, and VKT represents per vehicle kilometer traveled, s (%) is the surface silt con-tent with percentage of particlesB75 mm diame-ter, W (tons) is the average weight of the vehicles traveling on the road, M (%) is the moisture of surface dust, k is the base emission factor for particle size range. In this equation, PM30 represents TSP. When the size range is
PM2.5, k equals to 107, for PM10 k is 733 and
for TSP k equals to 2819. Empirical constants a, b, c are also different for different size-ranges, they are 0.8, 0.5 and 0.4 for TSP, 0.8, 0.4 and
0.3 for PM10, 0.8, 0.4 and 0.3 for PM2.5. In US
EPA quality rating, this equation for TSP or PM10 is B class (‘good field measurements of a limited number of sources’), and for PM2.5 is C class (‘a minimum umber of tests plus some en-gineering judgement’). The total loading is mea-sured by sweeping and vacuuming lateral strips of known area from each active travel lane. The silt content (s, %) is determined by measuring the percentage of loose dry road dust that passes through 200 mesh screen, according to the ASTM-C-136 method.
Cowherd et al. [9] and Evans and Cooper [10] found that the emission factor of unpaved roads was related to the vehicle number, average vehi-cle speed, average vehivehi-cle weight, average num-ber of vehicle wheels, surface soil structure and soil moisture content of the roads. Cowherd et al. [11] offered an expression of the emission factor for PM10, which is expressed as
e = 610
s 12
Vv 48
W 2.7
0.7
w 4
0.5365 − d 365 (2)
where Vv (km/h) is the average vehicle speed, w
is a mean number of wheels, d is the number of days with precipitation more than 0.254 mm. Hesketh and Cross [12] stated that the emission factors of unpaved roads of PM30 (or TSP) were
related to the silt content, average vehicle speed and rainy days in a year (days that precipita-tion\0.254 mm) as
e = 142.7(s)(Vv/30)(365 − d)/365 (3)
It can be seen from the above discussion that wind speed is not considered in all previous em-pirical equations for the emission factor. The purpose of this field study is to examine the effect of wind speed on emission factor together with all other parameters such as silt loading and moisture content of road dust, and number and speed of vehicles. Also it will be of great interest to know the effect of surface conditions (smooth or unsmooth) and air acceleration rate on the emission factor, and the threshold wind speed of reentrainment. To ensure the re-peatability of the experiment, this part of the study is conducted in a wind tunnel.
2. Experimental method
The study in this paper includes two parts. One is the wind tunnel study to investigate effect of different air acceleration rates and surface condi-tions of dust surface on the dust emission. The other is the field study where the exposure profile method is used to measure the vertical concentra-tion profiles of TSP at both upwind and down-wind positions and to calculate the emission factor accordingly.
2.1. Wind tunnel testing
Fig. 1(a) shows a wind tunnel system used in this study to measure the reentrainment of road dust from a surface. The working section of the wind tunnel is 30 cm in diameter. At the entrance of the wind tunnel, HEPA filters were installed to prevent the suspended particles in the air from entering the wind tunnel. The air was sucked into the wind tunnel by a 5-hp fan and its rotational speed, hence the wind speed, was controlled by an inverter. The maximum wind speed was
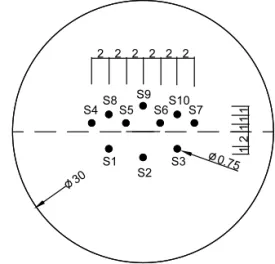
con-Fig. 2. Relative positions of ten sampling inlets. (Unit:cm).
trolled under 15 m/s in this study. Air tempera-ture was from 17 to 24 °C and relative humidity was between 55 and 75%. A honeycomb was used to straighten the air flow before the working platform, on which dust samples were tested.
To avoid the edge effect, the sample surface was kept flush with the top surface of the working platform, as shown in Fig. 1(b). An aluminum cell with inner dimension of 5 cm long × 5 cm wide × 0.2 cm high was used to contain the dust samples. The cell contained with the dust sample was then embedded into an opening on the working form. Front and rear edges of the working plat-form were smoothed to prevent flow separation.
Ten sampling tubes (ID: 0.75 cm) were installed in the downstream of the working platform to collect the reentrained particles by filter holders containing glass fiber filters (47 mm in diameter) operated at the flow rate of 10 l/min. The inlets were located at the same cross section of the wind tunnel, which was 70 cm away from the down-stream of the dust sample. As shown in Fig. 2, the relative positions of the ten sampling tubes were adjusted vertically and horizontally near the cen-terline until no particles were detected between the sampling area and the wall of the wind tunnel. The inlet edge of each sampling tube was sharp-ened to reduce the particle bounce. After sam-pling, the tubes were purged by clean air for a short time to remove particles lost inside the tubes. To determine the threshold reentrainment
Fig. 1. (a) Schematic drawing of the wind tunnel, (b) the enlarged diagram of the working platform with the dust sample. (Unit:cm).
velocity, the filter holder at S5 position was re-placed by a DustTrak PM10sampler (Model 8520, TSI Inc., St. Paul, MN) and real-time measure-ment of reentrained dust was conducted.
In most cases, the surface of the dust samples was smooth and flush with the platform. In some cases, the two rear edges of the dust samples were each cut into a cavity of 2 mm in depth to determine the edge effect on the threshold reentrainment velocity and emission factor. The total projected area of the two cavities were about 3% of the total surface area of the sample, 25 cm2.
Wind speed distribution at the location of the sampling cross section was measured using a hot wire anemometer (Model 8352-3, TSI Inc., St. Paul) and was used to calculate the total mass of the reentrained particles. The wind speed was also measured at 0.5 cm above the sample surface. Water content of the dust sample during each experiment was under 0.6%. Two Microorifice Uniform Deposit Impactor’s (MOUDI, Model 100, MSP Corp., Minneapolis, MN) (Marple et al., [13]) were connected to the S2 and S9 sam-pling tubes for determining the initial size distri-bution of the test samples, which were dispersed by a dust feeder (Wright Dust Feeder, WDF-II, BGI Inc., Waltham, MA) installed at the opening H1 shown in Fig. 1(a). The reentrained dust dis-tribution was measured by a MOUDI connected to the S5 sampling tube. The temperature and humidity in the wind tunnel were measured by a Qtrak (Model 8551, TSI Inc., St. Paul).
Test road dusts were collected from a site where a dynamic random access memory factory was constructing in the Science Industrial Park of Hsin Chu. A vacuum cleaner was used to collect the dust samples from the ground. The dust sam-ples were dried at 105 °C for 24 h in an oven. The dried dust samples were sieved using an No. 325 standard mesh to remove the particles greater than 44mm. The sieved dust sample was put into the cell (5 cm long × 5 cm wide × 0.2 cm deep) and the surface was made flush using a sharp knife edge. The dust-loaded cell was further dried for 30 min, and weighed after it was cooled down in a sealed container.
Total reentrained mass of particles, M, can be calculated by integrating mass of ten filter samples
over the cross section of the wind tunnel. Aspira-tion efficiency of the sampling tubes are taken into account using the model of Durham and Lundgren [14]. The emission factor of the dust sample can be derived as
E = M
A0T
(4) where A0 is the surface area of the dust sample,
and T is the total sampling time.
2.2. Field study
Field test was conducted at three unpaved roads (Chen-Ja Road, a road near the E-W high-way construction site, and a road near Nan-Liaw fish port) in Hsin Chu, Taiwan from November 1997 to May 1999. Vertical concentration profiles of TSP were measured at the upwind and down-wind positions of the unpaved road simulta-neously, using two vertical sampling racks each consisted of five TSP filter holders located at 1, 2, 3, 4 and 5 m above the ground level. The experi-mental setup is shown in Fig. 3. The sampling time was set for 5 h. The wind profile was also measured at the same time. The emission factor of dust based on the mass-balance method was cal-culated as
e =1 B
&
h
0
(Cd(y)Ud(y) − Cu(y)Uu(y))dy (5)
where Cu(y) and Cd(y) are the concentrations of TSP in mg/m3 at height y, at upwind and
down-wind positions, respectively, U(y) is the average wind speed at different sampling heights, B is the distance between the upwind and downwind loca-tions, and h is the maximum sampling height. In this study, the distance B of the upwind and downwind sampling racks ranged from 19 to 26 m.
The flow rate of each filter holder was 10 l/min controlled by a critical orifice, and dust was col-lected on 47-mm-diameter quartz filters (2 mm porosity, Model 2500 QAT-UP, Pall Inc.). Two hi-vol TSP samplers (TRIPOD GMWT 2200 Hi-Vol, General Metal Works) were set separately at the upwind and downwind locations of the un-paved roads to measure the total suspension
par-ticles at 1-m height above the ground. The mea-sured TSP concentrations by the hi-vol samplers were found to be nearly the same as those of the filter holders at 1 m height.
Two Dichot samplers (SA1241, Andersen In-strument Inc.) were collocated at the upwind and downwind locations of the unpaved roads to mea-sure PM10 and PM2.5 concentrations at the Nan-Liaw fish port. 37-mm Teflon-filters (2 mm pore size, Gelman Science) were used to collect particle samples. Fractions of PM10 and PM2.5 in TSP at
upwind and downwind locations could be mea-sured, and the fractions of PM10 and PM2.5in the
reentrained TSP could be calculated.
Two RM Yang meteorological sensors were collocated at 3 and 5 m heights above the ground
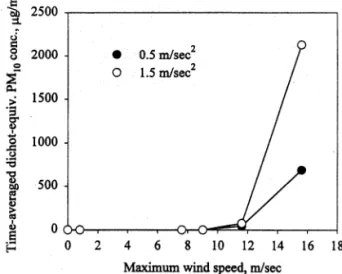
to monitor the average wind speed and wind Fig. 4. Relationship of time-averaged dichot-equivalent PMconcentration measured by the DustTrak with maximum wind10
speed. Two different acceleration rates, flat surface (no edge effect).
Fig. 3. Schematic diagram of the experimental setup in the field study.
direction. One temperature and relative humidity sensor was set at 1-m height above the ground to record temperature and RH during the field test. The vertical wind velocity profile was obtained by fitting the data using the power law function. Besides the meteorological parameter, the mois-ture content of surface dust, surface dust loading and size distribution, traffic volume and vehicle speed passing through the tested road were also measured at the same time, in order to correlate the relationship between these parameters and emission factors.
3. Results and discussion
From the measured size distributions by MOUDI, the percentage of total mass for parti-cles greater than 10 mm in aerodynamic diameter is found to be 95.5% for the initial test sample, and 90.6% for the reentrained sample. That is, both dust sample and reentrained dust contain mostly particles greater than 10 mm in aerody-namic diameter.
Fig. 4 shows that time-averaged dichot-equiva-lent PM10 concentration measured by the Dust-Trak with the maximum wind speed at two different air acceleration rates. The time-averaged
dichot-equivalent PM10 concentration was calcu-lated based on the real-time dust concentrations sampled from zero wind speed and continued for 180 s until after the maximum wind speed was reached. Particle reentrainment does not seem to occur until a maximum wind speed ex-ceeds a critical value, which is referred to as the threshold wind speed for reentrainment. In this experiment, the threshold wind speed was found to be 10 – 12 m/s, irrespective of air acceleration rate.
In order to know the difference in the reentrained dust concentrations between two consecutive dust reentrainments, a second reentrainment experiment was conducted imme-diately after the first experiment was over at air acceleration rate of 1.5 m/s2. Fig. 5 shows that
when there is no edge effect (i.e. no cavities on the sample surface), the reentrained dust concen-tration of the second reentrainment test is much lower than that of the first reentrainment, and approaches zero concentration. That is, most of loose particles in the uppermost layers were reentrained at the first reentrainment test leaving particles that were tightly connected and difficult to remove. Lazaridis and Drossinos [6] also
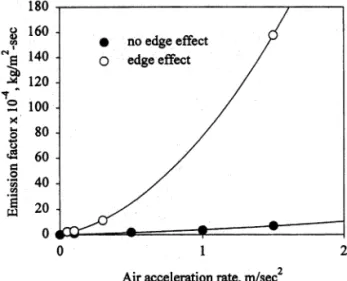
Fig. 6. Emission factors for the test samples with cavities (edge effect) and without cavities (no edge effect) at different acceler-ation rates. Maximum wind speed: 15 m/s.
found that particles in lower layer were harder to reentrain than those in the upper layer.
As seen in Fig. 5, the reentrained dust tration decays quickly after a maximum concen-tration is reached. Matsusaka and Masuda [5] also observed this phenomenon. They stated that the decay rate of the reentrained dust concentra-tion is higher for larger air acceleraconcentra-tion rates, which was observed in this study as well.
The existence of cavities on the surface of the dust sample increase the emission factor greatly, as shown in Fig. 6. The two cavities occupied 3% of the sample surface are seen to result in an increase of the emission factor by as much as 20 times, although the threshold wind speed is not affected.
In the field study, it is found that several im-portant parameters, such as wind speed, silt loading and traffic volume, could affect the emission factor and result in considerable vari-ability among the measured values even at the same sampling location. It is very important to take all these important parameters into account when deriving an empirical equation based on the experimental emission factors. The TSP emission factors in g/m2day measured at the
three unpaved roads are fitted using the multi-variable regression method as
Fig. 5. Time-averaged dichot-equivalent PM10 concentration measured by the DustTrak versus sampling time. Two consec-utive reentrainments, acceleration rate: 1.5 m/s2, maximum wind speed: 15 m/s, flat surface (no edge effect).
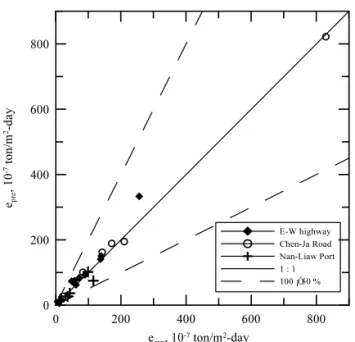
Fig. 7. Comparison of the experimental emission factor and predicted value by the empirical equation at the unpaved roads in E-W highway, Chen-Ja Road and Nan-Liaw fish port test sites.
Furthermore, the emission factor in g/m2day
can be converted into the emission factor in g/ VKT as:
e(g/VKT) = e(g/m2day) × B × 1000/(N v× 24)
(7) The comparison of the present emission factors in g/VKT with those by AP-42 (US EPA [8]), Cowherd et al. [11], and Hesketh and Cross [12] is in Table 1. The factor that involves rainfall days d was not considered in Eq. (2) and Eq. (3) since the present experiment was discontinued during rainy days. Table 1 shows that under high wind condi-tion in the Nan-Liaw fish port and E-W highway test sites, the present experimental data are within 50% of those AP-42 (US EPA [8]) and Cowherd et al. [11]. However, under wind calm conditions in the Chen-Ja Road test site, the present experi-mental data are considerably lower than those predicted by AP-42 and Cowherd et al. Since the important factor of wind speed is not included in any of previous empirical equations, Eqs. (1) – (3), it is therefore concluded that these equations are not suitable for calm wind condition. The pre-dicted values by Eq. (2) (Cowherd et al. [11]) are the PM10 emission factors. If these values were
converted to TSP emission factors by multiplying a factor of 5 and compared with the presented experimental data, similar conclusion to the above can be drawn. Therefore, it is recommended that the empirical equation such as Eq. (6) that in-volves wind speed be used for predicting hourly TSP emission factors.
This study shows that the average percentage of PM10 in the reentrained TSP is 22.0199.89%,
and for PM2.5it is 2.5190.90%. The percentages
are close to the values calculated based on AP-42. e = 8.72 × 10− 3× V w 0.64× s0.19× M− 0.05× V v 1.32 × Nv1.11, R2= 0.96 (6)
The equivalent number of passenger cars, Nv,
takes into account the size of the vehicles. It is the sum of the number of passenger cars, trucks and motorcycles multiplied by a factor of 1.0, 2.67 and 0.13, respectively. The ratio is determined by the ratio of the width of a vehicle to that of a passenger car, the factor of which is assumed to be 1.0. Fig. 7 shows that the relationship between the predicted values and experimental data. The agreement is quite satisfactory with R2= 0.96, the
maximum error of the prediction is about 50%.
Table 1
Comparison of emission factors measured in this study with those predicted by previous empirical equations Experiment
Site AP-42 Cowherd et al. [11] Hesketh and Cross [12]
(g/VKT) (g/VKT(PM10)) (g/VKT) (g/VKT) 395 954 1202 E-W Highway 1750 267 1333 Chen-Ja Road 798 3026 544
4. Conclusions
A wind tunnel was built in the laboratory to measure the emission factor of road dust under different air acceleration rates. Besides, the influ-nence of edge effect on the emission factor and the reentrained dust concentration was also inves-tigated. Some conclusions can be drawn from this study. The air acceleration rate is found to have no significant effect on the threshold wind speed for reentrainment, which is from 9 – 12 m/s. It is also found that the edge effect at the surface of dust sample has no significant effect on the threshold wind speed for reentrainment either. When the edge effect appears, both reentrained dust concentration and emission factor will be-come much higher than those without the edge effect. As the air acceleration rate is increased from 0.1 to 1.5 m/s2, the emission factor is
in-creased linearly from 1.0 × 10− 4 to 7.0 × 10− 4
kg/m2s.
In the field study, it is shown that wind speed, silt content, moisture content and traffic volume and vehicle speed affect the emission factor and result in considerable variability among the mea-sured values even at the same site. The meamea-sured emission factors in this study are comparable to those predicted by previous empirical equations under high wind conditions. However differences exist under calm wind conditions. Since the im-portant factor, wind speed, is not included in any of previous empirical equations, it is therefore concluded that these equations are not suitable for calm wind condition. In this study, an useful empirical equation is developed to predict emis-sion factors based on all measured parameters including wind speed.
Acknowledgements
The authors gratefully acknowledge the
finan-cial support of the Taiwan National Science Council of the Republic of China under grant NSC88-EPA-Z009-001.
References
[1] J.W. Cleaver, B. Yates, Mechanism of detachment of colloidal particles from a flat substrate in a turbulent flow, J. Colloid Interface Sci. 44 (1973) 464 – 473. [2] Y. Kousaka, K. Okuyama, Y. Endo, Reentrainment of
small aggregate particles from a plane surface by air stream, J. Chem. Eng. Jpn 13 (1980) 143 – 147.
[3] H.C. Wang, Effects of inceptive motion on particle de-tachment from surfaces, J. Aerosol Sci. 13 (1990) 386 – 393.
[4] C.J. Tsai, D.Y.H. Pui, B.Y.H. Liu, Elastic flattening and particle adhesion, Aerosol Sci. Technol. 15 (1991) 239 – 255.
[5] S. Matsusaka, H. Masuda, Particle reentrainment from a fine powder layer in a turbulent air flow, Aerosol Sci. Technol. 24 (1996) 69 – 84.
[6] M. Lazaridis, Y. Drossinos, Multilayer resuspension of small identical particles by turbulent flow, Aerosol Sci. Technol. 28 (1998) 548 – 560.
[7] J.S. Evans, D.W. Cooper, J.J. Harrington, Strategies for the optimal control of dust emissions form unpaved roads, JAPCA 33 (4) (1991) 312 – 317.
[8] US EPA, Compilation of air pollutant emission factors, Volume I: Stationary Point and Area Sources, AP-42, fifth ed., 1998.
[9] C. Cowherd Jr., K. Axetell Jr., C.M.G. Maxwell, G.A. Jutze, Development of emission factors for fugitive dust sources, EPA Publication No. EPA-450/3-74/037, NTIS Publication No. PB-238 262, 1974.
[10] J.S. Evans, D.W. Cooper, An inventory of particulate emissions from open sources, JAPCA 30 (12) (1980) 1298 – 1303.
[11] C. Cowherd Jr., R. Bohn, T.M. Cuscino Jr., Iron and steel plant open source fugitive emission evaluation, EPA-600/2-79/103, NTIS Publication No. PB-299 385, 1979. [12] H.E. Hesketh, F.L. Cross, Fugitive Emissions and
Con-trols, Ann Arbor Science Co, New York, 1983. [13] V.A. Marple, L.R. Rubow, S.M. Behm, A microorifice
uniform deposit impactor (MOUDI): description, calibra-tion and use, Aerosol Sci. Technol. 14 (1991) 434 – 446. [14] M.D. Durham, D.H. Lundgren, Evaluation of aerosol
aspiration efficiency as a function of stokes number, velocity ratio and nozzle angle, J. Aerosol Sci. 11 (1980) 179 – 188.