Systematic correlations of the earthquake
frequency-magnitude distribution with the deformation and
mechanical regimes in the Taiwan orogen
Yen-Ling Chen1,2, Shu-Huei Hung1, Juen-Shi Jiang2, and Ling-Yun Chiao3
1
Department of Geosciences, National Taiwan University, Taipei, Taiwan,2Seismological Center, Central Weather Bureau, Taipei, Taiwan,3Institute of Oceanography, National Taiwan University, Taipei, Taiwan
Abstract
We investigate the correlation of the earthquake frequency-magnitude distribution with the style of faulting and stress in Taiwan. The b values estimated for three types of focal mechanisms show significant differences with the lowest for thrust, intermediate for strike slip, and highest value for normal events, consistent with those found in global and other regional seismicity. Lateral distribution of the b values shows a good correlation with the predominant faulting mechanism, crustal deformation, and stress patterns. The two N-S striking thrust zones in western and eastern Taiwan under the larger E-W shortening and differential stress yield the lower b values than those in the in-between mountain ranges subject to the smaller extensional stress and dominated by strike slip and normal faults. The termination of the monotonically decreasing b value with depth at ~15–20 km corroborates its inverse relationship with stress and the existence of the brittle-plastic transition in the weak middle crust beneath the Taiwan orogen.1. Introduction
It has been widely accepted that the Gutenberg-Richter (G-R) law is a robust empirical rule characterizing the power law size distribution of earthquakes both regionally and worldwide [Stein and Wysession, 2003]. The b value, namely, the negative of the slope of the regression line between the logarithm of the cumulative number of events of magnitude M or greater (logN) versus the magnitude (M) [Gutenberg and Richter, 1944], is often used to describe the relative frequency of the occurrence of large and small events, where a lower b value indicates a larger proportion of large earthquakes and vice versa.
Since the pioneering laboratory work of Mogi [1962], the spatial variation of b value has been studied exten-sively and linked to the mechanical heterogeneity in the crust which can differ substantially from one region to another. The presence of material inhomogeneity tends to yield higher b values for the frequency-size distributions of rock microfactures [Mogi, 1962] and sandpile avalanches [Chiao and Liu, 2014]. On the other hand, Scholz [1968] was thefirst to recognize the inverse dependence of b value on applied stress from obser-vations of small cracking events in rocks during compression tests. Wyss [1973] further consolidated the physical underpinning between b value and tectonic stress by introducing the seismic moment as a scale for earthquakes to directly relate the b value to the source parameters of fault area or stress drop. He pointed out that the lower values for the foreshock sequences and crustal events at greater depths were essentially a manifestation of higher stress drops in the source regions.
Since then, estimating the spatiotemporal variations of b value from complete earthquake catalogs has become broadly applied to monitoring the changes of fault strengths and porefluid pressures in seismically and volcanically active regions. The anomalously low b value could even be used for mapping and fore-casting potential rupture areas of imminent large earthquakes [Wiemer and Wyss, 1997]. For instance, Schorlemmer and Wiemer [2005] found that almost all fractions of the slip and aftershocks of 2004 Parkfield earthquake were concentrated on the areas of unusually low b values for the microearthquakes preceding the main shock.
Schorlemmer et al. [2005] establish a universal correlation between the b value and associated type of focal mechanism, concluding that the b values decreasing in the order from normal, strike slip to thrust events are largely governed by the increase in the loading stress required for faulting. Such generic relationship has drawn great attention for the plausible use of b value as an earthquake precursor owing to the fact that the b value may decline as the loading stress builds up before exceeding the frictional strength of the fault
PUBLICATIONS
Geophysical Research Letters
RESEARCH LETTER
10.1002/2016GL069020
Key Points:
• General dependence of the b value with the style of faulting and stress is first verified in the Taiwan orogen • Regional b value variations correlate
well with the crustal deformation and stress regimes manifested from the local tectonics
• The depth-varying b value reveals the brittle-plastic transition at ~15–20 km and a weak middle crust under Taiwan
Supporting Information: • Supporting Information S1 • Figure S1 • Figure S2 Correspondence to: S.-H. Hung, shung@ntu.edu.tw Citation:
Chen, Y.-L., S.-H. Hung, J.-S. Jiang, and L.-Y. Chiao (2016), Systematic correlations of the earthquake frequency-magnitude distribution with the deformation and mechanical regimes in the Taiwan orogen, Geophys. Res. Lett., 43, 5017–5025, doi:10.1002/2016GL069020.
Received 5 APR 2016 Accepted 12 MAY 2016
Accepted article online 16 MAY 2016 Published online 30 MAY 2016
©2016. American Geophysical Union. All Rights Reserved.
zones to cause an earthquake. However, contemporary notion on using temporal b value variations as a robust premonitory indicator for forthcoming sizeable earthquakes still remains challenging with large uncertainties [Del Pezzo et al., 2003].
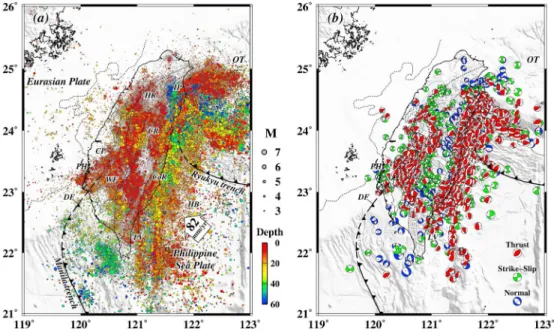
Taiwan is situated at an intertwined convergence of the Eurasian Plate (EP) and the Philippine Sea Plate (PSE), forming the two subduction zones of opposite polarity along the Ryukyu and Manila Trench to the northeast and south of Taiwan, respectively (Figure 1a). Since the late Miocene when the NW moving Luzon arc result-ing from the eastwardly subductresult-ing EP under the Philippine Sea Plate (PSP) began to obliquely collide onto the Chinese continental margin [Suppe, 1984], the still ongoing active orogeny has created the intensively deformed, N-S striking mountain belts and structures in Taiwan. The very rapid rate of crustal deformation on the order of several microstrain per year [Chang et al., 2003] and frequent recurrence of earthquakes (on average about 3 times annually for M> 6) with a diversity of faulting styles make the island one of the most seismically hazardous regions in the world and the best natural laboratories for earthquake studies as well. The investigations of regional seismicity characteristics, including the variations of b value with time and space, have been conducted extensively for decades (see review of Wang et al. [2015]). More recent relevant studies have been addressed more on the issues of seismic mitigation and probabilistic forecast by examining either the spatiotemporal change of the b values before large events such as the 1999 Mw7.6 Chi-Chi earthquake [Chan and Wu, 2013] or the break of the G-R scaling for the events of magnitude
greater than 7 in Taiwan [Wu et al., 2013]. Nonetheless, none of them have appraised whether the correlation of the b value with the style of faulting and stress observed worldwide also holds true in the tectonically complex Taiwan.
In this study, we estimate the lateral and depth variations of the b values to explore their possible correlation with the predominant faulting mechanisms, crustal deformation, and stress regimes in the Taiwan orogen.
Figure 1. Topographic and tectonic map in the vicinity of Taiwan. (a) The map above shows the distribution of earthquakes with depths no greater than 60 km recorded between 1991 and 2015 in the Central Weather Bureau (CWB) catalog used for the b value analysis. (b) Earthquake focal mechanisms used for investigating the faulting-dependent b value. Taiwan, resulting from the oblique convergence between the Philippine Sea Plate (PSP) and Eurasian Plate (EP), is mainly divided intofive lithotectonic units: from west to east, the Coastal Plain (CP), Western Foothills (WF), Hsuehshan Range (HR), Central Range (CR), and Coastal Range (CoR). Dotted lines delineate their boundaries and a 2000 m isopach of the Cenozoic sediments and thin gray lines the surface traces of the active faults in Taiwan. Solid and dashed lines with triangles on the overriding plates show the plate boundaries between the EP and PSP along the Manila Trench in the south and Ryukyu Trench in the northeast of Taiwan with opposite subduction polarity, where the arrow indicates the velocity vector of the PSP relative to the EP. The deformation front (DF), also the boundary between the CP and WF, marks the frontal limit of collision-related deformation and the Longitudinal Valley (LV) the collision suture zone between the EP and PSP. The Okinawa Trough (OT) behind the Ryukyu arc-trench system is a back-arc rifting basin, extending southwestward to the Ilan Plain (IP) in northeast Taiwan.
The results intend to verify whether the b value inversely proportional to the stress level in the crust found worldwide [Schorlemmer et al., 2005; Spada et al., 2013; Nishikawa and Ide, 2014; Scholz, 2015] is also explicitly evident in the highly heterogeneous setting of Taiwan. This is of critical importance for validating the feasibility to use the b value for forecasting the occurrence and location of the rupture asperities of future disastrous earthquakes in Taiwan.
2. Data and Methods
We use the earthquakes occurring at depths less than 60 km between 1991 and 2015 provided by the Central Weather Bureau (CWB) of Taiwan to map the spatial variations of the b values across the lithostructurally heterogeneous Taiwan (Figure 1a). A total of 2640 events with magnitude down to 2.6 and reliable focal mechanisms obtained from ourfirst-motion analysis (Figure 1b) are further selected for examining the faulting-style dependence of the b values.
Because all the modern catalogs span relatively short recording periods compared to earthquake cycles, the log linear frequency-magnitude relationship depicted by the G-R rule usually has a fall-off toward the low and high ends of the magnitudes. Therefore, our analysis only comprises the events between the minimum and maximum magnitude of completeness (Mc), determined, respectively, by choosing the point of the maximum
curvature in the incremental frequency-magnitude curve [Wiemer and McNutt, 1997] and of the discontinuity drop in the cumulative frequency-magnitude diagram. The former mostly influenced by the detection cap-ability of the CWB land-based seismic network has the lowest (<1.5) in the south-central and northern urban areas and the highest (~2.5) offshore eastern Taiwan. The latter is closely related to the activity of the seismo-genic zones which exceeds the magnitude of 6.0 in the collision suture zone in southeast Taiwan and wes-ternmost Ryukyu Trench offshore northeast Taiwan. Both the linear least squares regression [Bevington and Robinson, 1992] and maximum likelihood method [Aki, 1965] are carried out and cross checked to determine the b value that bestfits the G-R rule in the log linear fashion within the determined interval of the event mag-nitudes. The standard deviation of the b value obtained fromfitting the linear relationship of log N = a bM is then calculated by the squared root of s2
logN;M=SSMM, where s2logN;Mis the variance of logN defined by the sum
of squared errors between the observed and predicted logN divided by degree of freedom and SSMMis the
sum of squared differences between M and its mean [Bevington and Robinson, 1992]. All the b values and cor-responding standard deviations shown in the followingfigures are estimated by the linear regression and error analysis.
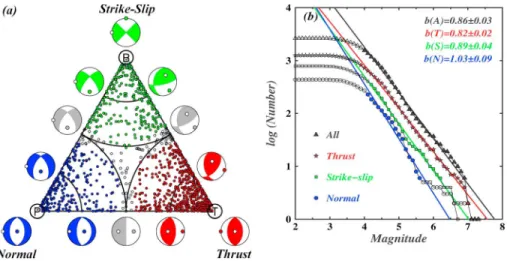
While attesting to the b values really changing significantly for different types of focal mechanisms, we first categorize the selected events into three groups with the predominance of normal, strike slip, and thrust faulting. Conventionally, rake or slip angle along the fault plane measured counterclockwise from the strike azimuth is used to classify the fault types, giving the slip angle of 30° to 150° for thrust, 150° to 30° for normal, and else for strike-slip fault. However, resolving the ambiguity in identifying the actual fault plane from two nodal planes provided by earthquake fault plane solutions requires thefinite-source model or addi-tional evidence such as surface ruptures and aftershock distributions which are often not available for small-and medium-sized earthquakes. An alternative ternary graph relying on the plunge angles of three principal axes, T (tension), B (bisector), and P (pressure) of focal mechanisms [Frohlich, 1992], is thus adopted to quan-tify the relative proportion of each type of fault motion (Figure 2a).
For the lateral distribution of the b values, wefirst divide the study area into cells of equal sizes that partially overlap with immediately adjacent ones. Then we determine the Mcfor the earthquakes distributed inside each cell and estimate the b value from the events of magnitudes between the determined minimum and maximum Mc. The resulting variations are compared with the predominant style of faulting indicated by
the summation of the equivalent moment tensors of all the available fault plane solutions within each cell [Kostrov, 1974] as well as the crustal strain rate and stressfields deduced from the GPS measurements. To ensure the high accuracy of hypocentral depths and reduce the regional variability of the crustal strength between diverse deformation regimes, we estimate the depth-varying b values of the earthquakes according to the lithotectonic division and restrict our analysis to the onshore events with the adequate station cover-age such that the depth uncertainty are less than 2 km. Following the similar procedure, we calculate the b values of the events at the overlapping depth intervals offixed width. The optimal grid size of the cell and width of the depth interval are chosen through trial and error in order to obtain stable and reliable variations
in b value which would simultaneously span large lateral and vertical extents and achieve the highest possi-ble resolution in the region of interest. Since there are uncertainties in the earthquake epicenter locations and focal depths and the seismicity in some local areas and depth intervals can be too sparse to make robust esti-mates, we choose to calculate the b values in partially overlapping cells and depth intervals to prevent unrea-listic discontinuous and rapidly oscillating variations.
3. Lateral Variations of the
b Value and Stress
Figure 2b displays the b values obtained with the linear regressionfits to the entire earthquake catalog used and subsets of the events associated with three different types of focal mechanisms. Apparently, there exists significant difference in the 95% confidence interval, with the lowest (0.82 ± 0.02), intermediate (0.89 ± 0.03), and highest (1.03 ± 0.09) values for the thrust, strike slip, and normal events, respectively. Such increasing trend is consistent with those observed in global and other regional seismicity [Schorlemmer et al., 2005]. The overall b value of 0.86 ± 0.03 is lower than the global average of about 1, probably attributed to very high deformation rates and the predominance of thrust-fault earthquakes in the active Taiwan orogenic belt and two neighboring subduction zones.
Because the b values in a variety of tectonic settings all obey the universal dependence on the style of fault-ing, the effective differential stress in the Earth’s crust known to have a pronounced influence on the failure mode have been advocated as the underlying cause. The regions with the lower b values are essentially subject to higher stress states that hence results in predominant thrust faulting [Schorlemmer et al., 2005]. In other words, the b value can act as a stress meter and even a premonitory indicator in the seismically vulnerable urban areas [Schorlemmer and Wiemer, 2005]. As the stress regime in Taiwan has undergone a rapid transition from the subduction-related extension in northeast Taiwan induced by the southward retreat of the Ryukyu Trench to the collisional compression in the south-central Taiwan by the northwest indentation of the Luzon arc into the Chinese continental margin [Chang et al., 2003], it would be of great interest to know whether the applied tectonic stress spatially correlates with the b value variation.
In Figure 3a, we display the lateral variations of the b values and their standard deviations as well as the summed moment tensors estimated in the overlapping cells of 0.15° in latitude by 0.15° in longitude, shifted by 0.1° in either dimension. We have tried different grid sizes and overlap values of the cells to ensure that the
Figure 2. (a) The Frohlich’s triangle diagram used to classify the focal mechanisms shown in Figure 1b into normal, strike slip, and thrust types of faulting, denoted by blue, green, and red dots, respectively. The vertices of the triangle correspond to the events with the dip angle of either one of the three principal stress axes (P, B, and T) to be vertical and the other two to be horizontal. Those with ambiguous types of faulting, i.e., the differences of the dip angles for any paired principal axes to be less than 5°, shown by open dots are excluded in the faulting-dependent analysis. (b) Cumulative frequency-magnitude distributions for all (A) the events and those comprising only normal (N), strike slip (S), and thrust (T) mechanisms, as denoted by triangles, stars, squares, and circles, respectively. Only the cumulative numbers of the events between the determined minimum and maximum Mc(denoted by color-filled symbols) are used in the linear regression. Annotations on the top right
resulting features are robust. Figure S1 in the supporting information displays the b value variations from one of these trials using the 0.1°×0.1°, nonoverlapping grid cells, which are essentially similar to those shown in Figure 3a. Overall, the b values in regions showing thrust faulting as the representative focal mechanism tend to be lower than those dominated by normal and strike-slip mechanisms. To further explore the spatial cor-relation of the b values with crustal deformation and stress regimes, we make comparisons with the strain ratefield in Taiwan calculated from the average horizontal velocities between 2004 and 2009 measured by the island-wide, dense continuous CWB GPS array [Shin et al., 2011] (Figure 3b). The trajectories of the actual stressfield mapped from compilation of earthquake fault plane solutions, borehole breakout, and Quaternary fault slip and paleostress data have shown the similarity to those of the strain ratefield [Chang et al., 2003]. We thus take the calculated strain ratefield as crude indicators of the variations in the directions of compres-sive and extensional principal stresses and relative magnitudes of the mean and differential stresses across Taiwan (Figure 3b).
It is evident that there are two prominent thrust zones extending from north to south and running parallel to the main structural lines of Taiwan (Figure 1b). These zones are mostly overlapped with the Western Foothills (WF) in the west and the Coastal Range (CoR) in the east, where the former comprises the fold and thrust belt in the frontal part of the Taiwan orogen and the latter the Luzon volcanic arc and fore-arc basin that had encroached onto the Chinese continental margin. Their south-central part currently accommodates most of the lateral crustal shortening and greater differential stress (strain rate) onland (Figure 3b), resulting in the very high rate of seismicity with relatively lower b values.
In addition, Figure 1b clearly reveals an intriguing deformation regime sandwiched between the two elon-gated thrust zones and mostly featuring the strike slip and normal fault events which has not been previously addressed. The in-between stuffed, less-deformed regime covering most of the Central Range (CR) and north-ern part of the Hsuehshan Range (HR), in general, show the higher b values. It appears to be further separated into two parts by a seismically quiet zone in the middle of the CR (Figure 1a). Plentiful strike-slip events are distributed in its peripheral zone, especially to the west juxtaposed with the thrust events around the convex
Figure 3. (a) Lateral variations of the b values estimated from the events within 0.15° by 0.15° overlapping cells, shifted by 0.1° in either the latitude or longitude dimension. White contours indicate the corresponding standard deviations ranging from 0.01 to 0.05. The focal sphere represents the summed moment tensor of the available events in each cell. Only the b values estimated from the chosen events in the cells covering the magnitude range of at least two scales are shown. (b) The differential strain ratefield calculated from the difference between the two principal strain rates deduced from GPS horizontal displacement measurements over the years of 2004–2009. Black inward and gray outward arrows referring to horizontal compression and extension, respectively, indicate the directions of the two principal strain rate axes with the lengths proportional to the magnitudes of the principal strain rates.
point of an arc-shaped seismogenic zone in the WF, which had been thought to be pushed against from behind by the rigid Peikang High (PH) resulting from a pre-Tertiary uplift of the foreland basement [Lu and Malavieille, 1994]. This overlay region is still dominated by strike-slip faulting as indicated by the summed moment tensors, coinciding with a streak region of higher b values around 23.5°N surrounded by the areas of lower b values to the north and south (Figure 3a).
Farther from the central part of the mountain belts, the normal-fault events become more abundant, parti-cularly in the vicinity of the northeast and eastern offshore and south and southwestern offshore Taiwan. Strongly influenced by the spreading Okinawa Trough (OT) that has extended onto the northeast corner of Taiwan in the Ilan Plain (IP) and the migration of the Ryukyu Trench, the present northern part of the Taiwan orogen has been attributed to a postcollisional stage of extensional collapse as evidenced by wide-spread tensional structures and shallow normal-fault earthquakes found in northeast Taiwan as well as the waning topography and thinning crust toward the southern Ryukyu region [Teng, 1996]. The geodetic obser-vations confirm that the crust in these regions is undergoing lateral expansion with the maximum exten-sional axis rotating from the NNE-SSW in central Taiwan parallel to the strike of the orogenic belts to the NW-SE in northeast Taiwan to the opening direction of the OT (Figure 3b). Except in the vicinity of the IP situ-ated at the junction of collision,flipping of subduction, and back-arc spreading [Suppe, 1984] where the earthquakes are of mixed-type faulting mechanisms and differential strain rates moderately higher, the rest of the region shows the higher b values associated with relatively lower differential strain rates or stresses. Thesefindings are consistent with the notion that of the b value has a strong dependence on the style of faulting and negative correlation with the stress.
Because of the oblique collision that resulted in the orogen propagating southward through time [Suppe, 1984], the southwestern Taiwan and contiguous offshore region, by contrast, remain in the incipient/precollisional phase and morphologically characterized by the outgrowth of the accretionary wedge produced from the east-ward underthrusting of the EP under the overriding PSP. The region, albeit located in the least active seismic zone of Taiwan, still occasionally document moderate to large (M≥ 7) earthquakes, including the 2006 Pintung earthquake doublet with the normal faulting followed by the strike-slip mechanism. The regional seis-micity exhibits the predominant normal faults with the maximum extensional axes aligned either SW-NE paral-lel to the expected direction of tectonic escape indented by the PH [Lu and Malavieille, 1994] or E-W to the direction of bending stress in the subducted EP. The resulting b values are also higher compared to those in the active thrust zones.
4. Depth Dependence of the
b Value
As shown previously in Spada et al. [2013], the b value observed in the continental regions worldwide decreases monotonically with depth in the uppermost 5–15 km of the crust where the differential stress gov-erned by the brittle frictional strength of faults follows a linearly increasing trend with lithostatic pressure (depth) down to the brittle-plastic transition. Using the vertical gradient of differential stress calculated for each style of faulting, Scholz [2015] converted the measured b values as a function of depth to be stress dependent, which all fall on a straight line with a very good negative correlation with stress. It is also demon-strated that the increase of the b value with both the subducting plate age and trench depth observed in glo-bal subduction zones [Nishikawa and Ide, 2014] are physically related to the reduction of the net plate-interface normal force and hence the decreasing differential stress since the older slabs would have thicker and more negatively buoyant lithosphere [Scholz, 2015]. The invariability of the linearly inverse relationship between b value and stress leads to greater confidence in using the b value as a stress meter to characterize the crustal mechanical properties and strengths of fault zones.
Kidder et al. [2012] constructed the stress-depth profile beneath the Taiwan mountain belts by integrating multiple constraints from recrystallized grain size piezometry in quartz collected in central HR and taper mea-surements across the central Taiwan orogenic wedges [Carena et al., 2002]. The resulting strength envelope has a linear increase of stress with depth down to the depth of ~12 km at the brittle-plastic transition and a fairly weak middle crust at depths of ~15–25 km (Figure 4a). However, in contrast with the linearly increasing strength in the brittle upper crust under the assumption of hydrostatic porefluid pressure, Suppe [2014] sug-gested that the approximately constant strength for the overpressured brittle crust below thefluid retention depths of ~3–3.5 km commonly found in the western Taiwan thrust belt. To verify whether the crustal
strength in Taiwan can be manifested by the b values, we estimate their depth variations from the events divided by the lithotectonic units at a number of overlapping depth intervals of constant width varying from 6 to 10 km and shifted in every 2 km (Figures 4b–4f). We also compare the b values obtained with the different overlap value for the 6 km wide depth intervals, indicating very little influence on their overall
Figure 4. (a) Two typical types of the stress-depth profiles in the crust proposed for the Taiwan orogen, either having the linearly increasing brittle strength in the hydrostatic upper crust [Kidder et al., 2012] or approximately constant strength within the overpressured upper crust [Suppe, 2014] (b–f) The b values and twice the standard errors as a function of depth estimated from the events located in thefive major lithotectonic units. Except in the CoR of east Taiwan, the earthquakes in the Chinese continental margin all reveal a negative b value gradient in the brittle upper crust at the depths of ~10–20 km, below which the reverse sign of the gradient indicates the occurrence of the brittle-plastic transition in the middle crust. Note that the two numbers next to the symbol annotated on the bottom left of the plot are the width and shifting distance of each overlapping depth interval, respectively, used in estimating the variation of b value with depth.
depth-varying characteristics (Figure 4). Except for the CoR situated in the PSP with a much thinner oceanic crust and distinct rheology, the b values in the orogenic belts (HR and CR), frontal orogenic wedge (WF), and foreland basin in the western Coastal Plain (CP) which are all affiliated with the Chinese continental margin reveal a monotonic decrease with depth in the upper part of the crust ranging from ~5–10 to ~15–20 km, reaching the minima at depths of ~15–20 km followed by a reverse trend at further increasing depths. In concurrence with the established inverse relation between b value and stress, these turning points mark the peak strengths in the crust below which the brittle-plastic transition occurs, which generally agrees with the depth ranges estimated from theflexure modeling in the west Taiwan basin with the effective elastic thickness of ~13 km [Lin and Watts, 2002], brittle wedge tapers confined at depths < 15–20 km [Carena et al., 2002], and peak strength at ~12 km recorded in recrystallized quartz grains [Kidder et al., 2012]. Besides, it is noted that the b values beneath the CoR are generally higher (>1) than elsewhere beneath Taiwan at the same depth greater than 20 km. Seismic evidence indicates that the crust is about 23 ± 2 km thick beneath the Longitudinal Valley suture zone between the EP and PSP [Liang et al., 2007] and immedi-ately becomes a normal thickness (<10 km) beneath the Huatung Basin (HB in Figure 1a) offshore eastern Taiwan [McIntosh et al., 2005] located in a relatively young, 15–30 Ma old oceanic lithosphere [Kuo et al., 2009]. The larger b values associated with the lower differential stresses may imply the presence of the mechanically weaker oceanic upper mantle beneath the CoR.
Though there is no clear evidence for a constant b value, namely, constant brittle strength, throughout the depths of 5–15 km in the overpressured upper crust as suggested by Suppe [2014], we do notice that the change of the b value with depth in the shallow depths of ~5–10 km either is insignificant within the uncer-tainty range beneath the western Taiwan (CP and WF) or has a less steep but positive gradient beneath the mountain belts (HR and CR). This may imply that the presence of nonhydrostaticfluid pressures in the impermeable shale-rich thrust belts often found in western Taiwan is very likely to alter the linearly increasing strength with depth in the uppermost brittle crust [Suppe, 2014].
5. Conclusions
Our analysis demonstrates that the b value dependence on the faulting style and stress holds for Taiwan that encompasses the diversity and complexity of deformation domains. Compared with the stressfield deduced from dense GPS observations, we corroborate that the earthquake frequency-magnitude distributions are lar-gely governed by the underlying stress conditions, having the lower values in the two thrust zones of western and eastern Taiwan under the larger compressive stresses and higher values in the extensional mountain ranges sandwiched in-between. Besides, the b values varying with depth clearly reflect the characteristics of the crustal rheology in the Taiwan orogen. It reveals a brittle upper crust with the strength increasing with depth down to ~15–20 km, followed by a transition to plastic deformation in the weak middle crust. Ourfindings imply that the b value has the potential to act as a stress meter not only to help illuminate the deformation patterns and mechanical properties of crustal rocks at great depths in the active continental margin but also to monitor the spatiotemporal changes of the differential stresses as warning signs of forth-coming earthquakes. However, it is worth mentioning that the earthquakes occurring within the vicinity of the same seismic province in Taiwan usually comprise mixed-type focal mechanisms. As such, it should be cautioned to directly apply the reduced b value estimated from all the events within a short time window for a reliable precursor since it can be also modified by the change of the style of faulting.
References
Aki, K. (1965), Maximum likelihood estimate of b in the formula log (N) = a bM and its confidence limits, Bull. Earthq. Res. Inst. Tokyo Univ., 43, 237–239.
Bevington, P. R., and D. K. Robinson (1992), Data Reduction and Error Analysis for the Physical Sciences, 2nd ed., McGraw-Hill, New York. Carena, S., J. Suppe, and H. Kao (2002), Active detachment of Taiwan illuminated by small earthquakes and its control offirst-order
topography, Geol. Soc. Am., 30(10), 935–938.
Chan, C.-H., and Y.-M. Wu (2013), Maximum magnitudes in aftershock sequences in Taiwan, J. Asian Earth Sci., 73, 409–418. Chang, C.-P., T.-Y. Chang, J. Angelier, H. Kao, J.-C. Lee, and S.-B. Yu (2003), Strain and stressfield in Taiwan oblique convergent system:
constraints from GPS observation and tectonic data, Earth Planet. Sci. Lett., 214(1-2), 115–127.
Chiao, L.-Y., and Q. Liu (2014), Dependence of sandpile avalanche frequency-size distribution on coverage extent and compactness of embedded toppling threshold heterogeneity: Implications for the variation of Gutenberg-Richter b value, Nonlin. Proc. Geophys., 21(6), 1185–1193. Del Pezzo, E., F. Bianco, and G. Saccorotti (2003), Duration magnitude uncertainty due to seismic noise: inferences on the temporal pattern of
G-R b-value at Mt. Vesuvius, Italy, Bull. Seismol. Soc. Am., 93(4), 1847–1853.
Acknowledgments
We thank the CWB of Taiwan for the earthquake database used in this study. We also wish to thank N. Nishikawa, an anonymous referee, and Editor J. Ritsema for their comments to help improve the manuscript, and Y.-B. Tsai and H. Kao for discussions. This work was supported by the grants of the Ministry of Science and Technology (MOST) of Taiwan 103-2116-M-002-023 and 104-2116-M-002-002 (S.H.H.).
Frohlich, C. (1992), Triangle diagrams: Ternary graphs to display similarity and diversity of earthquake focal mechanisms, Phys. Earth Planet. Int., 75(1–3), 193–198.
Gutenberg, B., and C. F. Richter (1944), Frequency of earthquakes in California, Bull. Seismol. Soc. Am., 34(4), 185–188.
Kidder, S., J.-P. Avouac, and Y.-C. Chan (2012), Constraints from rocks in the Taiwan orogen on crustal stress levels and rheology, J. Geophys. Res., 117, B09408, doi:10.1029/2012JB009303.
Kostrov, B. V. (1974), Seismic moment and energy of earthquakes, and seismicflow of rock, Acad. Sci. USSR Phys. Solid Earth, Engl. Transl., 1, 13–21.
Kuo, B.-Y., W.-C. Chi, C.-R. Lin, T.-Y. Chang, J. Collin, and C.-S. Liu (2009), Two-station measurement of Rayleigh-wave phase velocities for the Huatung basin, the westernmost Philippine Sea, with OBS: implications for regional tectonics, Geophys. J. Int., 179, 1859–1869, doi:10.1111/j.1365-246X.2009.04391.x.
Liang, W.-T., J.-M. Chiu, and K. Kim (2007), Anomalous Pn waves observed in eastern Taiwan: Implications of a thin crust and elevated oceanic upper mantle beneath the active collision-zone suture, Bull. Seismol. Soc. Am., 97(4), 1370–1377.
Lin, A. T., and A. B. Watts (2002), Origin of the West Taiwan basin by orogenic loading andflexure of a rifted continental margin, J. Geophys. Res., 107(B9), 2185, doi:10.1029/2001JB000669.
Lu, C.-Y., and J. Malavieille (1994), Oblique convergence, indentation and rotation tectonics in the Taiwan Mountain Belt: Insights from experimental modelling, Earth Planet. Sci. Lett., 121, 477–494.
McIntosh, K., Y. Nakamura, T. K. Wang, R. C. Shih, A. Chen, and C. S. Liu (2005), Crustal-scale seismic profiles across Taiwan and the western Philippine Sea, Tectonophys, 401, 23–54.
Mogi, K. (1962), Magnitude-frequency relations for elastic shocks accompanying fractures of various materials and some related problems in earthquakes, Bull. Earthquake Res. Inst. Univ. Tokyo, 40, 831–853.
Nishikawa, T., and S. Ide (2014), Earthquake size distribution in subduction zones linked to slab buoyancy, Nat. Geosci., 7(12), 904–908. Scholz, C. H. (1968), The frequency-magnitude relation of microfracturing in rock and its relation to earthquakes, Bull. Seismol. Soc. Am., 58(1),
399–415.
Scholz, C. H. (2015), On the stress dependence of the earthquake b value, Geophys. Res. Lett., 42, 1399–1402, doi:10.1002/2014GL062863. Schorlemmer, D., and S. Wiemer (2005), Earth science: Microseismicity data forecast rupture area, Nature, 434(7037), 1086–1086. Schorlemmer, D., S. Wiemer, and M. Wyss (2005), Variations in earthquake-size distribution across different stress regimes, Nature, 437(7058),
539–542.
Shin, T.-C., K.-W. Kuo, P.-L. Leu, C.-H. Tsai, and J.-S. Jiang (2011), Continuous CWB GPS array in Taiwan and applications to monitoring seismic activity, Terr. Atmos. Ocean. Sci., 22(5), 521–533.
Spada, M., T. Tormann, S. Wiemer, and B. Enescu (2013), Generic dependence of the frequency-size distribution of earthquakes on depth and its relation to the strength profile of the crust, Geophys. Res. Lett., 40, 709–714, doi:10.1029/2012GL054198.
Stein, S., and M. Wysession (2003), An introduction to seismology, earthquakes, and Earth structure, Geol. Mag., 140(6), 733–734. Suppe, J. (1984), Kinematics of arc-continent collisionflipping of subduction, and back-arc spreading near Taiwan, Mem. Geol. Soc. China, 6,
21–33.
Suppe, J. (2014), Fluid overpressures and strength of the sedimentary upper crust, J. Struct. Geol., 69, 481–492. Teng, L. S. (1996), Extensional collapse of the northern Taiwan mountain belt, Geology, 24(10), 949–952.
Wang, J.-H., K.-C. Chen, P.-L. Leu, and J.-H. Chang (2015), b-Values observations in Taiwan: A review, Terr. Atmos. Ocean. Sci., 26(5), 475–492. Wiemer, S., and S. R. McNutt (1997), Variations in the frequency-magnitude distribution with depth in two volcanic areas: Mount St. Helens,
Washington, and Mt. Spurr, Alaska, Geophys. Res. Lett., 24, 189–192, doi:10.1029/96GL03779.
Wiemer, S., and M. Wyss (1997), Mapping the frequency-magnitude distribution in asperities: An improved technique to calculate recurrence times?, J. Geophys. Res., 102, 15,115–115,128, doi:10.1029/97JB00726.
Wu, Y. H., C. C. Chen, D. L. Turcotte, and J. B. Rundle (2013), Quantifying the seismicity on Taiwan, Geophy. J. Int., 194(1), 465–469. Wyss, M. (1973), Towards a physical understanding of the earthquake frequency distribution, Geophys. J. R. Astron. Soc., 31, 341–359.