行政院國家科學委員會專題研究計畫 成果報告
模擬退火參數偵測系統於物件偵測與震測圖形之應用(II)
研究成果報告(精簡版)
計 畫 類 別 : 個別型
計 畫 編 號 : NSC 97-2221-E-009-149-
執 行 期 間 : 97 年 08 月 01 日至 98 年 07 月 31 日
執 行 單 位 : 國立交通大學資訊工程學系(所)
計 畫 主 持 人 : 黃國源
計畫參與人員: 碩士班研究生-兼任助理人員:謝岳勳
碩士班研究生-兼任助理人員:廖梓淵
碩士班研究生-兼任助理人員:戴于珊
報 告 附 件 : 出席國際會議研究心得報告及發表論文
處 理 方 式 : 本計畫可公開查詢
中 華 民 國 98 年 10 月 06 日
1
行政院國家科學委員會專題研究計畫成果報告
模擬退火參數偵測系統於物件偵測與震測圖形之應用(II)
Simulated Annealing Parameter Detection System for Object
Detection and Seismic Applications (II)
計畫編號:NSC 97-2221-E-009-149
執行期限:97 年 8 月 1 日至 98 年 7 月 31 日
主持人:黃國源 交大資訊工程系 [email protected]
一、中文摘要
我們提出利用模擬退火演算法的圖形偵測
系統,偵測直線、圓、橢圓、與雙曲線的
參數。此一系統利用模擬退火演算法求得
的參數,會使得誤差為全域的最佳化(最小
值),因而能夠使得偵測的直線、圓、橢圓、
與雙曲線的參數將更精確,但受限於圖形
的公式,不能同時偵測橢圓與雙曲線,所
以我們提出新的圖形公式及階層式的圖形
偵測系統,可減少大量參數之計算,及可
用於大量圖形之偵測上。階層式的圖形偵
測系統因其降溫次數較少,可得到更快的
收斂。在實驗上,我們將應用於偵測震測
圖形中的直線的直接波與雙曲線的反射波
的參數,其震測圖形包含模擬震測圖形與
實際震測圖形,偵測的結果將有助於震測
訊號的解釋與進一步的速度分析之處理。
關鍵詞:模擬退火、全域最佳化、類神經
網路、震測圖形。
Abstract
We propose the pattern detection
system using simulated annealing that can
detect the parameters of the lines, circles,
ellipses, and hyperbolas. But it can not
synchronously detect ellipses and
hyperbolas due to the limitation of the used
formulas of patterns. So we propose the
hierarchical system to reduce the number of
parameters in computation, and to detect the
large number of patterns. After the success
in image pattern detection, we apply it to
detect the parameters of the line of direct
wave and the hyperbola of reflection wave
in the simulated one-shot seismogram and
real seismic data. The detection results of
the system can improve the seismic
interpretations and the further seismic
velocity analysis.
Keywords: simulated annealing, global
optimization, neural network, seismic
pattern.
二、緣由與目的
近年來,類神經網路之研究在國內外
受到相當的重視,其應用的領域更是相當
廣泛,尤其是圖形識別上的應用。
1983
年 ,
Kirkpatrick 等 人 提 出 的 模 擬 退 火
simulated annealing (SA) [1]這個全域最佳
化的方法,並且成功的運用在解決各種排
列組合的問題上。在
1987 年,Corana 等
人成功的運用模擬退火的方法來解決連續
函數的最佳化問題[2]。我們便利用模擬退
火的全域最佳化特性提出一個參數偵測系
統來最小化點到圖形間的距離。
模擬退火參數偵測系統先從直線、
圓、橢圓、與雙曲線著手,藉由找出目標
函數的最佳解而達到偵測其參數的目的
[3]-[4]。 但其有無法同時偵測橢圓與雙曲
線的缺點。在此,我們提出「階層式的模
擬退火演算法偵測直線、圓、橢圓、與雙
曲線的參數」之系統(hierarchical detection
system),改良之前提出的系統,重新定義
圖形表示的公式。我們將把此系統運用於
偵測震測圖形的參數,偵測單炸點震測圖
中的直接波(直線)與反射波(雙曲線),運
用模擬退火全域最佳化的特性,更精確的
提供直接波、反射波的參數,對於了解地
層特性有很大的幫助。
我們首先給予每個圖形(直線、圓、橢
圓)一組初始的參數。接著,對於每一個輸
入點,計算點到每一個圖形的距離。然後
計算點對所有圖形的總誤差值,並且利用
模擬退火的方法來修正每個圖形的參數,
藉以找到使得誤差值最小的參數,如
Fig. 1
所示。
Input
N data
Simulated annealing parameter
detection system
Detected parameters
Detected K patterns
Fig. 2. Block diagram of the SA detection.
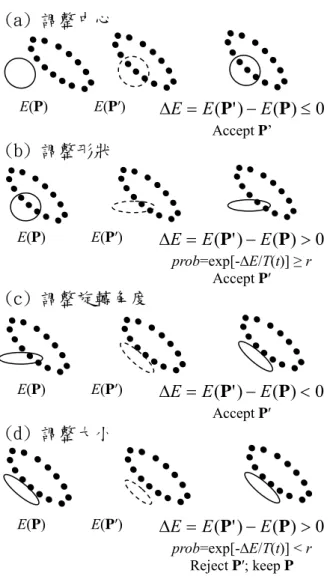
(a) 調整中心
E(P) E(P′)
Δ
E
=
E
(
P
'
)
−
E
(
P
)
≤
0
Accept P’(b) 調整形狀
E(P) E(P′)
Δ
E
=
E
(
P
'
)
−
E
(
P
)
>
0
prob=exp[-∆E/T(t)] ≥ r Accept P′(c) 調整旋轉角度
E(P) E(P′)Δ
E
=
E
(
P
'
)
−
E
(
P
)
<
0
Accept P′(d) 調整大小
E(P) E(P′)Δ
E
=
E
(
P
'
)
−
E
(
P
)
>
0
prob=exp[-∆E/T(t)] < r Reject P′; keep PFig. 1. Illustration of parameter learning.
Fig. 2 shows the proposed detection
system. It takes the N data as the input,
followed by the SA parameter detection
system to detect a set of parameter vectors
of K patterns. After convergence, patterns
are recovered from the detected parameter
vectors.
SA parameter detection system consists
of two main parts: 1. definition of system
error (energy, distance); 2. SA algorithm for
determination of the parameter vectors with
minimum error.
We use a general equation based on the
translation and rotation of the standard type
of ellipse and hyperbola.
f
m
y
m
x
b
m
y
m
x
a
y x y x=
−
+
−
−
+
−
+
−
2 2]
cos
)
(
sin
)
(
[
]
sin
)
(
cos
)
[(
θ
θ
θ
θ
(1)
Table 1 lists the relation between a, b, f, and
the graph. When an ellipse has the same a
and b, the graph represents as a circle.
Table 1 Relation between graph and a, b, f
in the equation (1).
三、結果與討論
(1) 結果:
(a) Simulated Annealing Parameter
Detection System
a b f Graph
+
+
+
Ellipse
-
-
-
Ellipse
+
-
0 Asymptote
-
+
0 Asymptote
The distance from a point x
i= [x
iy
i]
Tto
the kth pattern is defined as
.
|
]
cos
)
(
sin
)
(
[
]
sin
)
(
cos
)
[(
|
)
,
(
2 , , 2 , , k k y k i k x k i k k y k i k x k i k i i kf
m
y
m
x
b
m
y
m
x
a
y
x
d
−
−
+
−
−
+
−
+
−
=
θ
θ
θ
θ
(2)
Error or distance from a point to all K
patterns is defined as the minimal distance
from the point to all patterns. The error or
energy of the ith point x
iis
Image patterns: line 1, hyperbola 2, hyperbola 3,
(
1 2)
min ( ), ( ), , ( ), , ( ) i i i k i K E = d x d x K d x K d xiFi
(3)
hyperbola 4
where K is the total number of patterns. If
the point is on any pattern, the error of this
point will be zero.
Line1
Remaining data
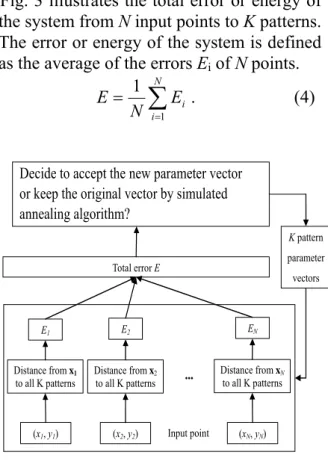
g. 3 illustrates the total error or energy of
the system from N input points to K patterns.
The error or energy of the system is defined
as the average of the errors E
iof N points.
Hyperbola 2 and hyperbola 4
Remaining data
∑
==
N i iE
N
E
11
. (4)
Total error E ... E1 (x1, y1) EN (xN, yN) Input point E2 Distance from x2 to all K patterns (x2, y2) Distance from xN to all K patterns Distance from x1 to all K patterns K pattern parameter vectorsDecide to accept the new parameter vector
or keep the original vector by simulated
annealing algorithm?
Fig. 1. Total error and steps of simulated
he concept of removing the detected
tion, instead of
us
Fig. 4. An example of hierarchical pattern
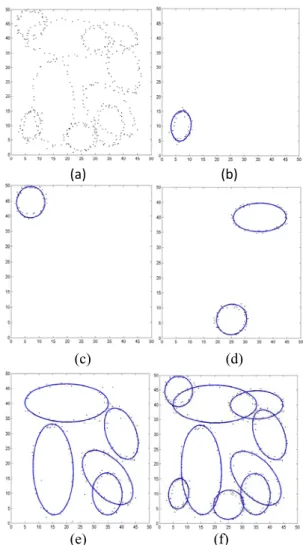
) Experimental Results
The hierarchical parameter detection
sys
nd 5(b), we set K = 2 to
detect two overlapped ellipses and two
dete
ge
num
annealing.
Hyperbola 3
recognition for seismic patterns.
(b
tem can detect circles, ellipses,
hyperbolas, and treats line as asymptote at
the same time. Fig. 5 shows the detection
result of mixing ellipse, hyperbola, and line
in an image. The images are with size 50 ×
50. Patterns are with Gaussian noise N(0,
0.5)×N(0, 0.5).
In Fig. 5(a) a
overlapped hyperbolas. In Fig. 5(c), we
detect two overlapped patterns. In Fig. 5(d)
and 5(e), the detected line is a hyperbola
with small size f. In Fig. 5(f), since an
asymptote is a pair of crossing lines, we set
K = 1 and f = 0 to detect two crossing lines.
We use the hierarchical parameter
T
patterns is proposed below.
In seismic pattern detec
ing pattern detection at one time, we use a
hierarchy of pattern detection. The concept
of the system is like hierarchical clustering
algorithm. Fig. 4 illustrates an example of
the hierarchical pattern detection of seismic
patterns. We number each pattern in the
image which consists of one line and three
hyperbolas. At first, line 1 is
detected and
removed. Then hyperbola 2 and hyperbola 4
are detected and removed from the
remaining data. Move on to detect the
hyperbola 3 as Fig. 4 shown. Eventually the
patterns can be detected patterns by patterns
in the hierarchical system.
ction system to detect nine patterns as
shown in Fig. 6. The initial parameter m
k,x=
25, m
k,y=25, a
k= 1, b
k= 1, θ
k= 0, f
k= 1, α
m=
1, α
ab= 1, α
θ= 6, α
f= 4, T
α= 0.85, T
max= 10,
N
t= 60, and cooling cycle 10 times. Patterns
are with Gaussian noise N(0, 0.5)×N(0, 0.5).
Fig. 6(a) shows the input data and Fig.
6(b)-(e) shows the process of the
hierarchical parameter detection system.
We can see the detection result of a lar
ber of patterns is good under
hierarchical detection system. So we use the
hierarchical parameter detection system on
the simulated seismic data and real seismic
data.
(a) (b)
(c) (d)
(e) (f)
Fig.
6. (a) Nine patterns as input data. (b)
First detection result. (c) Second detection
result. (d) Third detection result. (e) Fourth
detection result. (f) Final detected result of
hierarchical detection system.
(a) (b)
(c) (d)
(e) (f)
Fig.
5. Detection of ellipses, hyperbolas, and
ig. 7(a) and 7(b) show the simulated
one
e real data in Fig. 7(b) is at Canadian
Artic, which has 48 traces and 3,100
lines. (a) 2 ellipses. (b) 2 hyperbolas. (c) 1
ellipse and 1 hyperbola. (d) 1 ellipse and 1
line. (e) 1 hyperbola and 1 line. (f) 2 lines.
(a) (b)
Fig.
7. (a) Simulated one-shot seismogram
(horizontal reflection layer). (b) Real
seismic data at Canadian Artic.
F
-shot seismogram and real seismic data
at Canadian Artic. The one-shot seismogram
is first preprocessed by envelope processing,
thresholding with the threshold 0.15, and
peak detection and shown in Fig. 8 (a). The
detection result of Fig. 8(a) is shown in Fig.
8(d).
Th
samples per trace with sampling interval
0.002 seconds. The hierarchical system is
applied to detect direct wave and reflection
wave in real seismic data.
After preprocessing, we only choose
points with t < 1.4 seconds, which include
points from direct wave, first layer reflection
5
wave, and second layer reflection wave as in
Fig. 9(a). The detection result is shown in
Fig. 9(b).
(a)
(b)
(c)
(d)
Fig.
8. Detection results of seismic patterns.
(a) After preprocessing of Fig. 7(a). (b) First
detection result by hierarchical system. (c)
The remaining data after first detection. (d)
Final detection result by hierarchical system.
(a) (b)
Fig.
9. (a) After preprocessing of Fig. 7(b),
choose peaks with t < 1.4 seconds. (b) Final
detection result by hierarchical system.
(2) 討論:
We have proposed a hierarchical system
using simulated annealing for the detection
of lines and hyperbolas, sequentially
patterns by patterns. The simulated
annealing has the capability of searching a
set of parameter vectors with global minimal
error. The general equation of hyperbolas in
detection is from translation and rotation of
standard equation. We have defined the
distance from all points to all patterns.
Experimental results of hierarchical
system to detect the line pattern of direct
wave and the hyperbolic pattern of
reflection wave in one-shot seismogram and
the real seismic data are good. It is
necessary to test the parameter values for the
convergence of SA for further work.
四、成果自評
研究內容與原計畫相符程度: 100%
達成預期目標情況: 100%
研究成果的學術或應用價值: 利用模擬退
火的全域最佳化特性求取影像中圖形
(直線、橢圓、雙曲線)的參數,對於影
像處理有實質的貢獻。
是否適合在學術期刊發表: 是
主要發現或其他有關價值: 可做一般性的
影像圖形偵測及應用於震測信號的處
理與解釋上。
五、參考文獻
[1] S. Kirkpatrick, C. D. Gelatt, and M. P.
Vecchi, “Optimization by simulated
annealing,” Science, vol. 220, pp.
671-680, 1983.
[2] A. Corana, M. Marchesi, C. Martini, and
S. Ridella, “Minimizing multimodal
functions of continuous variables with
the simulated annealing algorithm,”
ACM Transactions on Mathematical
Software, vol. 13, pp. 262-280, 1987.
[3] Kou-Yuan Huang and Ying-Liang Chou,
“Synchronous and hierarchical seismic
pattern detection using simulated
annealing,” IEEE International
Geoscience and Remote Sensing
Symposium (IGARSS), Boston,
Massachusetts, pp.II-899-902, July 7-11,
2008.
[4] Kou-Yuan Huang and Kai-Ju Chen,
“Simulated annealing for pattern
detection and seismic applications,”
Journal of Information Science and
Engineering, Vol. 25, No. 3, pp.793-805,
May 2009.
行政院國家科學委員會補助國內專家學者出席國際學術會議報告
97 年 11 月 24 日
附
件
三
報告人姓名
黃國源
服務機構
及職稱
交通大學資訊工程系 教授
時間
會議
地點
97 年 11 月 9 日至 11 月 13 日
美國 Nevada 州的 Las Vegas
本會核定
補助文號
計畫 NSC97-2221-E-009-149
會議
名稱
(中文) 2008 年第七十八屆探測地球物理師學會年會
(英文) 2008 SEG International Seventy-Eighth Annual Meeting
發表
論文
題目
(中文)退火過程於分支式的震測圖型之偵測
(英文) Simulated annealing for hierarchical seismic pattern
detection
報告內容應包括下列各項:
一、參加會議經過
<<報告書如下頁>>
二、與會心得
三、考察參觀活動(無是項活動者省略)
四、建議
五、攜回資料名稱及內容
六、其他
表 Y04
表 Y04
國立交通大學資訊工程系黃國源教授 出席 2008 年
第七十八屆探測地球物理師學會國際年會報告書
一、概況與參加會議經過
本人前往美國 Nevada 州的 Las Vegas 的Mandalay Bay Convention Center 參加 2008 年
第七十八屆探測地球物理師學會國際年會(Society of Exploration Geophysicists International
78th Annual Meeting,11 月 9 日至 13 日,2008)。大會主席為Ernie Suraki,大會副主席為Dan
Hollis, Technical Program Chairman 為Tracy Stark。這個會議的性質為全世界最高水準的探測
地球物理會議,這次會議有 8,100 人參加。
這次會議發表的論文總共有 685 篇,其中 Oral presentation papers 有 528 篇,66 個
sessions,包含 8 個 special sessions,Poster presentation papers 有 157 篇。星期四下午到星期五
全天還有 13 個 Workshops。
Oral presentation papers 的發表,分在 Mandalay Bay Convention Center 的十一個會議室
同時舉行,包含下列主題:
ACQ: Acquisition and Survey Design
ANI: Anisotropy
AVO: AVO
BG: Borehloe Geophsics
CH: Case Histories
EM: Electromagnetics (EM) Exploration
GM: Gravity and Magnetics
INT: Interpretation
MAZ: Multiazimuth Technology
MC: Multicomponent
MIN: Mining and Geothermal
NSE: Near Surface and Environmental
PSC: Passive Seismic and Crosswell
RC: Rservoir Characterizstion
RP: Rock Properties
SI: Seismic Inversion
SM: Seismic Modeling
SPMI: Seismic Processing: Migration
SPMUL: Seismic Processing: Multiples
SPNA:Seismic Processing: Noise Attenuation
SS: Special Session
表 Y04
SVIP: Seismic Velocity Interpretation and Processing
TL: Time Lapse
TOM: Tomography
VSP: VSP
本人論文發表的 session 為 INT 2: Attributes, Workflows, and Visualization, 發表的時間為:
11/12, Wednesday, 3:10-3:35 PM,發表的題目為: Simulated annealing for hierarchical seismic
pattern detection。Session Chairmen 為 Dave Hale and Jesse M. Lomask, Room: Lagoon H.
除了論文發表外,有超過 300 家來自全世界最大的地球物理探測公司、石油公司、電腦
軟硬體公司、與科技廠商,作成果展覽及新科技推銷的工作,甚至還有來自全世界在地球物
理探測有名的大學,作研究成果展覽。
二、與會心得
本人參加的 Sessions 均與 Image vision, Neural networks, and Optimization methods 用於
Geophysics 有關,此一領域已經受到相當的重視,茲將有關的 Papers 搜尋列出如下:
Stochastic geocellular model of tidal sands in South Tapti gas field using field mapping,
satellite image, seismic mapping and well-log data, Western India
Subhadeep Chowdhury*, BG-Group, Reading, United Kingdom, Sourav Saha, BG Exploration and
Production
India Limited, India, and Stuart Burley, BG Trinidad and Tobago, Port of Spain.
Seismic attributes used for reservoir simulation: application to a heavy oil reservoir in
Canada
Carmen C. Dumitrescu* (Sensor Geophysical Ltd) & Larry Lines (CHORUS, University of
Calgary)
Simulated annealing for hierarchical seismic pattern detection
Kou-Yuan Huang* and Ying-Liang Chou, National Chiao Tung University
Wavelet estimation using a Very Fast Simulated Annealing and spline based parameterization
Abhijit Gangopadhyay*, BP America, and Long Jin, Institute for Geophysics, University of Texas at
Austin
A knowledge-based approach of seismic interpretation : horizon and dip-fault detection by
means of cognitive vision.
Philippe Verney*, IFP/ENSMP, Jean-François Rainaud, Institut Français du Pétrole, Michel Perrin,
École des
表 Y04
Mines de Paris, Monique Thonnat, INRIA Sophia-Antipolis
First Arrival Stochastic Tomography: Automatic Background Velocity Estimation Using Beam
Semblances and VFSA
Chaoshun Hu*, Paul Stoffa and Kirk McIntosh, Jackson School of Geosciences, University of Texas,
Austin
Global multiwell wavelet estimation
Alex Malkin* and Anat Canning, Paradigm
Inversion Using Bayesian Hyper-Prior Formulation for Sharp Boundaries
Partha Routh1, Mrinal Sen2, Dan Whitmore1and Phil Anno1
1Seismic Technology Development, ConocoPhillips, Houston, TX, USA
2Dept. of Geological Sciences, University of Texas at Austin, TX, USA
出席此次會議與學者專家交換研究心得,機會相當難得,而且當場的討論效果相當良好。
增廣見聞,獲益良多。
三、建議
請國科會能提高計畫內的參加第一流的國際學術會議之經費補助。
四、攜回資料名稱及內容
攜回資料為此次會議論文集的 CD 片,名稱為“2008 Technical Program Expanded Abstracts
with Authors’ Biographies," 內容有目錄、各篇論文、及作者的簡介。
五、其他
感謝國科會給予研究人員參加國際學術性會議之補助,才能參加第一流的、最重要的、
最具有代表性的國際會議。
大會指定的旅館,高級價錢一天要 US$330,中級價錢一天要 US$240,生活費用很高。
此次飛機票買的是最便宜的優惠價。
Simulated annealing for hierarchical seismic pattern detection
Kou-Yuan Huang* and Ying-Liang Chou, National Chiao Tung University
Summary
A Hierarchical system is proposed by using simulated annealing to detect hyperbola in image. The hierarchical detection procedures are patterns by patterns. The equation of hyperbola is defined under translation and rotation. The distance from all points to all patterns is defined as the error. Also we use the minimum error to determine the number of patterns. The proposed simulated annealing parameter detection system can search a set of parameter vectors for the global minimal error. In the seismic experiments, the hierarchical system can well detect line of direct wave and hyperbola of reflection wave in the simulated one-shot seismogram and the real seismic data. The results of seismic pattern detection can improve seismic interpretation and further seismic data processing.
Introduction
Usually Hough transform (HT) was used to detect patterns in image. But it needed huge calculation and consumed the memory.
A seismogram consists of line pattern of direct wave and hyperbolic pattern of reflection wave. In 1985, Huang et al. had applied HT to detect line pattern of direct wave and hyperbolic pattern of reflection wave. However, the determination of the parameters of the shape was not easy and memory requirement was also a problem.
In 2002, Jayanta et al. proposed Hough transform neural network (HTNN) to detect lines, circles, and ellipses, but it did not detect hyperbolas. In 2006, Huang et al. adopted HTNN to detect lines of direct wave and hyperbola of reflection wave in a one-shot seismogram. But gradient descent method had local minimum problem.
In 1983, Kirkpatrick et al. proposed the simulated annealing (SA). It is a global optimization algorithm. The key of the algorithm to reach the global minimum is in conditionally accepted higher-energy states by Metropolis criterion. In 2007, Chen and Huang adopted the SA to detect the parameters of lines, ellipses, and hyperbolas. But it is time-consuming to detect patterns.
Here, we propose a hierarchical detection system to detect the line pattern of direct wave and hyperbola pattern of reflection wave in the one-shot seismogram and real seismic data.
Hierarchical seismic pattern detection system
Hierarchical seismic pattern detection system consists of three main parts: 1. definition of system error (energy, distance); 2. SA algorithm for determination of the parameter vectors with minimum error; 3. removing the detected patterns.
Parametric patterns
We use a general equation based on the translation and rotation of the standard type of hyperbola.
2 2 [( ) cos ( ) sin ] [ ( ) sin ( ) cos ] x y x y a x m y m b x m y m f
θ
θ
θ
θ
− + − + − − + − = (1)If (a > 0, b < 0, and f ≠ 0) or (a < 0, b > 0, and f ≠ 0), the graph is a hyperbola. When (a > 0, b < 0, and f = 0) or (a < 0, b > 0, and f = 0), the graph is the asymptotes of the hyperbola. They are two crossing lines, so we can use (1) to represent lines. Because the line pattern of direct wave and the hyperbolic pattern of reflection wave are always north-south opening in a one-shot seismogram, so we set (a < 0 and b > 0) to detect seismic patterns.
In vector form, a parameter vector p = [mx, my, a, b, θ, f]T
represents a pattern. For kth pattern pk = [mk,x, mk,y, ak, bk, θk, fk]T. And for all K patterns, the matrix P = [p1, p2, …,
pK] represents all K patterns. We set f as nonnegative number.
System error
For the error or energy of the system, we first calculate the distance from a point to a pattern. The distance from a point
xi = [xi, yi]T to the kth pattern is defined as
| ] cos ) ( sin ) ( [ ] sin ) ( cos ) [( | ) ( 2 , , 2 , , k k y k i k x k i k k y k i k x k i k i k f m y m x b m y m x a d − − + − − + − + − = θ θ θ θ x (2)
The parameter of a, b, f can not be equal to zeros at the same time. Also, the distance from a point to the pattern is affected by the scale of coefficients. So we have to normalize the parameter a and b by | ab so that the new | |ab| = 1.
Then, we calculate the error from a point to K patterns that is the minimal distance from the point to all patterns. Error or distance from a point to all K patterns is defined as the minimal distance from the point to all patterns. The error or energy of the ith point xi is
869
SEG Las Vegas 2008 Annual Meeting Main Menu
(
1 2)
( ) min ( ), ( ), , ( ), , ( )i i i i k i K i
E x = d x d x K d x K d x (3)
where K is the total number of patterns.
Finally, the system error or energy is the arithmetic mean of the errors of N points. We define the total error or energy of the system from N input points to K patterns. The error or energy of the system is defined as the average of the errors of points, 1 1 N ( ) i i i E E N = =
∑
x (4)Simulated annealing for parameter detection
We use SA to detect the parameter vector of each seismic pattern. The goal is to find a set of parameter vectors that can globally minimize the error of the system. Using the temperature decreasing function T(t).
T(t) = Tmax ×Tα(t-1) for t = 1, 2, 3, … 0 < Tα< 1 (5)
Adjusting all parameters at one time is not efficient in convergence. We use four steps in adjusting parameters. The adjusting order is the center (mx, my), the shape
parameters a and b, the rotation angle θ, and the size f.
Algorithm: SA algorithm to detect parameter vectors of K
patterns including hyperbolas and lines as asymptotes.
Input: N points in an image. Set K as the number of
patterns.
Output: A set of detected K parameter vectors.
Step 1: Initialization.
In the initial step t = 1, choose Tmax as T(1) at high
temperature, and define the temperature decreasing function as in (5), T(t) = Tmax ×Tα(t-1).
Initialize parameter vectors of K patterns, p1, p2, ..., pk, …, pK, where pk = [mk,x, m k,y, ak, bk, θk, fk]T, one p is
for one pattern, and set P = [p1, p2, ..., pk, …, pK].
Calculate energy E(P) as (2), (3), and (4).
Step 2: Randomly change parameter vectors and decide the new parameter vectors in the same temperature or in one cooling cycle.
For m = 1 to Nt (Nt trials in a temperature)
For k = 1 to K (k is the index of the pattern)
Start a trial, including steps (a), (b), (c), and (d). The n
= [n1 n2]T is a 2×1 Gaussian random vector with N(0, 1),
n is a Gaussian random variable with N(0, 1), and αm,,
αab, αθ, αf is a constant.
(a) Randomly change the center of the kth pattern:
n m T y k x k T k,y x k m' m m m' ] =[ ] +α [ , , , (6)
Now, p’k = [m’k,x, m’k,y, ak, bk, θk, fk]T, and P’= [p1, p2, …, p’k,…, pK].
Calculate the new energy E(P’) from N points to K patterns. Using Metropolis criterion decides whether or not to accept P’. If the new energy is less than or equal to the original one, ∆E = E(P’) - E(P) ≤ 0, then accept
P’. Otherwise, the new energy is higher than the
original one, ∆E = E(P’) - E(P) > 0. In this case, compute prob = exp[-∆E/T(t)]. Generate a random number x uniformly distributed over (0, 1). If prob ≥ x, accept P’; otherwise, reject it, and keep previous P. (b) Randomly change the shape parameters:
n ab T k k T k kb a b a' ' ] =[ ] +α [ (7)
and normalize it by |a'kb'k|. Similar to Step 2(a), calculate the new energy E(P’) from N points to K patterns. Using Metropolis criterion decides whether or not to accept P’.
(c) Randomly change the angle:
n
k k
θ
α
θθ
' = + (8)Here, the angle is in degree. Similar to Step 2(a), calculate the new energy E(P’) from N points to K patterns. Using Metropolis criterion decides whether or not to accept P’.
(d) Randomly change the size:
| |
' f n
f k= k +
α
f (9)Similar to Step 2(a), calculate the new energy E(P’) from N points to K patterns. Using Metropolis criterion decides whether or not to accept P’.
End for k End for m
The concept of removing the detected patterns
In seismic pattern detection, instead of using pattern detection at one time, we use a hierarchy of pattern detection. The concept of the system is like hierarchical clustering algorithm. Fig. 4 illustrates an example of the hierarchical pattern detection of seismic patterns. We number each pattern in the image which consists of one line and three hyperbolas. At first, line 1 is detected and removed. Then hyperbola 2 and hyperbola 4 are detected and removed from the remaining data. Move on to detect the hyperbola 3 as Figure 1 shown. Eventually the patterns can be detected patterns by patterns in the hierarchical system.
Image patterns: line 1, hyperbola 2, hyperbola 3, hyperbola 4
Line1 Remaining data
Hyperbola 2 and hyperbola 4 Remaining data
Hyperbola 3
Figure 1: An example of hierarchical pattern recognition for seismic patterns.
870
SEG Las Vegas 2008 Annual Meeting Main Menu
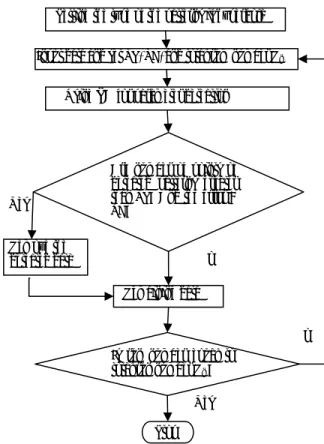
Hierarchical detection system
Figure 2 shows the flowchart of the hierarchical simulated annealing parameter detection system. First, we set a > 0, b < 0 to detect the hyperbolas. Second, input data and set threshold point (TP), threshold error (TE), and the run number (Rn), and then use simulated annealing to detect
parameters. The threshold point (TP) is defined as that the number of points N divided by the number of patterns K,
TP = N/K (10) If the detected patterns consist of points which are greater than TP and the error is less than TE, we remove the detected pattern. The remaining data will be used in the SA algorithm to detect the patterns. Until the run number equals to the total run number Rn, the detection system is
stopped.
Figure 2: Flowchart of the hierarchical simulated annealing parameter detection system.
Experimental results
Experiments on simulated one-shot seismogram
Figure 3 (a) shows the simulated one-shot seismogram. The simulated horizontal reflection layer is with the depth 500 m and the velocity of the p-wave in the sedimentary rock is
2,500 m/sec. There are 64 receiving stations on both side of explosion with 50 m between each other. The sampling interval is 0.004 sec. The wavelet is 25 Hz Ricker wavelet. Reflection coefficient is 0.2 and noise is band-passed noise, 10.2539Hz ~ 59.5703Hz, with uniform distributed over (-0.2, 0.2). The horizontal axis in Figure 3 is the trace number and the vertical axis is for time t. The one-shot seismogram is first preprocessed by envelope processing, thresholding with the threshold 0.15, and peak detection and shown in Figure 4 (a). The image size is 512 × 65. The points are then used as the input to the hierarchical detection system.
In the hierarchical parameter detection system, the initial parameter set mk,x = 33, mk,y = 0, ak = -1, bk = 1, and fk = 1.
The TP set 64, TE set 30, and Rn set 2. The cooling
function is as (5) with a temperature, Tmax = 60, and Tα =
0.9. There are Nt = 25 trials in a temperature. The
temperature decreases 200 times. Constants αm = 2, αab = 2,
and αf = 4. The detection result of Figure 4 (a) is shown in
Figure 4 (d).
No No
Yes
Setting the type of the patterns is hyperbola
Input data and set TP, TE, and total rum number Rn
Using SA for parameter detection
Are number of points of detected patterns greater than TP? And the error < TE?
Remove the detected data
Remaining data
Is run number equal to total run number Rn ?
Stop Yes
E
xperiments on real one-shot seismogram
The hierarchical system is applied to detect direct wave and reflection wave in real seismic data. We obtain seismic data from Seismic Unix System. The real data in Figure 3 (b) is at Canadian Artic, which has 48 traces and 3,100 samples per trace with sampling interval 0.002 seconds.
After preprocessing, we only choose points with t < 1.4 seconds, which include points from direct wave, first layer reflection wave, and second layer reflection wave as in Figure 5 (a), where there are 88 points.
Using the hierarchical detection system and setting of the initial parameter mk,x is random between 0 and 50, mk,y is
random between 0 and 3100 , ak = -1, bk = 1, fk = 1, αm = 8,
αab = 2, αf = 4, Tα= 0.9, Tmax = 60, Nt = 25, TP = 30, TE =
30, and cooling cycle 200 times, the detection result is shown in Figure 5 (b).
(a) (b)
Figure 3: (a) Simulated one-shot seismogram (horizontal reflection layer). (b) Real seismic data at Canadian Artic.
871
SEG Las Vegas 2008 Annual Meeting Main Menu
(a) (b)
(c) (d)
Figure 4: Detection results of seismic patterns. (a) After preprocessing of Figure 3 (a). (b) First detection result by hierarchical system. (c) The remaining data after first detection. (d) Final detection result by hierarchical system.
(a) (b)
Figure 5: (a) After preprocessing of Figure 3 (b), choose peaks with t < 1.4 seconds. (b) Final detection result by hierarchical system.
Determination of the number of patterns
How to determine the number of patterns is an important topic on pattern recognition. Here we use minimum error to determine the number of patterns in the seismic image. We use detection from pattern number K=1, 2, …, then we find that the detection error with the corresponding pattern number has a minimum or no improvement. At that time, the best choice of pattern number is determined.
We want to determine the pattern numbers of the simulated one-shot seismogram which is shown in Figure 3 (a). Figure 6 (a)-(c) show the results of getting K by hierarchical detection. The initial parameter mk,x and mk,y
are random between 0 and 64, ak = -1, bk = 1, θk= 0, fk =
1000, TP = 64, TE = 50, Rn = 4, αm = 2, αab = 2, αf = 8, Tα=
0.85, Tmax = 10, Nt = 25, and cooling cycle 100 times. In
Figure 6 (d), the detection error greatly decreases and reaches minimum when K = 2. So we choose K = 2. Table 1 lists the detection error in Figure 6 (a)-(c).
(a) (b)
(c) (d)
Figure 6: Determination of the pattern number K of Figure 3 (a). (a) K=1. (b) K=2. (c) K=3. (d) Detection error of (a), (b), (c).
Table 1: Detection error in Figure 6 (d).
K 1 2 3
Error 532.437 34.226 183.435
Conclusions
We have proposed a hierarchical system using simulated annealing for the detection of lines and hyperbolas, sequentially patterns by patterns. The simulated annealing has the capability of searching a set of parameter vectors with global minimal error. The general equation of hyperbolas in detection is from translation and rotation of standard equation. We have defined the distance from all points to all patterns.
Experimental results of hierarchical system to detect the line pattern of direct wave and the hyperbolic pattern of reflection wave in one-shot seismogram and the real seismic data are good. It is necessary to test the parameter values for the convergence of SA and the quality of the final result.
In seismic applications, we have no constraints on the center. However, for ideal case, the hyperbola has the center on x-axis, i.e. t = 0. In simulated seismic data, we can find that the center does not lie on the x-axis, because wavelet produces a shift. So preprocessing is quite critical. Wavelet and deconvolution processing may be needed in the preprocessing to improve the detection result.
Acknowledgments
The authors wish to thank the use of seismic data in Seismic Unix System developed by the Colorado School of Mine. This work was supported in part by the National Science Council, Taiwan, under NSC 96-2221-E-009-221.
872
SEG Las Vegas 2008 Annual Meeting Main Menu
EDITED REFERENCES
Note: This reference list is a copy-edited version of the reference list submitted by the author. Reference lists for the 2008 SEG Technical Program Expanded Abstracts have been copy edited so that references provided with the online metadata for each paper will achieve a high degree of linking to cited sources that appear on the Web.
REFERENCES
Basak, J., and A. Das, 2002, Hough transform networks: Learning conoidal structures in a connectionist framework: IEEE Transactions on Neural Networks, 13, 381–392.
Chen, K. J., and K. Y. Huang, 2007, Simulated annealing for pattern detection and seismic applications: International Joint Conference on Neural Networks, 477–482.
Dobrin, M. B., and C. H. Savit, 1988, Introduction to geophysical prospecting: McGraw-Hill. Hough, P. V. C., 1962, Method and means for recognizing complex patterns: U. S. Patent 3 069 654.
Huang, K. Y., K. S. Fu, T. H. Sheen, and S. W. Cheng, 1985, Image processing of seismograms: (A) Hough transformation for the detection of seismic patterns; (B) Thinning processing in the seismogram: Pattern Recognition, 18, 429–440. Huang, K. Y., J. D. You, K. J. Chen, H. L. Lai, and A. J. Don, 2006, Hough transform neural network for seismic pattern
detection: International Joint Conference on Neural Networks, 4670–4675.
Kirkpatrick, S., C. D. Gelatt, and M. P. Vecchi, 1983, Optimization by simulated annealing: Science, 220, 671–680.
Metropolis, N., A. Rosenbluth, M. Rosenbluth, A. Teller, and E. Teller, 1953, Equation of state calculations by fast computing machines: Journal of Chemistry and Physics, 1087–1092.
Slotnick, M. M., 1959, Lessons in seismic computing: SEG.
Theodoridis, S., and K. Koutroumbas, 2006, Pattern recognition: Elsevier. Yilmaz, O., 1987, Seismic data processing: SEG.
873
SEG Las Vegas 2008 Annual Meeting Main Menu