Association between nitrogen dioxide and heart rate
variability in a susceptible population
Chang-Chuan Chan
a, Kai-Jen Chuang
a, Ta-Chen Su
a,band Lian-Yu Lin
ba
Institute of Occupational Medicine and Industrial Hygiene, College of Public Health, National Taiwan
University, Taipei and
bDepartment of Internal Medicine (Cardiology Section), National Taiwan University
Hospital, Taipei, Taiwan.
Received8 December 2004 Accepted 23 August 2005
Background Panel studies have shown a consistent association between changes in the cardiac autonomic nervous system with particulate matters (PM) but less with gaseous pollutants. This study examined the linkage between nitrogen dioxide (NO2) and heart rate variability (HRV) in a susceptible population.
Methods We recruited a panel of 83 patients from the National Taiwan University Hospital Cardiology Clinic to measure their 24-h HRV by ambulatory electrocardiography. Thirty-nine patients had coronary heart disease (CHD) and another 44 patients had more than one major CHD risk factor. Ambient concentrations of NO2, sulphur dioxide (SO2), carbon monoxide (CO), ozone, and PM less than 10 lm in diameter (PM10) at each participant’s close-by monitoring station were used to represent study participants’ exposures. We used linear mixed-effects models to analyse the association between individual air pollutants and log10-transformed HRV, with key personal and environmental attributes and co-pollutants being adjusted.
Results We found that an increase in 10 ppb NO2at 4-h to 8-h moving averages was associated with 1.5–2.4% decreases in the standard deviation of all normal-to-normal intervals (SDNN) in our participants. For every 10 ppb NO2at 5 and 7-h moving averages, our participants’ low frequency was decreased by 2.2 and 2.5%, respectively. In contrast, HRV was not associated with PM10, CO, SO2, or O3.
Conclusion Increasing NO2exposure was found to be associated with decreasing SDNN and low frequency in susceptible populations. Eur J Cardiovasc Prev Rehabil 12:580–586 c 2005 The European Society of Cardiology
European Journal of Cardiovascular Prevention and Rehabilitation2005, 12:580–586
Keywords: air pollution, autonomic nervous system, epidemiology, heart rate variability, nitrogen dioxide
Sponsorship: The authors would like to thank the Taiwan Environmental Protection Agency for supporting this study with grants (EPA-90-FA11-03-A232 and EPA-91-FA11-03-D036).
Introduction
The linkage between exposure to particulate air pollution and increased cardiovascular symptoms and mortality has been shown in epidemiological studies [1–3]. Several panel studies on particulate matter (PM) and heart rate variability (HRV) in susceptible human individuals have demonstrated that autonomic imbalance was a possible mechanism of PM-induced cardiovascular effects. In-creased mass concentrations of PM less than 10 mm in diameter (PM10) and PM less than 2.5 mm in diameter
(PM2.5) were associated with a decreased standard
deviation of all normal-to-normal intervals (SDNN), square root of the mean of the sum of the squares of differences between adjacent normal-to-normal intervals (r-MSSD) in the elderly with coronary heart disease (CHD) or CHD risk factors, such as hypertension and diabetes mellitus [4–7]. Increased PM2.5mass
concentra-tions were also related to the decrease in low frequency (LF; 0.04–0.15 Hz) and high frequency (HF; 0.15– 0.40 Hz) in the elderly [8,9]. One recent study also found that increased PM less than 1 mm in diameter (PM1.0) number concentrations were related to decreased
SDNN, r-MSSD, LF and HF in the elderly and young subjects [10]. The time course of PM effects on HRV
Correspondence and requests for reprints to Chang-Chuan Chan, Institute of Occupational Medicine and Industrial Hygiene, College of Public Health, National Taiwan University, Room 1447, 1st Sec., No.1 Jen-ai Road, Taipei 100, Taiwan. Tel/fax: + 886 2 2322-2362; e-mail: [email protected]
occurred between 1 and 8 h with most significant effects at 3–4 h after exposure.
By contrast, relatively few studies explored the effects of gaseous air pollutants on cardiovascular diseases. Previous studies showed that respiratory effects were associated with indoor [11] and outdoor [12] nitrogen dioxide (NO2) exposure in children. In our studies, we also found
that acute exposure to NO2was associated with increases
in schoolchildren’s illness absence and susceptible population’s clinic visits for lower respiratory tract illness [13,14]. One epidemiological study recently reported that clinic visits for cardiovascular disease were associated with NO2, carbon monoxide (CO), PM2.5, organic carbon,
elemental carbon, and oxygenated hydrocarbons [15]. Another epidemiological study examined the relationship between air pollution and the incidence of cardiac arrhythmia among 100 cardiac patients with implanted defibrillators. Particles, ozone, CO, sulphur dioxide (SO2), and NO2were studied, but only NO2 at lagged
1-day or 5-day moving average was associated with arrhythmia [16].
These findings led us to speculate that NO2may display
similar effects on susceptible populations’ HRV as did PM. Therefore, we designed this panel study to investigate whether exposure to NO2 is associated with
HRV of patients with cardiovascular disease or patients with risk factors for cardiovascular disease.
Methods
Participants
We recruited 83 patients aged 40–75 years from the cardiology section, Department of Internal Medicine, National Taiwan University Hospital, as our participants and conducted our panel study between 12 December 2001 and 21 February 2002. These participants included 39 patients with CHD and another 44 patients with more than one major CHD risk factor. Our 39 CHD patients included those who had history of angina pectoris or acute myocardial infarction, and had had cardiac catheterized and percutaneous transluminal coronary angioplasty during the past year, but excluded those who had been hospitalized or had thrombolytic therapy during the past 3 months before the study period. The 44 patients with CHD risk factors were those who had no angina pectoris symptoms and negative treadmill exercise tests, but had hypertension, hypercholesterolemia or diabetes mellitus. A total of 205 patients met our selection criteria, but only 83 agreed to participate in our study after we explained the monitoring protocols (response rate 40%). These 83 patients are all residents in Taipei metropolitan areas. The ethics committee of the National Taiwan University Hospital approved this study. An informed consent was obtained from each participant before the study started.
Continuous Holter monitoring and tape processing We performed continuous ambulatory electrocardio-graphic (ECG) monitoring on each participant by using a three-channel ambulatory ECG recorder (PacerCorder, model 461A; Del Mar Medical Systems, LLC, Irvine, California, USA) with a sampling rate of 250 Hz (4 ms). We sent ECG tapes to National Taiwan University Hospital and used the Delmar 563 Holter analysis system (version 2.47; Del Mar Medical Systems) to do the analysis. The electrocardiographic wave complex (QRS) was automatically classified and manually verified as normal sinus rhythm, arterial or ventricular premature beats, or noise by comparison of the adjacent electro-cardiographic wave complex morphological features. The normal-to-normal (N–N) intervals were deduced from the adjacent normal sinus beats. The N–N interval time series were then transferred to a personal computer and post-processed by a program written in Matlab language (version 5.2; MathWork Inc., Natick, Massachusetts, USA). The missing intervals of the raw N–N data were linearly interpolated and resampled at 4 Hz by the Ron Berger method [17]. Each 5-min segment of N–N intervals was taken for HRV analysis. The time-domain measurements of HRV were SDNN, and r-MSSD. The frequency-domain measurements of HRV included LF and HF, which were calculated using Welch’s averaged periodogram of the N–N intervals [18,19]. In order to avoid sleep effects on HRV, we used 16-h daytime Holter measurements when the participants were awake be-tween 0700 and 2300 h.
Environmental data
Concentrations of NO2, CO, SO2, ozone and PM10
measured by 12 fixed-site monitoring stations in Taipei metropolitan areas were used to represent our partici-pants’ exposures to air pollutants. These 12 air-monitor-ing stations, which were operated by Taiwan Environmental Protection Agency, were all located approximately 200–400 m away from main traffic roads in the school campus. The major sources of air pollution in Taipei, which is a metropolitan area without industries, are emissions from motorcycles, cars and buses. Each participant can be assigned to one fixed-site monitoring that is within 1 km of his or her residence. Hourly data on air pollution levels and temperature in each monitoring station during each participant’s electrocardiogram mon-itoring period were obtained to represent personal exposure data.
Key personal attributes
Each participant’s age, sex, body mass index, smoking status, and medical history were collected by a questionnaire. Each patient’s current health status, including hypertension, diabetes mellitus and hyperchol-esterolemia was obtained from medical charts and examination. Professionally trained nurses performed blood pressure measurements for each patient with a
mercury sphygmomanometer. Participants with systolic blood pressure higher than 140 mmHg or diastolic blood pressure higher than 90 mmHg, or participants receiving antihypertension agents were considered to be hyperten-sive. Participants with fasting serum glucose levels of 6.99 mmol/l or greater in at least two different measure-ments or who had a history of taking the medicine were considered to be patients with diabetes. The US National Cholesterol Education Program – Adult Treatment Panel II guideline (NCEP-ATP II 1994) was adopted to define hypercholesterolemia to be low-density lipoprotein (LDL) cholesterol of 130 mg/dl or greater among CHD patients and LDL-cholesterol of 160 mg/dl among non-CHD patients.
Statistical analysis
We first plotted each participant’s HRV indices against individual air pollutants to diagnose whether a consistent pattern existed between these two variables across all 83 participants, and whether some participants with extreme values biased such a pattern. We also used stepwise multiple regressions without air pollutants to determine key HRV-related personal covariates with a P value lower than 0.15 for further analyses. We then applied linear mixed-effects regression models, performed by S-PLUS 2000 general additive procedures (MathSoft Inc., Cam-bridge, Massachusetts, USA), to analyse the association between air pollutants and various HRV indices by adjusting key personal and environmental attributes. Such mixed-effects models had the advantage of adjust-ing for invariant variables in fixed-effects models and accounting for individual differences in random-effects models. We treated participants’ sex, age, body mass index, health status (CHD versus non-CHD), smoking status (current versus never), medication use, and the hour of day as time invariant variables, whereas air pollutants, temperature and HRV were treated as time varying variables in our data analysis. Previous studies have shown that HRV reduction is associated with air pollution exposure in the preceding hours [4,10,20], we therefore evaluated the time course of pollution effects for 1–8 h after exposure. The time delay between clinical and environmental measurements was achieved by calculating moving averages of air pollution levels in 1– 8 h before each 5-min HRV measurement. The log10
-transformed HRV indices, which were min SDNN, 5-min r-MSSD, 5-5-min LF and 5-5-min HF were then regressed on these moving averages. In the mixed-effects models, we treated participants’ sex, age, body mass index, health status, smoking status, hour-of-day, 1–8 h moving averages of air pollutants, and ambient tempera-ture as fixed effects and each participant as a random effect. Model selection was based on the criteria of minimizing Akaike’s Information Criterion. Our mixed-effects models were applied separately to analyse all 83 participants as a whole and the diabetes mellitus participants as a subgroup.
Results
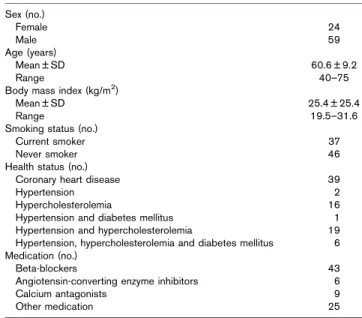
As shown in Table 1, there were 59 men and 24 women in our 83 study participants aged 40–75 years and the body mass index ranged from 19.5 to 31.6 kg/m2. Among our study population, there were 39 patients with CHD, two patients with hypertension, 16 patients with hypercho-lesterolemia, one patient with hypertension and diabetes mellitus, 19 patients with hypertension and hypercholes-terolemia, and six patients with hypertension, hyperch-olesterolemia and diabetes mellitus. Our participants’ medication during the study period was 43 patients on beta-blockers, six patients on angiotensin-converting enzyme inhibitors, nine patients on calcium antagonists, and another 25 patients on other medication.
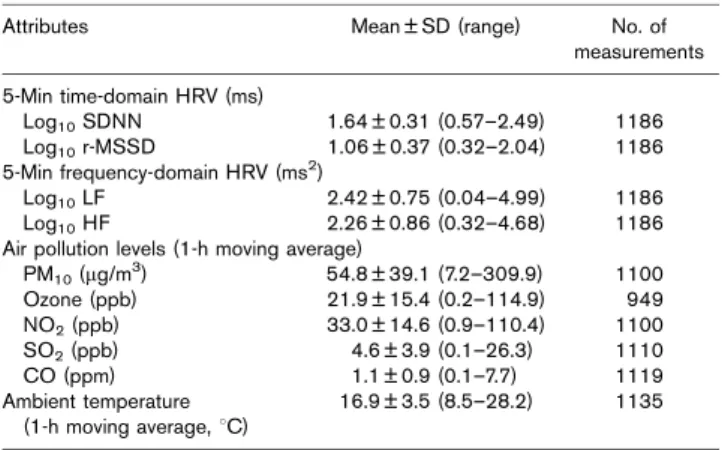
As shown in Table 2, the means (SD) of our participants’ log10 HRV indices were 1.64 ms (0.31), 1.06 ms (0.37),
2.42 ms2(0.75), and 2.26 ms2(0.86) for SDNN, r-MSSD, LF, and HF, respectively. Table 2 also summarized the means (SD) of air pollution levels and meteorological conditions, which were 33.0 ppb (14.6), 1.1 ppm (0.9), 4.6 ppb (3.9), 21.9 ppb (15.4), 54.8 mg/m3 (39.1), and 16.91C (3.5) for NO2, CO, SO2, ozone, PM10, and
temperature, respectively, during our study period. In our air pollution data, NO2 was strongly correlated with CO
(r = 0.7) but moderately correlated with PM10 (r = 0.4),
SO2(r = 0.5), and ozone (r = – 0.4).
The diagrams of HRV versus air pollution indicated a consistently negative trend between all four HRV indices and four individual air pollutants, such as NO2, PM10,
CO, and SO2 across all 83 participants (not shown). A
total of 160 single-pollutant models were constructed separately to estimate the effects of five air pollutants on HRV at 1-h to 8-h moving averages in this study. Table 3
Table 1 Summary of 83 participants’ basic characteristics, health status, and medication in our panel study
Sex (no.) Female 24 Male 59 Age (years) Mean ± SD 60.6 ± 9.2 Range 40–75
Body mass index (kg/m2)
Mean ± SD 25.4 ± 25.4
Range 19.5–31.6
Smoking status (no.)
Current smoker 37
Never smoker 46
Health status (no.)
Coronary heart disease 39
Hypertension 2
Hypercholesterolemia 16
Hypertension and diabetes mellitus 1 Hypertension and hypercholesterolemia 19 Hypertension, hypercholesterolemia and diabetes mellitus 6 Medication (no.)
Beta-blockers 43
Angiotensin-converting enzyme inhibitors 6
Calcium antagonists 9
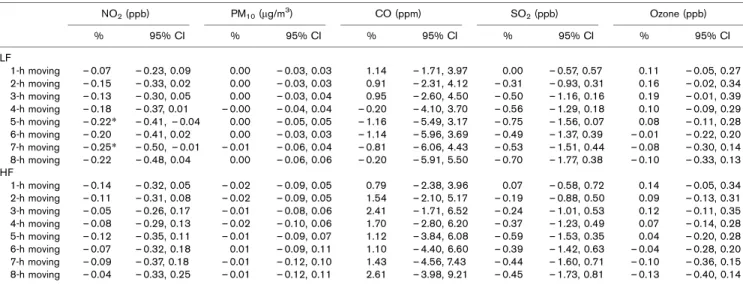
and 4 are estimated percentage changes of time-domain and frequency-domain HRV indices for air pollutant exposures at 1-h to 8-h moving averages by using single-pollutant mixed-effects models. The modeling results showed that NO2 was associated with decreases of
SDNN at 4-h to 8-h moving averages, and LF at 5-h and 7-h moving averages. The observed negative trend between NO2 and r-MSSD and HF was, however, not
significantly associated. Our single-pollutant models showed no significant association for the observed negative trends between time-domain and frequency-domain HRV indices and either PM10, CO, or SO2. The
single-pollutant models further confirmed that no asso-ciation existed between HRV indices and CO. For the
seven participants with diabetes mellitus, we found that no air pollutants were significantly associated with HRV reduction, although all HRV indices consistently showed a negative correlation with NO2and CO.
We performed another 32 multi-pollutant models with PM10, NO2, and the interaction between PM10and NO2in
our models in order to estimate the partial effects of NO2
on HRV adjusted for PM10 and other key personal and
environmental attributes. Our multi-pollutant models found that only NO2had negative effects on SDNN and
LF after adjusting PM10 and other key personal and
environmental attributes. As shown in Fig. 1, SDNN decreased by 1.4–2.5% for every 10 ppb increase in 4-h to 8-h NO2moving averages. The LF decreased by 2.2% at
5-h moving averages and decreased by 2.4% at 7-5-h moving average per 10 ppb NO2exposure. In contrast, PM10 did
not associate with any HRV indices in our multiple-pollutant models. Personal characteristics such as sex, age, body mass index, health status, medication use, and smoking status did not affect the relationship between NO2 and time-domain and frequency-domain HRV
indices. It should be noted that ambient temperature was negatively associated with these indices. We only examined the time course of air pollutant exposures up to 8-h moving averages because available HRV data were substantially reduced for moving averages greater than 8 h.
Discussion
This is the first study to demonstrate that environmental exposure to NO2 is associated with reducing HRV in
human subjects. The main effect of NO2 on reducing
HRV occurs at 4-h to 8-h moving averages for SDNN and 5-h and 7-h moving averages for LF. Our previous study reported that all HRV indices, namely, SDNN, r-MSSD,
Table 2 Summary of heart rate variability, air pollution levels, and ambient temperature for 83 participants during the panel study period
Attributes Mean ± SD (range) No. of measurements 5-Min time-domain HRV (ms) Log10SDNN 1.64 ± 0.31 (0.57–2.49) 1186 Log10r-MSSD 1.06 ± 0.37 (0.32–2.04) 1186 5-Min frequency-domain HRV (ms2) Log10LF 2.42 ± 0.75 (0.04–4.99) 1186 Log10HF 2.26 ± 0.86 (0.32–4.68) 1186 Air pollution levels (1-h moving average)
PM10(mg/m3) 54.8 ± 39.1 (7.2–309.9) 1100 Ozone (ppb) 21.9 ± 15.4 (0.2–114.9) 949 NO2(ppb) 33.0 ± 14.6 (0.9–110.4) 1100 SO2(ppb) 4.6 ± 3.9 (0.1–26.3) 1110 CO (ppm) 1.1 ± 0.9 (0.1–7.7) 1119 Ambient temperature (1-h moving average, 1C) 16.9 ± 3.5 (8.5–28.2) 1135
CO, Carbon monoxide; HF, high frequency; HRV, heart rate variability; LF, low frequency; NO2, nitrogen dioxide; PM10, particulate matter less than 10 mm in diameter; r-MSSD, square root of the mean of the sum of the squares of differences between adjacent normal-to-normal intervals; SDNN, standard deviation of all normal-to-normal intervals; SO2, sulphur dioxide.
Table 3 Percentage changesaof time-domain heart rate variability per unit concentrations of air pollutants lagged 1–8 h among 83 participants NO2(ppb) PM10(mg/m3) CO (ppm) SO2(ppb) Ozone (ppb) % 95% CI % 95% CI % 95% CI % 95% CI % 95% CI SDNN 1-h moving – 0.09 – 0.20, 0.02 – 0.01 – 0.04, 0.02 – 0.37 – 2.14, 1.39 0.10 – 0.28, 0.48 0.04 – 0.07, 0.15 2-h moving – 0.10 – 0.21, 0.03 – 0.01 – 0.05, 0.03 0.05 – 1.98, 2.08 0.05 – 0.35, 0.44 0.04 – 0.08, 0.15 3-h moving – 0.10 – 0.22, 0.02 – 0.00 – 0.04, 0.04 0.00 – 2.20, 2.20 – 0.06 – 0.48, 0.37 0.05 – 0.08, 0.18 4-h moving – 0.15* – 0.27, – 0.01 – 0.01 – 0.05, 0.04 – 0.69 – 3.15 1.78 – 0.14 – 0.63, 0.35 0.09 – 0.03, 0.21 5-h moving – 0.17* – 0.31, – 0.03 – 0.02 – 0.07, 0.03 – 1.34 – 4.08, 1.41 – 0.29 – 0.82, 0.24 0.07 – 0.06, 0.22 6-h moving – 0.17* – 0.32, – 0.02 – 0.03 – 0.08, 0.02 – 1.75 – 4.81, 1.30 – 0.25 – 0.82, 0.32 0.05 – 0.09, 0.20 7-h moving – 0.24* – 0.40, – 0.08 – 0.04 – 0.11, 0.02 – 2.23 – 5.56, 1.12 – 0.44 – 1.07, 0.20 0.03 – 0.11, 0.18 8-h moving – 0.23* – 0.40, – 0.06 – 0.04 – 0.10, 0.02 – 1.98 – 5.60, 1.64 – 0.47 – 1.16, 0.22 0.01 – 0.15, 0.16 r-MSSD 1-h moving – 0.12 – 0.30, 0.06 0.00 – 0.05, 0.06 – 0.43 – 3.37, 2.50 0.10 – 0.53, 0.74 0.08 – 0.10, 0.27 2-h moving – 0.11 – 0.30, 0.09 0.00 – 0.07, 0.08 0.57 – 2.85, 3.99 – 0.07 – 0.75, 0.61 0.06 – 0.14, 0.26 3-h moving – 0.10 – 0.28, 0.07 0.00 – 0.06, 0.07 1.14 – 2.68, 4.97 – 0.10 – 0.84, 0.64 0.10 – 0.12, 0.32 4-h moving – 0.15 – 0.35, 0.05 – 0.00 – 0.09, 0.09 0.12 – 4.03, 4.27 – 0.23 – 1.04, 0.59 0.10 – 0.10, 0.30 5-h moving – 0.15 – 0.37, 0.06 – 0.00 – 0.08, 0.08 – 0.61 – 5.23, 2.00 – 0.36 – 1.25, 0.54 0.08 – 0.13, 0.30 6-h moving – 0.13 – 0.36, 0.11 – 0.03 – 0.12, 0.06 – 0.87 – 6.01, 4.27 – 0.19 – 1.16, 0.79 0.03 – 0.20, 0.26 7-h moving – 0.20 – 0.46, 0.06 – 0.05 – 0.15, 0.05 – 1.06 – 6.68, 4.55 – 0.40 – 1.50, 0.69 – 0.06 – 0.31, 0.18 8-h moving – 0.15 – 0.44, 0.13 – 0.06 – 0.16, 0.04 0.08 – 6.04, 6.20 – 0.29 – 1.50, 0.92 – 0.12 – 0.37, 0.13 aThe model was adjusted for sex, age, body mass index, health status, smoking status, medication use, indicator variables for hour of day, and ambient temperature. CI, confidence interval; CO, carbon monoxide; NO2, nitrogen dioxide; PM10, particulate matter less than 10 mm in diameter; r-MSSD, square root of the mean of the sum of the squares of differences between adjacent normal-to-normal intervals; SDNN, standard deviation of all normal-to-normal intervals; SO2, sulphur dioxide. *P < 0.05.
LF, and HF, were negatively associated with submicro-meter particle exposures in susceptible populations [10]. The comparisons between these two studies showed that NO2 induced a smaller extent of HRV changes than
submicrometer particles. Compared with previous studies on PM, our studies showed that NO2needed longer hours
to induce SDNN reduction than PM. The time courses of reducing SDNN were 1-h to 4-h moving averages of PM exposures in previous studies [4,10,20]. In contrast, NO2induced an SDNN decrease only after 4-h moving
averages in this study.
Findings of epidemiological, toxicological and controlled human exposure studies on NO2 show that pulmonary
inflammation is a possible mechanism to explain the observed associations between NO2 exposure and
auto-nomic imbalance in susceptible populations. Office work-ers’ fibrinogen concentrations were associated with ambient NO2 concentrations in London, UK [21].
Ambient NO2 concentrations were also associated with
an increase in platelet counts and fibrinogen among US adult populations [22]. An in-vitro study showed that the exposure of human bronchial epithelial cells to 0.4– 0.8 ppm NO2for 6 h was associated with the synthesis of
proinflammatory cytokines such as granulocyte–macro-phage colony-stimulating factor, IL-8, and TNF-a [23]. One controlled human exposure study also showed that participants were detected with neutrophilic inflammation in their airways at 6 h after exposure to 2 ppm NO2for 4 h
[24]. These findings support the theory that NO2-induced
pulmonary inflammation is one possible mechanism responsible for HRV decreases in susceptible populations. In contrast, we found no effects of PM10, ozone3, CO or
SO2on decreasing HRV in this study even though some
previous studies have reported that PM10 [4,5], ozone
Table 4 Percentage changesaof frequency-domain heart rate variability per unit concentrations of air pollutants lagged 1–8 h among 83
participants NO2(ppb) PM10(mg/m3) CO (ppm) SO2(ppb) Ozone (ppb) % 95% CI % 95% CI % 95% CI % 95% CI % 95% CI LF 1-h moving – 0.07 – 0.23, 0.09 0.00 – 0.03, 0.03 1.14 – 1.71, 3.97 0.00 – 0.57, 0.57 0.11 – 0.05, 0.27 2-h moving – 0.15 – 0.33, 0.02 0.00 – 0.03, 0.03 0.91 – 2.31, 4.12 – 0.31 – 0.93, 0.31 0.16 – 0.02, 0.34 3-h moving – 0.13 – 0.30, 0.05 0.00 – 0.03, 0.04 0.95 – 2.60, 4.50 – 0.50 – 1.16, 0.16 0.19 – 0.01, 0.39 4-h moving – 0.18 – 0.37, 0.01 – 0.00 – 0.04, 0.04 – 0.20 – 4.10, 3.70 – 0.56 – 1.29, 0.18 0.10 – 0.09, 0.29 5-h moving – 0.22* – 0.41, – 0.04 0.00 – 0.05, 0.05 – 1.16 – 5.49, 3.17 – 0.75 – 1.56, 0.07 0.08 – 0.11, 0.28 6-h moving – 0.20 – 0.41, 0.02 0.00 – 0.03, 0.03 – 1.14 – 5.96, 3.69 – 0.49 – 1.37, 0.39 – 0.01 – 0.22, 0.20 7-h moving – 0.25* – 0.50, – 0.01 – 0.01 – 0.06, 0.04 – 0.81 – 6.06, 4.43 – 0.53 – 1.51, 0.44 – 0.08 – 0.30, 0.14 8-h moving – 0.22 – 0.48, 0.04 0.00 – 0.06, 0.06 – 0.20 – 5.91, 5.50 – 0.70 – 1.77, 0.38 – 0.10 – 0.33, 0.13 HF 1-h moving – 0.14 – 0.32, 0.05 – 0.02 – 0.09, 0.05 0.79 – 2.38, 3.96 0.07 – 0.58, 0.72 0.14 – 0.05, 0.34 2-h moving – 0.11 – 0.31, 0.08 – 0.02 – 0.09, 0.05 1.54 – 2.10, 5.17 – 0.19 – 0.88, 0.50 0.09 – 0.13, 0.31 3-h moving – 0.05 – 0.26, 0.17 – 0.01 – 0.08, 0.06 2.41 – 1.71, 6.52 – 0.24 – 1.01, 0.53 0.12 – 0.11, 0.35 4-h moving – 0.08 – 0.29, 0.13 – 0.02 – 0.10, 0.06 1.70 – 2.80, 6.20 – 0.37 – 1.23, 0.49 0.07 – 0.14, 0.28 5-h moving – 0.12 – 0.35, 0.11 – 0.01 – 0.09, 0.07 1.12 – 3.84, 6.08 – 0.59 – 1.53, 0.35 0.04 – 0.20, 0.28 6-h moving – 0.07 – 0.32, 0.18 0.01 – 0.09, 0.11 1.10 – 4.40, 6.60 – 0.39 – 1.42, 0.63 – 0.04 – 0.28, 0.20 7-h moving – 0.09 – 0.37, 0.18 – 0.01 – 0.12, 0.10 1.43 – 4.56, 7.43 – 0.44 – 1.60, 0.71 – 0.10 – 0.36, 0.15 8-h moving – 0.04 – 0.33, 0.25 – 0.01 – 0.12, 0.11 2.61 – 3.98, 9.21 – 0.45 – 1.73, 0.81 – 0.13 – 0.40, 0.14 a
The model was adjusted for sex, age, body mass index, health status, smoking status, medication use, indicator variables for hour of day, and ambient temperature. CI, confidence interval; CO, carbon monoxide; HF, high frequency; LF, low frequency; NO2, nitrogen dioxide; PM10, particulate matter less than 10 mm in diameter; SO2, sulphur dioxide. *P < 0.05. Fig. 1 NO2 averaging time (h) (%) Change in SDNN (%) Change in SDNN −5 −4 −3 −2 −1 0 1 −1.0 −0.8 −0.6 −0.4 −0.2 0.0 0.2 0.4 0.6 PM10 averaging time (h) 1 0 2 3 4 5 6 7 8 1 0 2 3 4 5 6 7 8
Percentage changes in 5-min standard deviation of all normal-to-normal
intervals (SDNN) per 10 ppb nitrogen dioxide (NO2) and 10 mg/m
3
particulate matter less than 10 mm in diameter (PM10) estimated by
[4,8], CO [25], and SO2[26] were separately associated
with an HRV decrease in various populations. One possibility of this discovery was that it was caused by the different spatial representativeness of fixed-site air-monitoring stations for NO2and other air pollutants [27].
In that study, we correlated hourly concentrations of NO2, PM10, CO, SO2, and ozone measured at one
fixed-site air-monitoring station with those measured at six mobile monitoring stations surrounding the fixed-site air-monitoring station and found that NO2had the highest
correlation coefficients (r = 0.73). It is likely that NO2,
CO, SO2, and ozone measured at the air-monitoring
station may not properly represent our participants’ air pollution exposures. The true association between these four air pollutants and HRV, therefore, may be biased towards null in this study. Accordingly, our study cannot completely falsify these four air pollutants’ effects on decreasing HRV as reported in previous studies.
The following study limitation should be considered in the interpretation and extrapolation of our findings. First, the actual exposure–response relationship between NO2
exposure and HRV decrease may be overestimated in this study because we used environmental monitoring data to represent individual exposures rather than personal monitoring data. Our patients’ personal NO2 exposures
were expected to be higher than the NO2concentrations
measured in air-monitoring stations because their breath-ing zones were closer to the emission sources of NO2,
such as vehicles outdoors and gas stoves indoors, than the monitoring station’s sampling inlets [28]. Accordingly, the true exposure–response relationship between NO2
ex-posure and HRV decrease should be lower than the findings of this study. Second, there may be some unknown and unmeasured air pollutants either indoors or outdoors, such as fine particles and combustion gases emitted from vehicles and cooking stoves. It is known that fine particles and nitrogen oxides are usually formed and emitted from tail-pipes together because of high-temperature combustions through vehicles’ internal engines [29]. Third, other indoor air pollutants can also confound our results because our participants were expected to have their activities in indoor environments where indoor air pollution was not fully characterized in this study. Fourth, we cannot exclude the confounding effects of respiration on the association between NO2and
HRV because our participants’ physical activities and breathing patterns were not measured in the study [30]. Fifth, we believe that insufficient sample size is a possible reason why no air pollutants were found to be significantly associated with HRV reduction in the diabetes mellitus subgroup because we had only 168 HRV measurements for the seven patients with diabetes as outcomes in our mixed-effects models. Sixth, the between-participant variation in HRV, which is typically substantially larger than the within-participant variation, may not be fully controlled in our mixed-effects models
and may lead to risk underestimation even though we have adjusted for as many invariant factors as possible, which included sex, age, health status, medication use and smoking status. Finally, we cannot evaluate the confounding effect of our participants’ long-term expo-sure on our findings because we did not consider their accumulated exposure until the time of our clinical assessments in this study.
A decrease in HRV has been shown to be a predictor of increased mortality after a myocardial infarction [31] and has been related to sudden arrhythmic death [32]. Different autonomic influences on cardiovascular func-tion are reflected by different HRV indices. SDNN is a broad measure that reflects overall changes in autonomic tone. r-MSSD is correlated with HF, which has been used to estimate parasympathetic nervous systems and is linked to respiratory influences. LF is believed to represent mixed sympathetic and parasympathetic influ-ences [18]. As a significant HRV decrease by NO2was
seen in both SDNN and LF but not in r-MSSD or HF in this study, we hypothesized that the effects of NO2 on
HRV reduction may be related to both the sympathetic and parasympathetic nervous systems.
Despite these limitations, we believe our data generally support the fact that NO2can disturb autonomic function
in susceptible human individuals. Therefore, the inter-action between PM and NO2should be considered in the
study design in future studies on air pollution effects on HRV. Further studies are still needed in order to elucidate true biological mechanisms and the actual dose–response relationship for NO2 effects on HRV decrease in the
human population. Acknowledgements
The authors would like to thank the Taiwan Environ-mental Protection Agency for supporting this study.
References
1 de Hartog JJ, Hoek G, Peters A, Timonen KL, Ibald-Mulli A, Brunekreef B, et al. Effects of fine and ultrafine particles on cardiorespiratory symptoms in elderly subjects with coronary heart disease. Am J Epidemiol 2003; 157:613–623.
2 Pope CA III, Dockery DW. Epidemiology of particle effects. In: Holgate ST, Samet JM, Koren HS, Maynard RL, editors. Air pollution and health. London: Academic Press; 1999, pp. 673–705.
3 Samet JM, Dominici F, Curriero FC, Coursac I, Zeger SL. Fine particulate air pollution and mortality in 20 U.S. cities, 1987–1994. N Engl J Med 2000; 343:1742–1749.
4 Gold DR, Litonjua A, Schwartz J, Lovett E, Larson A, Nearing B, et al. Ambient pollution and heart rate variability. Circulation 2000; 101: 1267–1273.
5 Pope CA III, Verrier RL, Lovett EG, Larson AC, Raizenne ME, Kanner RE, et al. Heart rate variability associated with particulate air pollution. Am Heart J 1999; 138:890–899.
6 Creason J, Neas L, Walsh D, Williams R, Sheldon L, Liao D, et al. Particulate matter and heart rate variability among elderly retirees: the Baltimore 1998 PM study. J Expo Anal Environ Epidemiol 2001; 11:116–122.
7 Pope CA III, Hansen ML, Long RW, Nielsen KR, Eatough NL, Wilson WE, et al. Ambient particulate air pollution, heart rate variability, and blood
markers of inflammation in a panel of elderly subjects. Environ Health Perspect 2004; 112:339–345.
8 Holguin F, Tellez-Rojo MM, Hernandez M, Cortez M, Chow JC, Watson JG, et al. Air pollution and heart rate variability among the elderly in Mexico City. Epidemiology 2003; 14:521–527.
9 Liao D, Creason J, Shy C, Williams R, Watts R, Zweidinger R. Daily variation of particulate air pollution and poor cardiac autonomic control in the elderly. Environ Health Perspect 1999; 107:521–525.
10 Chan CC, Chuang KJ, Shiao GM, Lin LY. Personal exposure to
submicrometer particles and heart rate variability in human subjects. Environ Health Perspect 2004; 112:1063–1067.
11 Pilotto LS, Douglas RM, Attewell RG, Wilson SR. Respiratory effects associated with indoor nitrogen dioxide exposure in children. Int J Epidemiol 1997; 26:788–796.
12 Shima M, Adachi M. Effect of outdoor and indoor nitrogen dioxide on respiratory symptoms in schoolchildren. Int J Epidemiol 2000; 29:862–870. 13 Hwang JS, Chen YJ, Wang JD, Lai YM, Yang CY, Chan CC. Subject-domain
approach to the study of air pollution effects on schoolchildren’s illness absence. Am J Epidemiol 2000; 152:67–74.
14 Hwang JS, Chan CC. Effects of air pollution on daily clinic visits for lower respiratory tract illness. Am J Epidemiol 2002; 155:1–10.
15 Metzger KB, Tolbert PE, Klein M, Peel JL, Flanders WD, Todd K, et al. Ambient air pollution and cardiovascular emergency department visits. Epidemiology 2004; 15:46–56.
16 Peters A, Liu E, Verrier RL, Schwartz J, Gold DR, Mittleman M, et al. Air pollution and incidence of cardiac arrhythmia. Epidemiology 2000; 11:2–4. 17 Berger RD, Akselrod S, Gordon D, Cohen RJ. An efficient algorithm for
spectral analysis of heart rate variability. IEEE Trans Biomed Eng 1986; 33:900–904.
18 Task Force of the European Society of Cardiology and the North American Society of Pacing and Electrophysiology. Heart rate variability: standards of measurement, physiological interpretation, and clinical use. Circulation 1996; 93:1043–1065.
19 Welch PD. The use of fast Fourier transform for the estimation of power spectra: a method based on time averaging over short, modified periodograms. IEEE Trans Audio Electroacoust 1967; 15:70–77. 20 Magari SR, Hauser R, Schwartz J, Williams PL, Hauser R, Smith TJ, et al.
Association between personal measurements of environmental exposure to particulates and heart rate variability. Epidemiology 2002; 13:305–310.
21 Pekkanen J, Brunner EJ, Anderson HR, Tiittanen P, Atkinson RW. Daily concentrations of air pollution and plasma fibrinogen in London. Occup Environ Med 2000; 57:818–822.
22 Schwartz J. Air pollution and blood markers of cardiovascular risk. Environ Health Perspect 2001; 109 (Suppl. 3):405–409.
23 Devalia JL, Campbell AM, Sapsford RJ, Rusznak C, Quint D, Godard P, et al. Effect of nitrogen dioxide on synthesis of inflammatory cytokines expressed by human bronchial epithelial cells in vitro. Am J Respir Cell Mol Biol 1993; 9:271–278.
24 Blomberg A, Krishna MT, Bocchino V, Biscione GL, Shute JK, Kelly FJ, et al. The inflammatory effects of 2 ppm NO2on the airways of healthy subjects. Am J Respir Crit Care Med 1997; 156:418–424.
25 Tarkiainen TH, Timonen KL, Vanninen EJ, Alm S, Hartikainen JE, Pekkanen J. Effect of acute carbon monoxide exposure on heart rate variability in patients with coronary artery disease. Clin Physiol Funct Imaging 2003; 23:98–102.
26 Paula Santos U, Braga AL, Giorgi DM, Pereira LA, Grupi CJ, Lin CA, et al. Effects of air pollution on blood pressure and heart rate variability: a panel study of vehicular traffic controllers in the city of Sao Paulo, Brazil. Eur Heart J 2005; 26:193–200.
27 Chan CC, Hwang JS. Site representativeness of urban air monitoring stations. J Air Waste Manage Assoc 1996; 46:755–760.
28 Chan CC, Yanagisawa Y, Spengler JD. Personal and indoor/outdoor nitrogen dioxide exposure assessments of 23 homes in Taiwan. Toxicol Ind Health 1990; 6:173–182.
29 Gillies JA, Gertler AW, Sagebiel JC, Dippel WA. On-road particulate matter (PM2.5and PM10) emissions in the Sepulveda Tunnel, Los Angeles, California. Environ Sci Technol 2001; 35:1054–1063.
30 Yasuma F, Hayano J. Respiratory sinus arrhythmia: why does the heartbeat synchronize with respiratory rhythm? Chest 2004; 125:683–690. 31 La Rovere MT, Bigger JT Jr, Marcus FI, Mortara A, Schwartz PJ. Baroreflex
sensitivity and heart-rate variability in prediction of total cardiac mortality after myocardial infarction. ATRAMI (Autonomic Tone and Reflexes After Myocardial Infarction) Investigators. Lancet 1998; 351:478–484. 32 Odenmuyiwa O, Malik M, Farrell T, Bashir Y, Poloniecki J, Camm J.
Comparison of the predictive characteristics of heart rate variability index and left ventricular ejection fraction for all-cause mortality, arrhythmic events and sudden death afer acute myocardial infarction. Am J Cardiol 1991; 68:434–439.