Under normal circumstances, a test specimen is reported as “negative” when the response of the analyte is absent. However, if the intensity of the internal standard (IS) is low, indicating interference factors, the test could be considered “inconclusive.” A quantitative hypothesis, A = (R × I × S)/L, serves as the “cutoff” for the acceptable signal-to-noise (S/N) ratio for the IS in making “negative/inconclusive” decisions, where A is the acceptable S/N ratio for internal standard; R is the relative response of the IS and the analyte (same concentration); I is the concentration of the IS; S is the (minimal S/N ratio); and L is the limit of detection. The hypothesis was empirically tested using the 9-carboxy-11-nor-∆∆9
-tetrahydrocannabinol (THC-COOH) analyte, THC-COOH-d3IS,
with ibuprofen and hydrogen peroxide (H2O2) as interference factors. Urine specimens containing 0–5 ng/mL of THC-COOH were spiked with various quantities of ibuprofen or H2O2,
followed by liquid–liquid extraction, derivatization, and gas chromatography–mass spectrometry (GC–MS) analysis under selected-ion-monitoring mode. Among the “adulterated” test specimens evaluated (those with an S/N for the internal standard below the acceptable IS S/N “A”) the quantitative criterion was indeed found to provide a useful guide for making negative/inconclusive decisions. This equation could be programmed into the instrument software to flag results as being inconclusive when they do not meet the criteria described in this paper.
Introduction
Interference factors such as adulteration, substitution, or badly decomposed or contaminated postmortem specimens may result in poor recovery of the analyte and internal stan-dard (IS), causing false-negative or inconclusive results in tox-icology tests. Even under normal analytical conditions where
the IS is poorly recovered, the substance may escape detection if it is present at or near the limit of detection (LOD). As the most commonly abused substance in the United States, mar-ijuana (in the form of the commonly targeted metabolite, 9-carboxy-11-nor-∆9-tetrahydro-cannabinol, or THC-COOH)
constitutes a substantial portion of positive specimens re-ported by forensic urine drug testing laboratories (1). There-fore, specimen adulteration (and substitution) activities have most commonly been associated with urine specimens de-rived from marijuana users. Approaches proven to be effective for the adulteration of THC-COOH-containing specimens in-clude the addition of oxidants, such as hydrogen peroxide (H2O2) and pyridinium chlorochromate (2–4), bleach
(hypochlorite) (5), nitrite or ammonia-containing substances (6), and ibuprofen, which may interfere with the derivatization of the analyte in the sample preparation process (7).
The most common analytical approach is to incorporate an isotopically-labeled analogue of the analyte as the IS, which serves well to identify false negative test results when the IS is absent and the analyte’s signal is absent. An unexpected low re-sponse from the IS, even in the absence of the analyte’s signal, is indicative of abnormal specimen conditions, and should alert the analyst to investigate further before issuing a “nega-tive” or “inconclusive” report. However, lacking a quantitative tool, the analyst’s decision to issue a negative or inconclusive finding is often subjective in nature.
The objective of this study was to develop a quantitative criterion that would be helpful in making “nega-tive/inconclusive” decisions. Parameters that are included in formulating the proposed acceptable (A) IS signal-to-noise (S/N) “cutoff” are: (i) the relative response (R) of the analyte and the IS when they are present at the same concentration; (ii) the concentration of the IS (I) added into the test specimen; (iii) the minimal signal-to-noise ratio (S) for an acceptable signal; (iv) the limit of detection (LOD) of the adapted analyt-ical protocol. In developing an equation to quantitatively an-alyze the response of the IS for determining the reliability of the procedure to see the analyte at the LOD, we considered the
Intensity of the Internal Standard Response
as the Basis for Reporting a Test Specimen
as Negative or Inconclusive
*Author to whom correspondence should be addressed. E-mail: dennis.canfield@faa.gov.
Ray H. Liu1, Chih-Hung Wu1, Yi-Jun Chen1, Chiung-Dan Chang1, Jason G. Linville2, and Dennis V. Canfield3,*
1Department of Medical Technology, Fooyin University, Kaohsiung Hsien 831-01, Taiwan; 2Department of Justice Sciences,
Uni-versity of Alabama at Birmingham, Birmingham, Alabama 35294-4562; and 3Bioareonautical Sciences Research Laboratory,
Federal Aviation Administration, Oklahoma City, Oklahoma 73125-5066
following variables:
(i) (I) The amount of IS added to the specimen. The IS is normally added in much higher concentrations than the LOD of the procedure. Therefore, detection of the IS cannot be used to indicate that the analyte is truly negative at the LOD of the procedure. The response of the IS would be detected well after the analyte response at the LOD of the procedure dropped below detectable limits. (ii) (R) The relative response of the an-alyte to the IS. If the anan-alyte has a greater response than the IS, the acceptable signal-to-noise ratio of the equation would need to be adjusted lower to account for the lower response of the IS. If the analyte has a lower response than the IS, the accept-able IS S/N should be adjusted higher. (iii) (S) the minimum acceptable S/N for designating a real response. Raising the minimum acceptable S/N for the procedure results in the ac-ceptable IS signal-to-noise being adjusted higher. (iv) (L) the LOD for the procedure takes into account the concentration of the analyte that is detectable. A low LOD results in a higher ac-ceptable IS signal-to-noise.
Laboratory studies were conducted adapting THC-COOH and THC-COOH-d3as the analyte and IS (4,8), with ibuprofen and H2O2serving as the interference factors.
Experimental
Chemicals and reagents
Standard (THC-COOH, 100 µg/mL in ethanol) and deuter-ated IS (THC-COOH-d3, 100 µg/mL in methanol) were ob-tained from Research Triangle Institute (Research Triangle Park, NC) and Radian (Cerilliant) Corporation (Austin, TX), re-spectively. The chemical derivatization reagent (iodomethane) was purchased from Ferak Berlin GmbH (Berlin, Germany). The sources of the interference reagents and extraction sol-vents were as follows: ibuprofen, Sigma-Aldrich (Steinem, Germany); H2O2, Niohon Shiyaku Industries (Osaka, Japan); tetramethylammonium hydroxide (TMAH), ACROS (Fair Lawn, NJ); n-hexane and ethyl acetate, Mallinokrodt Chemical (Phillipsburg, PA); dimethyl sulphoxide (DMSO) and glacial acetic acid, Panreac Quimica SA (Barcelona, Spain); potas-sium hydroxide, Katayama Chemical (Osaka, Japan). Other solvents were analytical or HPLC grade.
Drug-free urine and “adulterated” urine test specimens Drug-free urine specimens were collected from laboratory co-workers, who signed an institutional consent form for their urine to be used in this experiment. This urine was confirmed negative for THC-COOH by gas chromatography–mass spec-trometry (GC–MS). Urine specimens were filtrated with 55-mm filter paper (Toyo Roshi Kaisha, Taito-Ku, Tokyo, Japan) upon collection and refrigerated
Two categories of adulterated urine specimens were pre-pared by adding various amount of ibuprofen or H2O2to arrive at desired concentrations of the adulterants (further described in the Result and Discussion section).
Sample preparation and extraction
Analytical procedures reported in the literature for the anal-ysis of THC-COOH were slightly revised and adapted in this
study. Specific procedures are described as follows. To a clean 16 × 100-mm borosilicate glass tube (Kimble: Vineland, NJ) was added 1 mL of urine sample (calibration standard or test specimen) containing a predetermined concentration of THC-COOH. The IS was added to each tube in the analytical batch using 15 µL working stock solution (1 µg/mL), with a final concentration of 15 ng/mL for the standards and test samples. The mixture was made alkaline with 200 µL of 10-N KOH and incubated for 20 min in a heating block device set at 60°C. The mixture was cooled to room temperature and adjusted to pH 3.5 ± 0.5 by adding 2 mL glacial acetic acid, followed by the ad-dition of 2 mL n-hexane/ethyl acetate (9:1, v/v) mixture. The mixture was vortex-mixed and centrifuged at 2500 rpm (r = 16.5 cm) for 5 min. The organic phase was removed and evap-orated to dryness under a stream of nitrogen at 50°C (4,8–12). The extract residue was suspended in 100 µL of TMAH/DMSO (1:20) and vortex-mixed for 2 min, followed by the addition of 100 µL diluted iodomethane (1:50, v/v, in DMSO). The mixture was incubated at room temperature for 5 min, then acidified with 200 µL of 0.1-N HCl, and extracted with 1 mL n-hexane. The organic phase was removed and evaporated to dryness under a stream of nitrogen at 50°C. Finally, the residue was re-constituted with cyclohexane. Typically, the reconstitution volume was 100 µL, while 1 µL was injected for GC–MS anal-ysis (4,13,14).
GC–MS analysis
GC–MS analysis was performed on an Agilent 6980 GC in-terfaced to an Agilent 5975 MS (Agilent, Palo Alto, CA). A 12 m HP-5 crosslinked 5% phenyl methyl siloxane capillary column (200 µm i.d., 0.33 µm film thickness) from Agilent was used for this study. Helium carrier gas flow rate was set at 1.0 mL/min. The injector and GC–MS interface temperatures were matained at 260°C and 280°C, respectively. The sample was in-troduced into the gas chromatograph in the splitless mode. The initial oven temperature was held at 150°C for 1 min, then raised to 270°C at 30°C/min, and held for 5 min. The final temperature was set at 300°C and held for 4 min to clean up the system before recycling back to the initial temperature for next injection. The following ions were selected to monitor methyl-derivatives of the analyte and the IS: m/z 313, 357, and 372 for COOH; and 316, 360, and 375 for
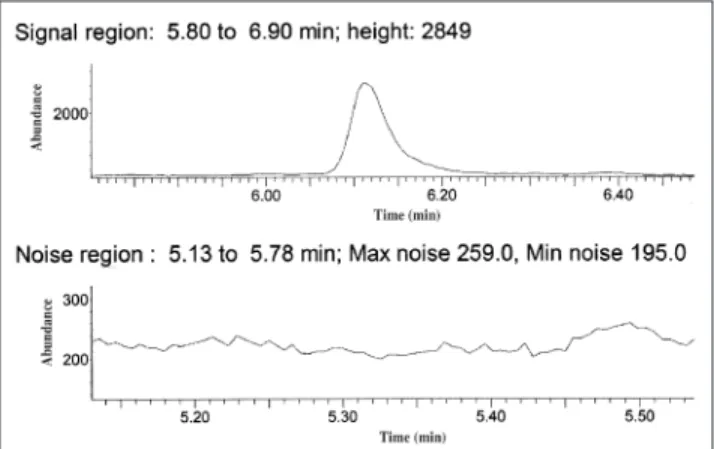
THC-Figure 1. Chromatograph showing example of signal-to-noise measure-ment.
COOH-d3. The first ion listed for each com-pound was used for quantization (4,13–14). Calculation of S/N
The IS peak height and average noise peak height were used to calculate the S/N (Figure 1). The average noise peak height is the av-erage of the max noise + minimum noise peak height divided by 2, measured in the region adjacent to the IS peak. The noise peak height is affected by many variables, including dirty detector, column degradation, specimen ma-trix, carrier gas purity, and putrefaction of the specimen.
Result and Discussion
Under normal circumstances, a test spec-imen will be reported as “positive” when the analyte’s signal is above the detection limit, and “negative” when the analyte’s response is absent or at the noise level. However, if the in-tensity of the IS is critically low, indicating the presence of interference factors, the test should be considered “inconclusive,” even in the absence of the analyte’s signal. A quanti-tative criterion is developed to serve as the “cutoff” for making “negative/inconclusive” decisions when the response of the IS falls in the critical range. Specifically, the hypothesis states that when
S/N IS > (R × I × S)/L Eq. 1
the specimen can be reported as “negative”; otherwise, the test should be considered “in-conclusive,” where R is the relative response of the IS and the analyte (when present at the same concentration); I is the concentration of the IS; S is the 3 (the minimal S/N for an ac-ceptable signal); and L is the limit of detection of the analytical protocol.
In this empirical study, ibuprofen and H2O2 were adapted as the interference factors and added into THC-COOH-containing urine spec-imens to create circumstances under which the signal levels of the analyte (THC-COOH) and the IS (THC-COOH-d3) are at the critical levels, requiring a quantitative guide for making negative/inconclusive decisions. Ibuprofen and H2O2interfere with the GC-MS assay of THC-COOH with different mech-anisms. Specifically, ibuprofen competes with the analyte (and the IS) at the derivatization step, while H2O2destroys the analyte (and the IS) through an oxidation reaction.
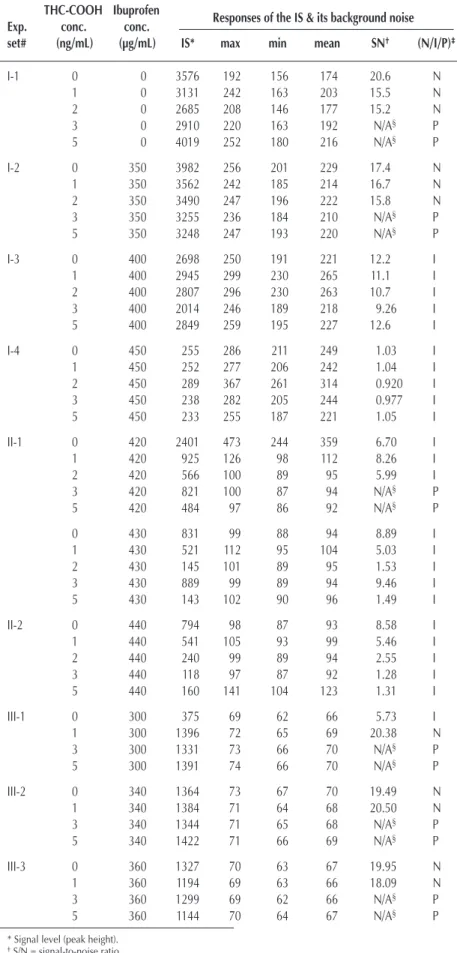
Table I. Ibuprofen Interference on GC–MS Analysis of THC-COOH THC-COOH Ibuprofen
Exp. conc. conc. Responses of the IS & its background noise
set# (ng/mL) (µg/mL) IS* max min mean SN† (N/I/P)‡
I-1 0 0 3576 192 156 174 20.6 N 1 0 3131 242 163 203 15.5 N 2 0 2685 208 146 177 15.2 N 3 0 2910 220 163 192 N/A§ P 5 0 4019 252 180 216 N/A§ P I-2 0 350 3982 256 201 229 17.4 N 1 350 3562 242 185 214 16.7 N 2 350 3490 247 196 222 15.8 N 3 350 3255 236 184 210 N/A§ P 5 350 3248 247 193 220 N/A§ P I-3 0 400 2698 250 191 221 12.2 I 1 400 2945 299 230 265 11.1 I 2 400 2807 296 230 263 10.7 I 3 400 2014 246 189 218 9.26 I 5 400 2849 259 195 227 12.6 I I-4 0 450 255 286 211 249 1.03 I 1 450 252 277 206 242 1.04 I 2 450 289 367 261 314 0.920 I 3 450 238 282 205 244 0.977 I 5 450 233 255 187 221 1.05 I II-1 0 420 2401 473 244 359 6.70 I 1 420 925 126 98 112 8.26 I 2 420 566 100 89 95 5.99 I 3 420 821 100 87 94 N/A§ P 5 420 484 97 86 92 N/A§ P 0 430 831 99 88 94 8.89 I 1 430 521 112 95 104 5.03 I 2 430 145 101 89 95 1.53 I 3 430 889 99 89 94 9.46 I 5 430 143 102 90 96 1.49 I II-2 0 440 794 98 87 93 8.58 I 1 440 541 105 93 99 5.46 I 2 440 240 99 89 94 2.55 I 3 440 118 97 87 92 1.28 I 5 440 160 141 104 123 1.31 I III-1 0 300 375 69 62 66 5.73 I 1 300 1396 72 65 69 20.38 N 3 300 1331 73 66 70 N/A§ P 5 300 1391 74 66 70 N/A§ P III-2 0 340 1364 73 67 70 19.49 N 1 340 1384 71 64 68 20.50 N 3 340 1344 71 65 68 N/A§ P 5 340 1422 71 66 69 N/A§ P III-3 0 360 1327 70 63 67 19.95 N 1 360 1194 69 63 66 18.09 N 3 360 1299 69 62 66 N/A§ P 5 360 1144 70 64 67 N/A§ P
* Signal level (peak height). †S/N = signal-to-noise ratio
‡N: negative; I: inconclusive; P: positive.
§Intensities of the ions designating the analyte and the IS were abundant and meet the ion intensity ratio required for “positive” designations.
Analytical parameters
For the purpose of this study, the concentration of the IS (I) was set at 15 ng/mL, as commonly adapted by urine drug testing laboratories, while the S/N for an acceptable signal is set at 3. A series of preliminary experiments (data not shown) were performed to establish the limit of detection of the adapted analytical protocol as 3 ng/mL and the relative re-sponse of the analyte (m/z 313) and the IS (m/z 316), when they are present at the same concentration, as 0.85. Additional series of preliminary studies indicated the best analyte (THC-COOH) concentration suitable for this study is at the 0–5 ng/mL range, while the amounts of the interference factors, ibuprofen and H2O2(35% solution), are 350–450 µg/mL and
75–200 µL, respectively.
When the amounts of the interference factors are below the lower limits, the signals of the IS and the analyte are not sig-nificantly interfered; thus, a specimen containing the analyte above the LOD can be properly reported as being positive or negative, using the normal ion intensity ratio criteria. On the other hand, when the amounts of the interference factors are above the higher limits, the signal for the IS becomes absent, sulting in the test being listed as inconclusive, again without re-quiring any additional criterion in the decision-making process. When the amounts of the interference factors are in the critical range (75–200 µL for H2O2and 350–450 µg/mL for
ibuprofen), the signals of the IS and the analyte fall in the critical range, requiring a quantitative criterion to make a negative/inconclusive interpretation of the test results. Specif-ically, the analytical parameters discussed previously allow for the calculation of the acceptable S/N for the IS.
A = (R × I × S)/L = (0.85 × 15 × 3)/3 = 13.
Thus, when the S/N of the IS is greater than 13, the test re-sult can be interpreted as N (negative), otherwise, as I (incon-clusive). The following two sections will focus on the discussion of data collected when the amounts of the interference factors are in the critical range.
Ibuprofen study
Data from Table I clearly demonstrates the concentration of ibuprofen that may cause in-terference to the analytical protocol to fall be-tween 350–450 ng/mL. With this information in mind, four sets of a five-concentration se-ries of standards containing 0, 1, 2, 3, and 5 ng/mL THC-COOH (each with 15 ng/mL IS) were spiked with 0, 350, 400, and 450 ng/mL of ibuprofen. Data derived from this batch of the experiment are shown in Sections 1 to I-4 in Table I. Intensity data shown in the table are the peak heights for the IS (m/z 316).
The S/N of the 0, 1, and 2 ng/mL standards in Sets 1 and 2 are larger than the critical value, (R × I × S)/L = 13, thus, they are cor-rectly designated as “N.” For the 3 and 5 ng/mL standards, the three ions monitored for the analyte are at higher intensity level. The two ion intensity ratios are within ± 20% of corresponding ratios observed in the cali-bration standard; thus, they are designated as “P.” Set I-3 con-centrations all fell below the value calculated with the proposed equation and are designated as inconclusive. For the set of standards (Set I-4) containing 450 ng/mL ibuprofen, the ion in-tensities of the analyte and the IS are all at the noise level; thus, they were designated as “I.” These designations are based on the intensity of the IS; however, the value calculated by the equation would have come to the same conclusion.
Data derived from Sets I-3 and I-4 clearly indicate that the truly critical concentration of ibuprofen falls within the 400–450 ng/mL range. Thus, a second batch of standards containing 420 and 440 ng/mL of ibuprofen was prepared, and the experiment was conducted on a different day. The resulting data shown in Sets II-1 and II-2 (Table I) demonstrate the expected trend (i.e., as the concentration of ibuprofen increases, the standards with higher analyte concentrations are designated as “I”).
To further confirm the observed phenomenon, a third set of standards with ibuprofen concentrations at 300, 340, 360, 380, and 400 ng/mL was studied on yet another day. Data shown in Sets III-1, III-2, III-3, and III-4 (Table I) nicely agree with the data observed in Set I, except for the data from Set III-1 at 0 ng/mL THC. It appears that, in that specimen, unknown factors caused a significant decrease in the IS response relative to all of the other specimens in Set III-1. The equation did, however, correctly identify this specimen as inconclusive because the IS was not significantly recovered to ensure that the analyte of in-terest would have been detected if it had been present at the LOD.
Sets I-3 and III-5 had the same concentration of interfering substance (400 µg/mL ibuprofen); however, Set III-5 had a much lower S/N. This demonstrates the importance of taking into consideration the S/N when calculating the acceptable recovery of the IS for the identification of the analyte of interest at the LOD of the procedure.
Hydrogen peroxide study
Several sets of standards containing 0, 1, 3, and 5 ng/mL of Table I. (continued) Ibuprofen Interference on GC–MS Analysis of
THC-COOH
THC-COOH Ibuprofen
Exp. conc. conc. Responses of the IS & its background noise
set# (ng/mL) (µg/mL) IS* max min mean S/N† (N/I/P)‡
III-4 0 380 1205 70 63 67 18.12 N 1 380 991 68 62 65 15.25 N 3 380 1124 69 62 66 N/A§ P 5 380 1102 67 61 64 N/A§ P III-5 0 400 963 66 61 64 15.17 N 1 400 1159 68 62 65 17.83 N 3 400 1025 67 60 64 N/A§ P 5 400 918 67 61 64 N/A§ P
* Signal level (peak height). †S/N = signal-to-noise ratio
‡N: negative; I: inconclusive; P: positive.
§Intensities of the ions designating the analyte and the IS were abundant and meet the ion intensity ratio required for “positive” designations.
THC-COOH included in this study were spiked with 0, 75, 100, 150, 200, and 300 µL of H2O2solution (35%). During the pre-liminary phase of this study, H2O2was added into these stan-dard solutions immediately following their preparation. These “adulterated” standards were then stored for later analysis. The IS was added when the analytical batches were assembled as practiced in a normal analytical protocol. Data derived from this standard protocol (in terms of the timing in adding the IS) were found sporadic. It was concluded that the reaction be-tween the analyte and H2O2had occurred prior to the addition of the IS, and thus was not suitable for the intended study.
An alternate approach was then adapted in which H2O2was added into the standard solution after the addition of the IS, al-lowing the analyte and the IS to react competitively with the adulterant. Data shown in Table II demonstrates that, as the amount of the H2O2solution increases from 75 µL (Set 2) to 200 µL (Set 5), the standards containing increased concentra-tions of the analyte are designated as “I.” These designaconcentra-tions are based on the quantitative criterion proposed in equation 1.
Conclusions
The validity of the proposed quantitative criterion for desig-nating a test result as “negative” or “inconclusive” in the event of poor recovery of the IS has been demonstrated by the
ibuprofen and H2O2studies. In the absence of an interfering substance, the equation correctly identified all true negatives and positives. The equation did properly identify several false negative results for concentrations at or above the 3 ng/mL LOD of the procedure when the interfering substance was in the critical range. It is interesting to note in data set III (con-centrations 0 to 1 ng/mL), where the equation showed true negative results, that an analyst using subjective judgment may have incorrectly designated these true negative results as inconclusive due to the poor recovery of the IS. It could be in-correctly argued in some of the data presented that some of the 0 ng/mL–2 ng/mL concentrations were incorrectly identified as inconclusive when they were, in fact, negative. However, it is important to realize that the analyst does not know the starting concentration and can only rely on the IS response in making a decision as to whether the test would have detected the ana-lyte at the LOD of the procedure. The equation provided has proven very reliable in quantitatively establishing whether the recovery was sufficient to call a specimen a true negative.
This same equation would prove extremely valuable in the analysis of postmortem specimens where the specimens are contaminated or putrefied, leading to large backgrounds and poor recovery of the IS.
The equation was developed to take into consideration the use of isotopic IS or non-isotopic IS. However, the authors’ ex-periments were limited to isotopic IS and further research will be when needed to prove how effective the proposed equa-tion would be using a non-isotopic IS. If a non-isotopic IS is used, this equation should still be applicable for evaluating the proba-bility of seeing the analyte of interest at the LOD of the procedure given a known R for the IS and analyte. It is very important, when using a non-isotopic IS, that R be calculated after the specimen has been extracted to take into consideration differences in extraction ef-ficiency for the IS and analyte.
Acknowledgments
This work is partially supported by Tai-wanese National Science Council (NSC 94-M-242-003). We thank the Federal Aviation Administration Office of Aviation Accident In-vestigation and the Office of Aerospace Medicine for sponsoring part of this research.
References
1. Department of Health and Human Services, Substance Abuse and Metal Health Services Administration. 2002 National Survey on Drug Use and Health, 2003.
2. B.D. Paul. Six spectroscopic methods for detec-tion of oxidants in urine: implicadetec-tion in differ-Table II. Interference of H2O2* on GC–MS Analysis of THC-COOH
Exp. THC-COOH H2O2* Responses of the IS & its background noise Result
set # conc. (ng/mL) µL IS† max min mean S/N‡ (N/I/P)§
1 0 75 1855 903 625 764 2.43 I 1 75 698 154 95 125 5.61 I 3 75 2759 2734 1304 2019 1.37 I 5 75 1696 703 206 455 N/A# P 2 0 100 1445 392 155 274 5.28 I 1 100 3436 910 491 701 4.91 I 3 100 2095 1989 1022 1506 1.39 I 5 100 1996 772 413 593 N/A# P 3 0 150 1444 518 198 358 4.03 I 1 150 1344 259 156 208 6.48 I 3 150 1588 1666 862 1264 1.26 I 5 150 1682 831 485 658 2.56 I 4 0 200 555 517 188 353 1.57 I 1 200 619 349 174 262 2.37 I 3 200 687 1006 618 812 0.846 I 5 200 172 238 152 195 0.882 I 5 0 300 225 402 175 289 0.780 I 5 300 195 185 133 159 1.23 I * H2O2: concentration 35%. †Signal level (peak height). ‡SN = signal-to-noise ratio.
§ N: negative; I: inconclusive; P: positive.
#Intensities of the ions designating the analyte and the IS were abundant and meet the ion intensity ratio required for “p”.
entiation of normal and adulterated urine. J. Anal. Toxicol. 28: 599–608 (2004).
3. A. Warner. Interference of common household chemicals in immunoassay methods for drugs of abuse. Clin. Chem. 35: 648–651 (1989).
4. A.H. Wu, B. Bristol, K. Sexton, G. Cassella-McLane, V. Holtman, and D.W. Hill. Adulteration of urine by “Urine Luck.”
Clin. Chem. 45: 1051–1057 (1999).
5. C. Baiker, L. Serrano, and B. Lindner. Hypochlorite adulteration of urine causing decreased concentration of ∆9-THC-COOH by
GC–MS. J. Anal. Toxicol. 18: 101–103 (1994).
6. H.L. Tai, M.H.M. Chan, D.T.S. Lee, K.F. Ng, E.L.K. Law, and C.W.K. Lam. Urine adulteration in drug testing. Hong Kong
Psy-chiatry 15: 60–62 (2005).
7. S.D. Brunk. False negative GC–MS assay for carboxy THC due to ibuprofen interference. J. Anal. Toxicol. 12: 290–291 (1988). 8. M.H. Jamerson, J.J. McCue, and K.L. Klette. Urine pH, container
composition, and exposure time influence adsorptive loss of 11-nor-∆9-tetrahydrocannabinol-9-carboxylic acid. J. Anal. Toxicol.
29: 627–631 (2005).
9. K.J. De Cock, F.T. Delbeke, D. De Boer, P. Van Eenoo, and K. Roels. Quantitation of 11-nor-∆9
-tetrahydrocannabinol-9-car-boxylic acid with GC–MS in urine collected for doping analysis.
J. Anal. Toxicol. 27: 106–109 (2003).
10. M.J. Baptista, P.V. Monsanto, E.G.P. Marques, A. Bermejo, S. Avila, A.M. Castanheira, C. Margalho, M. Barroso, and
D.N. Vieira. Hair analysis for ∆9-THC, ∆9-THC-COOH, CBN and
CBD, by GC–MS–EI comparison with GC–MS–NCI for ∆9
-THC-COOH. Forensic Sci. Int. 128: 66–78 (2002).
11. B.A. Goldberger and E.J. Cone. Confirmatory tests for drugs in the workplace by gas chromatography–mass spectrometry. J.
Chro-matogr. A 674: 73–86 (1994).
12. V. Dixit and V.M. Dixit. Solid-phase extraction of 11-nor-∆9
-tetrahydrocannabinol-9-carboxylic acid from human urine with gas chromatographic–mass spectrometric confirmation. J.
Chro-matogr. 567: 81–91 (1991).
13. M.L. Weaver, B.K. Gan, E. Allen, L.D. Baugh, F.Y. Liao, R.H. Liu, J.G. Langner, A.S. Walia, and L.F. Cook. Correlations on ra-dioimmunoassay, fluorescence polarization immunoassay, and enzyme immunoassay of cannabis metabolites with gas chro-matography–mass spectrometry analysis of 11-nor-∆9
-tetrahy-drocannabinol-9-carboxylic acid in urine specimens. Forensic
Sci. Int. 49: 43–56 (1991).
14. C. Giroud, A. Ménétrey, M. Augsburger, T. Buclin, P. Sanchez-Mazas, and P. Mangin. ∆9-THC, 11-OH-∆9-THC and ∆9
-THC-COOH plasma or serum to whole blood concentrations distribution rations in blood samples taken from living and dead people. Forensic Sci. Int. 123: 159–164 (2001).
Manuscript received March 30, 2007; revision received May 30, 2007.