Production of H and O(
3
P) Atoms in the Reaction of CH
2
with O
2
Pei-Fang Lee, Hiroyuki Matsui,* Wei-Yu Chen, and Niann-Shiah Wang*
Department of Applied Chemistry, National Chiao Tung University, 1001, Ta Hsueh Road, Hsinchu 30010, Taiwan ABSTRACT: The reaction CH2 + O2 → products has been
studied by using atomic resonance absorption spectrometry (ARAS) of H and O(3P) atoms behind reflected shock waves
over 1850−2050 K and 2.1−1.7 atm. Measurements of [H]
and [O] are conducted using mixtures of highly diluted CH2I2 (0.2 and 0.4 ppm) with excess O2 (100 and 262 ppm) in Ar;
comparative measurement of [H] in the 0.2 and 0.4 ppm CH2I2+
300 ppm H2 mixture has been conducted simultaneously
to confirm the initial concentration of CH2. The apparent reac-tion rate of CH2 + O2 (k2′), including the contributions of 3CH
2+ O2 → products (2) and1CH2 + O2→ products (3), has been measured from the evolutions of [H] and [O] and
summarized as k2′/cm3molecule−1s−1= (1.90± 0.31) × 10−11. The contribution of1CH2+ O2reaction on the measured
k2′ has been evaluated as 0.15 ± 0.04, with an assumption that k3is independent of temperature and given by the result
measured at room temperature [Langford, A. O.; Petek, H.; Moore, C. B. J. Chem. Phys. 1983, 78, 6650−6659]. The
net rate for the3CH
2+ O2reaction is given as k2/cm3molecule−1s−1= (1.69± 0.31) × 10−11. The result on k2in this
study is found to be consistent with the extrapolation of the previous work at lower temperature range of 295−600 K. [Vinckler, C.; Debruyn, W. J. Phys. Chem. 1979, 83, 2057−2062]; these results can be summarized as k2/cm3molecule−1s−1=
2.74× 10⁻¹¹ exp(−874/T), (T = 295−2050 K). The apparent production yields of H and O atoms for the reaction channels
1,3CH
2+ O2→ H + products (2a, 3a) and1,3CH2+ O2→ O(3P) + products (2b, 3b) have been evaluated asϕ2a′ = 0.59 ± 0.06 and
ϕ2b′ = 0.23 ± 0.06, respectively. The contributions of1CH2+ O2reaction on measuredϕ2a′ and ϕ2b′ are indicated to be minor; the
net branching fractions for the3CH
2+O2reaction are estimated asϕ2a= 0.58± 0.06 and ϕ2b= 0.25± 0.06. No obvious temperature
dependence is indicated in the measured rate constant nor in the branching fractions of H and O atoms. The mechanism of the reaction of CH2 with O2 is discussed based on the result of the present study together with those of the previous theoretical/ experimental studies.
1. INTRODUCTION
Investigation of the reaction of CH2 (X̃3B
1) and CH2 (ã1A1)
(denoted as3CH
2and1CH2,respectively) with O2is still a
chal-lenging subject, in spite of extensive theoretical and experimental explorations over the last several decades.
The reaction is too complicated (associated with multiple potential energy surfaces leading to many possible product channels) to get a clear insight into the detailed reaction mecha-nism.1−13 The reaction intermediate CH2O2 (starting from 3CH
2+ O2) is called a Criegee intermediate, 2
and is regarded as a key species in the ozonolysis of alkenes in atmospheric reaction cycle.14−16This reaction is also important in the combustion of hydrocarbon fuels.17−19
The rate of the CH2+ O2reaction has been measured by
several groups.20−25Vinckler and Debruyn conducted a mass-spectrometric measurement of the rate for the 3CH2 + O2
reaction over 295−600 K:21their result agrees well with those
by detection of 3CH2 by LMR spectrometers
24
and the
infrared diode laser probe method22 at around room
tem-perature. Only one data has been reported at high tempera-ture range (T > 1000 K) by using a shock tube technique combined with the atomic resonance absorption spectrometry (ARAS) technique,23,25but the extrapolation of the result of Vinckler and Debruyn with the experimentally observed
activation energy of 1500 cal/mol to the high tempera-ture range is inconsistent with the result of the shock tube measurement.
For the reaction of1CH
2+ O2, Ashford et al. reported the
rate of removal (reaction + collisional quenching) at 298 K as 3× 10⁻¹¹cm3molecule−1s−1via the laser inducedfluorescence
(LIF) detection method.26 Langford et al. also studied the removal rate of1CH2in the1CH2+ O2reaction as 7.4× 10⁻¹¹
cm3 molecule−1s−1 at 295 K by using resonance absorption of1CH
2with a continuous wave (cw) laser at 590−610 nm.27
On the basis of the latter result, GRI mech-3.0 employs the net rate of 6.64× 10⁻¹¹ cm3molecule−1s−1(independent of
temperature) in the reaction model for the combustion of natural gas.18
Much less information is available for the detailed reaction mechanism and product branching of the title reaction. It is generally accepted that thefirst step of the3CH2+ O2reaction is
to form a CH2OO radical (Criegee), then rearrangement to
dioxirane, dioxymethane, and highly excited formic acid may take place prior to the formation of thefinal products: i.e.,
Received: July 18, 2012
Revised: August 20, 2012
Published: August 20, 2012
In this study, evolutions of H and O atoms produced in the shock heated samples of 0.2−0.4 ppm CH2I2with 100−263 ppm
O2 diluted in Ar have been quantitatively measured between 1850 and 2050 K, where CH2I2has been used to supply3CH2by
utilizing sequential C−I bond fission, i.e.,
+ → + +
CH I2 2 M CH I2 I M (1a)
and
+ → + +
CH I2 M 3CH2 I M (1b)
Thermal decomposition of CH2I2 has been studied by
monitoring evolutions of I atoms using a low concentration of CH2I2 (0.1 ppm CH2I2 in Ar) in our previous study.
28
CH2I2is suggested to be a clean source to supply3CH2below
2000 K, since sequential C−I bond fission processes are
confirmed to be dominant over other product channels, and the rate for producing 3CH2 is found to be ln(k2/ cm3
molecule−1 s−1) = −(17.28 ± 0.79) − (30.17 ± 1.40) ×
103/T, which is sufficiently fast to study the title reaction at T > 1800 K.
The reaction CH2I + O2has been studied recently; the rate is given
by k(CH2I + O2) = (1.39± 0.01) × 10−12(T/300 K)−1.55±0.06cm3
molecule−1s−1for T = 222−450 K,29and the main product channel has been assigned as CH2O2+I.30
The contribution of the reaction of the intermediate CH2I with
O2 is negligibly small for the experimental conditions of this
study at an elevated temperature range, then the reactions to be considered in the study of the low concentration CH2I2+ excess
O2in Ar can be simplified as
+ → + + CH I2 2 Ar 3CH2 2I Ar (1) + → CH2 O products 3 2 (2) + → CH2 O products 1 2 (3) + ↔ + CH2 Ar CH Ar 1 2 3 (4) + → + H O2 OH O (5)
For the convenience of analyzing the experimental data on the evolutions of H and O atoms, the product channels of reactions 2 and 3 may be expressed as follows:
+ → + CH2 O H products 3 2 (2a) + → + CH2 O O products 3 2 (2b) + →
CH2 O products without H and O 3 2 (2c) and + → + CH2 O H products 1 2 (3a) + → + CH2 O O products 1 2 (3b) + →
CH2 O products without H and O 1
2 (3c)
Here, the reaction channel associated with the simultaneous production of H and O atoms is not taken into consideration, i.e., the branching fractions for reactions 2c and 3c are given by ϕ2c= 1− (ϕ2a+ϕ2b) andϕ3c= 1− (ϕ3a+ϕ3b), whereϕ2a= k2a/k2,
ϕ2b= k2b/k2,ϕ3a= k3a/k3, andϕ3b= k3b/k3.
A schematic energy diagram for this reaction system is shown in Figure 1; there seems to be many product channels energetically allowed. In order to discuss the yields of H and O atoms, it may be convenient to label the possible product chan-nels as follows: + → + CH2 O HCO OH 3 2 (2a-1) →H+CO+OH (2a-2) →HOCO+H (2a-3) →2H+CO2 (2a-4) →CH O2 +O( P)3 (2b-1) →CO2 +H2 (2c-1) →CO+H O2 (2c-2)
→other products (without H and O) (2c-3) The reactions 2a-1 to 2a-4 correspond to the formation of H atoms (reaction 2a), since HCO and HOCO should rapidly decompose at high temperature to form H + CO and H + CO2,
respectively. By contrast, only a single reaction channel (2b-1) may be a candidate for the formation of O atoms (2b).
Also, due to the very rapid collisional excitation of3CH2to 1CH
2(−4), it is necessary to consider the same reaction scheme
as above for the reaction1CH
2+ O2(3) for the study at high
temperature, i.e., + → + CH2 O HCO OH 1 2 (3a-1) →H+CO+OH (3a-2) →HOCO+H (3a-3) →2H+CO2 (3a-4) →CH O2 +O( P)3 (3b-1) →CO2 +H2 (3c-1) →CO+H O2 (3c-2)
→other products (without H and O) (3c-3) Figure 1.Schematic of the potential energy diagram of the CH2+ O2
reaction system. Relative energy compared with dioxirane is demonstrated; energies for the reaction intermediates and the transition states TS1-TS6 are taken from ref 13, and speculated reaction paths are illustrated by dotted lines.
Experimental examination of the product branching for the reaction3CH
2+ O2was conducted by the IR diode laser
absorp-tion method at room temperature for the stable products CO2,
CO, and CH2O:31 the branching fractions for the production channels of CO2, CO, and CH2O were indicated as 0.40 ±
(0.07−0.09), 0.34 ± 0.02, and 0.16 ± 0.04, respectively. Also OH production was suggested to be about the same amount of CO (or HCO) from the analysis of kinetic simulation. Measurement of the product branching for H and O atoms (assigned in the present study asϕ2aandϕ2b, respectively) was conducted by a
shock-tube/ARAS technique23,25 at elevated temperature T = 1000−1700 K, and the result was indicated to be ϕ2a≅ 0.2 and
ϕ2b≅ 0.1.
The issue of the present study is to reinvestigate the mecha-nism of the reaction, CH2+ O2→ products, by using a shock tube/ARAS system for H and O(3P) atoms; the main difference of our study from the previous one23,25is to employ much lower concentrations of the source for3CH
2(0.2−0.4 ppm, less than
1/100 of the previous study) to reduce the contributions of the secondary reactions.
2. EXPERIMENTAL SYSTEM
A diaphragmless shock tube apparatus (length 5.9 m and i.d. 7.6 cm) with an ARAS detection system was used. The details of the experiments were described in previous studies.32,33 For the measurements of temporal profiles of [H] and [O], resonant atomic absorption of H atoms at 121.6 nm and that of O atoms at 130.5 nm was monitored by using a
microwave-discharge lamp filtered with a VUV monochromator with
f = 20 cm, and detected by a solar-blind photomultiplier tube.
Gas mixture of 1% H2or O2diluted in a Heflow of 10 Torr
was supplied in the microwave-discharge lamp. VUV light
passed perpendicularly through the MgF2windows at 4 cm
upstream of the end plate of the shock tube. All the
mea-surements were conducted behind reflected shock waves,
and the experimental temperature and the concentrations were evaluated by using the ideal one-dimensional Rankine− Hugoniot relations.
Decomposition of C2H5I was used to construct a calibration
curve of the concentration of H atoms as reported in our previous papers,28,32 where, the branching fraction for the reaction channel C2H5I + Ar→ C2H5+ I + Ar was given as 0.90± 0.05. A calibration curve for O(3P) atoms was con-structed using reactions H + O2→ OH + O(3P) and thermal
decomposition N2O + Ar→ N2+ O(3P) + Ar in the mixtures
of 0.3−0.5 ppm C2H5I + 300 ppm O2(T = 1800−2000 K), and
0.1−0.3 ppm N2O (T = 2800−3300 K) diluted in Ar,
re-spectively. Temperature dependence on the calibration curve of O atoms was not detected, i.e., the relationship of [O] against absorbance is consistent each other for these different precursors in the different temperature ranges. The sensitivity for H and O atoms in the present experimental system is high; a detection limit of (1−2) × 1011atom/cm3is attained. The
signal-to-noise (S/N) ratio for the observed signal intensity for O atoms is about 1/3 of that for H atoms. The response time of the present detection system is about 25μs
(deter-mined from the profiles of H and I atoms produced in the
C2H5I decomposition); it is necessary to choose suitable experimental conditions adequate to analyze the evolutions of Table 1. Summary of the Experimental Conditions for the Study on the Reaction CH2+ O2and the Evaluated Rates and Branching
Fractionsa T/K P/atm [CH2I2]0b [O2]c [Ar]d Kc4 k2′e k2e ϕ2a′f ϕ2ag ϕ2b′f ϕ2bh Measurement of [H] 0.4 ppm CH2I2+ 100 ppm O2 1858 2.1 3.13 0.83 8.28 0.041 1.76± 0.36 1.49± 0.34 0.60± 0.030 0.58 1954 1.98 2.98 0.74 7.44 0.046 1.33± 0.40 1.02± 0.38 0.60± 0.031 0.57 2055 1.77 2.52 0.63 6.31 0.051 1.91± 0.48 1.57± 0.46 0.61± 0.04 0.59 0.2 ppm CH2I2+ 100 ppm O2 1858 2.09 1.65 0.82 8.24 0.041 1.65± 0.36 1.38± 0.34 0.69± 0.029 0.69 1905 2.04 1.57 0.79 7.87 0.043 1.79± 0.38 1.50± 0.65 0.60± 0.030 0.58 1938 2.01 1.52 0.76 7.62 0.045 1.87± 0.49 1.57± 0.46 0.62± 0.031 0.6 2005 1.91 1.4 0.7 7.01 0.049 1.94± 0.43 1.62± 0.41 0.69± 0.030 0.58 Measurement of [O] 0.4 ppm CH2I2+ 100 ppm O2 1895 2.04 3.14 0.78 7.84 0.043 1.84± 0.38 1.56± 0.36 0.51± 0.04 0.48 0.21± 0.04 0.25 1935 2.01 3.05 0.76 7.61 0.045 2.16± 0.40 1.86± 0.37 0.63± 0.04 0.62 0.26± 0.04 0.30 1994 1.9 2.79 0.7 6.99 0.048 2.08± 0.41 1.76± 0.38 0.58± 0.03 0.56 0.22± 0.04 0.26 0.2 ppm CH2I2+ 100 ppm O2 1858 2.09 1.65 0.82 8.24 0.041 1.73± 0.30 1.46± 0.28 0.48± 0.05 0.44 0.25± 0.04 0.30 1905 2.04 1.57 0.79 7.87 0.043 2.42± 0.33 2.13± 0.30 0.54± 0.04 0.52 0.24± 0.03 0.27 1937 2.01 1.52 0.76 7.61 0.045 2.54± 0.39 2.24± 0.36 0.60± 0.03 0.59 0.25± 0.03 0.28 2002 1.91 1.4 0.7 7.01 0.049 2.21± 0.43 1.89± 0.40 0.53± 0.05 0.51 0.25± 0.05 0.29 0.4 ppm CH2I2+ 262 ppm O2 1850 2.01 3.19 2.15 8.22 0.04 1.41± 0.18 1.34± 0.16 0.62± 0.04 0.61 0.21± 0.02 0.25 1921 1.99 3.04 1.99 7.59 0.044 1.84± 0.24 1.55± 0.21 0.62± 0.05 0.61 0.20± 0.03 0.24 2005 1.91 2.79 1.83 6.98 0.049 1.86± 0.31 1.54± 0.29 0.58± 0.04 0.55 0.21± 0.05 0.25
aAll the measurements for H and O atoms have been repeated two times at the same shock wave condition so as to confirm the reproducibility.
Experimental conditions summarized in this table are shown by the averaged values. Uncertainties of temperature brought by thefluctuation of the incident shock wave velocity are within±5 K.b1012molecules cm−3.c1015molecules cm−3.d1018molecules cm−3.e10−11cm3molecule−1s−1. fϕ
H and O to evaluate the rates and branching fractions with sufficient reliability.
As a standard routine of this study, evacuation of the sample cylinders and the test section of the shock tube has been continued with baking process under a high vacuum level (below 10−7Torr) until the level of H atoms produced in the blank test of shock heated pure Ar falls down below the detection limit. Also, blank tests for H and O atoms by ARAS have been carefully conducted so as to confirm that the contributions of the back-ground H and/or O atoms from impurities produced in H2/Ar
and O2/Ar mixtures are negligible. In addition, measurements for the title reaction have been repeated at least two times for all the shock conditions to retain the reliability.
Sample mixtures of 0.2/0.4 ppm CH2I2+100/262 ppm O2
and 0.2/0.4 ppm CH2I2 +300 ppm H2 diluted in Ar are
prepared simply by the measurement of pressure by using a combination of Baratron pressure gauges. These CH2I2/H2 and CH2I2/ O2 samples were prepared by introducing the
same partial pressure of CH2I2 into the separate sample cylinders at the same time so as to ensure the concentration of CH2I2through the comparative measurements, as demon-strated in the following section. The initial concentration of CH2I2 can be re-evaluated by analyzing the evolution of H atoms produced in the mixture of CH2I2+ 300 ppm H2.
Con-ducting all these additional experimental procedures is actually time-consuming, but such careful examination should be essential to guarantee the reliability when the concentra-tion of the test gas is extremely low.
He (99.9995%, AGA Specialty Gases) and Ar (99.9995%, AGA Specialty Gases), H2(99.9995%, AGA Specialty Gases), O2
(99.995%, Scott Specialty Gases), and N2O (99.999%, Scott Specialty Gases) are used without further purification. CH2I2
(99%, Sigma-Aldrich, Reagent Plus grade) and C2H5I (99%, Sigma-Aldrich, Reagent Plus grade) are purified by repeating degassing by successive freezing and pumping cycles.
3. EXPERIMENTAL RESULTS
The experimental condition is summarized in Table 1. Evolutions of H and O atoms are monitored in the temperature range 1850−2050 K: The lower limit of the temperature range is chosen so that the thermal decomposition of CH2I2is sufficiently
fast enough to evaluate the rates and the branching fractions of the reaction1,3CH
2+ O2→ products (reactions 2 and 3), without
having too large uncertainty, and the upper limit is to avoid the influence of the thermal decomposition of CH2O, which is
expected to be one of the possible products of reactions 2 and 3. The evolutions of [H] observed in the mixtures of 0.2 ppm CH2I2+ 100 ppm O2and 0.2 ppm CH2I2+ 300 ppm H2are
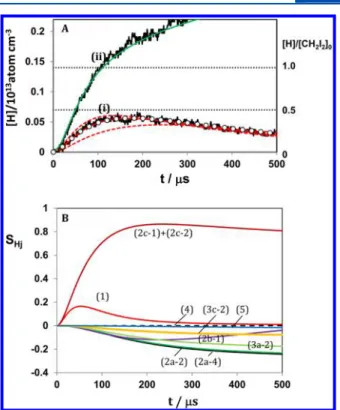
demonstrated in Figure 2.
For the sample of 0.2 ppm CH2I2+ 100 ppm O2, the evolution
of [H] shows rapid initial increase then followed by slower decay
due to the consumption by H + O2→ OH + O (reaction 5).
By contrast, the profile of [H] in the mixture of 0.2 ppm CH2I2+
300 ppm H2 appears to keep increasing, exceeding the initial
concentration of CH2I2because CH3produced in reactions 6 or
7 can generate another H atom through reaction 8, i.e.,
+ → + CH2 H CH H 3 2 3 (6) + → + CH2 H CH H 1 2 3 (7) + → + CH3 H2 CH4 H (8)
Clearly, the profile of [H] in this case is very sensitive to the initial concentration of CH2I2 (or CH2). As shown by the green solid curve (ii) in Figure 2, evolution of [H] by the numerical computation based on the reaction scheme of Table 2 agrees very well with the observed profile of [H] by using reasonable rates for 6 and 7.28,34,35 Such comparative mea-surement appears to guarantee the assigned initial concen-tration of CH2I2(denoted as [CH2I2]0) assigned from the pres-sure meapres-surement.
In the numerical computation of the evolutions of [H] and [O] atoms, it is practically impossible tofind out an optimized combination of the rate parameters for the complicated reaction system associated with multiple reaction channels only from the experimental information of [H] and [O] atoms; therefore, the present analysis has been based on the simplified reaction schemes 2a−2c and 3a−3c.
The evolutions of [H] and [O] can be analyzed by taking only reactions 1−5 into account, since the concentration of CH2I2is very low in this study; i.e., [CH2I2]0= (1−4) × 1012molecule/
cm3, and the contributions of the secondary reactions should be
negligibly small.
Figure 2.Comparison of the evolutions of H atoms produced in the 0.2 ppm CH2I2+ 100 ppm O2and 0.2 ppm CH2I2+ 300 ppm H2
diluted in Ar (A), and the sensitivity analysis for H atom (B). (A) (i): 0.2 ppm CH2I2+ 100 ppm O2in Ar, T = 2005 K, P = 1.91 atm, [Ar] =
7.0× 10¹⁸/cm3, [O2] = 7.0× 10¹⁴/cm3, [CH2I2]0= 1.40× 10¹²/cm3.
Observed evolutions of H atom (shown by the black solid line) is compared with kinetic simulations using the analytical solution of (II) (red solid curve with k2′/cm3molecule−1s−1= 1.94× 10⁻¹¹),
and the numerical solution using the reaction scheme of Table 2 (black circle). The two red dashed curves are the solutions of (II) with 1.5k2′ and 0.5k2′. (ii): 0.2 ppm CH2I2+ 300 ppm H2in Ar, T =
2005 K, P = 1.91 atm, [Ar] = 7.0× 10¹⁸/cm3, [H2] = 2.1× 10¹⁵/cm3,
[CH2I2]0= 1.40× 10¹²/cm3. The result of the kinetic simulation is
shown by the green solid curve. (B) The sensitivity coefficients for H atom, defined by SHj=∂YH/∂[ln kj], where YHis the mass fraction of H
atom, and the labeled reaction number j is shown in Table 2 as well as in the text.
Table 2. The Reaction Scheme Employed for the Simulations of CH2I2+O2and CH2I2+H2Reactions reactionsa Aa na Θa reference 1 CH I +Ar→ CH +2I+Ar 2 2 3 2 3.12× 10 −8 0 30170 28 2a-2 CH +O →H+OH+CO 2 3 2 see text b 2a-4 CH +O →2H+CO 2 3 2 2 see text b 2b-1 CH +O =O+CH O 2 3 2 2 see text 2c-1 CH +O =H +CO 2 3 2 2 2 see text c 2c-2 CH +O =H O+CO 2 3 2 2 see text c 3a-2 CH +O =H+OH+CO 2 1 2 4.65× 10 −11 0 0 18 3c-2 CH +O =H O+CO 2 1 2 2 1.99× 10 −11 0 0 18 4 CH +Ar= CH +Ar 2 1 3 2 1.50× 10 −11 0 302 18 5 H+O2=OH+O 1.62× 10⁻¹⁰ 0 7475 18 6 CH +H =H+CH 2 3 2 3 7.33× 10 −19 2.3 3699 32 7 CH +H =CH +H 2 1 2 3 1.26× 10 −10 0 0 28 8 CH3+H2=CH4+H 1.49× 10⁻²⁰ 2.7 4740 18 9 O+H+Ar=OH+Ar 5.81× 10⁻⁷ −1 0 18 10 2O+Ar=O2+Ar 1.40× 10⁻⁷ −1 0 18 11 2H+Ar=H2+Ar 1.05× 10⁻⁶ −1 0 18 12 CH3+O2=O+CH O3 5.91× 10⁻¹¹ 0 15347 18 13 CH3+O2=OH+CH O2 3.84× 10⁻¹² 0 10229 18 14 OH+H2=H O2 +H 3.59× 10⁻¹⁶ 1.51 1727 18 15 OH+OH=O+H O2 1.23× 10⁻²¹ −0.37 0 18 16 CH +OH= CH +H O 3 1 2 2 1.07× 10 −6 −1.34 713 18 17 CH +OH= CH +H O 3 3 2 2 9.30× 10 −17 1.6 2725 18 18 CH +OH=CH O+H 2 3 2 3.32× 10 −11 0 0 18 19 2CH ( Ar)3+ =C2H ( Ar)6+ 6.77× 10⁻¹⁶ −1.18 329 18 20 CH3+CH3=C H2 5+H 1.14× 10⁻¹¹ 0.1 5337 18 21 CH + CH =C H +H 3 3 2 2 4 6.64× 10 −11 0 0 18 22 H+C H ( Ar)2 3+ =C H ( Ar)2 4+ 6.08× 10⁻¹² 0.27 141 18 23 CH + CH =H +C H 2 3 3 2 2 2 2 2.66× 10 −9 0 6014 18 24 CH3+O=CH O2 +H 8.41× 10⁻¹¹ 0 0 18 25 CH3+O=H2+CO+H 5.60× 10⁻¹¹ 0 0 18 26 O+H2=OH+H 6.43× 10⁻²⁰ 2.7 3152 18 27 CH O2 +H( )AR CH OH+ =⃗ 2 +AR 8.97× 10 −13 0.454 1813 18 28 CH O2 +H+AR=CH O3 +AR 8.97× 10⁻¹³ 0.454 1309 18 29 CH O2 +H+AR=CH O3 +AR 1.81× 10⁻¹² 0.48 −131 18 30 H2+CO+AR=C H O2 +AR 7.14× 10⁻¹⁷ 1.5 40080 18 31 HCO+Ar=H+CO+Ar 3.11× 10⁻⁷ −1.0 85600 18 32 C H2 4+H+Ar=C H2 5+Ar 8.97× 10⁻¹³ 0.454 916 18 33 C H2 2+H+Ar=C H2 3+Ar 6.51× 10⁻¹² 0 1208 18 34 CH O2 +OH=H O2 +HCO 5.70× 10⁻¹⁵ 1.18 −225 18 35 CH O2 +CH3=CH4+HCO 5.51× 10⁻²¹ 2.81 2951 18 36 CH O2 +H=H2+HCO 9.53× 10⁻¹⁷ 1.9 1381 18 37 CH O2 +O=OH+HCO 6.48× 10⁻¹¹ 0 1782 18 38 CH + CH →2H+C H 2 3 3 2 2 2 3.32× 10 −10 0 5533 18 39 HO2+OH=H O2 +O2 2.41× 10⁻¹¹ 0 −252 18 40 H+O2+Ar=O2+Ar 1.16× 10⁻⁶ −0.8 0 18
With an approximation of the quasi-equilibrium between [1CH 2]
and [3CH2], i.e., [1CH2]/[3CH2] = Kc4 (Kc4 is the equilibrium
constant of reaction 4), the analytical solutions can be given as
= ′ − + × − − − ′ R R R R t t [ CH ]/[CH I ] [ /( )/(1 Kc )] [exp( ) exp( R )] 2 3 2 2 0 1 2 1 4 1 2 (I) ϕ = ′ ′ ′ − × − − − − − − ′ − − − ′ R R R R R t R t R R R t R t R R [H]/[CH I ] [ /( )] {[exp( ) exp( )] /( ) [exp( ) exp( )] /( )} 2 2 0 2a 1 2 2 1 1 5 5 1 2 5 5 2 (II) ϕ ϕ = ′ ′ − × ′ + ′ − R R R R F R F F [O]/[CH I ] [ /( )] [ ( )] 2 2 0 1 2 2 1 2b 1 2a 5 2 3 (III) where F1= [1− exp(−R1t)]/R1− [1 − exp(−R5t)]/R5, F2= {[1− exp(−R1t)]/R1− [1 − exp(−R5t)]/R5}/(R5− R1), F3 = {[1 − exp(−R2′t)]/R2′ − [1 − exp(−R5t)]/R5}/ (R5− R2′). R1 = k1[Ar], k2′ = k2(1 +α)/(1 + Kc4), R2′ = k2′[O2], R5= k5[O2], ϕ2a= k2a/k2,ϕ2b= k2b/k2,ϕ3a= k3a/k3,ϕ3b= k3b/k3, ϕ2a′ = (ϕ2a+αϕ3a)/(1 +α), ϕ2b′ = (ϕ2b+αϕ3b)/(1 +α), andα = (k3/k2)Kc4.
Although the above analytical solution formally corresponds only to the reaction channels of a single H atom formation, i.e., CH2+ O2→ H + products ( reactions2a-1, 2 and 3a-1, 2), the channels of producing two H atoms, i.e., CH2+ O2→ 2H +
products (reactions 2a-3, 4 and 3a-3, 4) can be also included, for instance, by defining the branching fractions as, ϕ2a= (ϕ2a‑2+
2ϕ2a‑4) andϕ3a= (ϕ3a‑2+ 2ϕ3a‑4).
Byfitting the solutions of eqs II and III to the experimentally observed [H] and [O] profiles, it is possible to evaluate k2′, ϕ2a′, and ϕ2b′, where the rates for reactions 1 and 5 are supplied
from previous studies.28,18 The physical-chemical meanings of these parameters are the effective reaction rate and the
branch-ing fractions of producbranch-ing H and O atoms in the reaction of CH2+ O2, respectively, under the quasi-equilibrium condition in
between3CH2and1CH2.
In the analysis of [H], k2′ as well as ϕ2a′ are evaluated by using
eq II so that the normalized deviation of analytical solution from experimental profile becomes minimum. An example of such analysis is shown by the red solid curve in Figure 2A; excellent agreement is attained in the evolution of H atoms for all the experimental data.
Also, the experimental profiles of O atoms for the mixtures of 0.2−0.4 ppm CH2I2+ excess O2are used to evaluate k2′, ϕ2a′, and
ϕ2b′, although the S/N ratio is about 1/3 of that for H atoms. As
shown in Figure 3A, in contrast to [H], the evolution of [O] exhibits consistent increments exceeding the maximum concen-tration of H atoms. The profile of O atoms reflects that additional conversion of H to O atoms through the reaction H + O2→
OH + O (5) is imposed on the initial production of O by reactions 2 and 3, i.e., the asymptote of [O] to t =∞ should correspond toϕ2a′ + ϕ2b′. In the practical data analysis for [O], optimized conditions are searched for the three parameters (R2′, ϕ2a′, and ϕ2b′) by conducting iteration of computation until the
normalized deviation of the solution of eq III from experimental data is minimized. An example of the analytical solution is shown in Figure 3A by the red solid curve: reasonable agreement with the observed evolution of O atoms has been attained for all the data of this study.
The results of the numerical computation using 51 elementary reactions, given in Table2,18,28,36are shown by the black circles in Figures 2A and 3A; excellent agreement of the numerical solutions with the analytical solutions is attained for both H and O atoms. The sensitivity analysis for the profiles of H and O atoms has been also conducted using the reaction scheme of Table 2, and examples are demonstrated in Figures 2B and 3B, respectively. It is confirmed that the reactions other than 1, 2, 3, and 5 exhibit very small sensitivity. Although the reaction scheme employed in Table 2 has not been optimized for the present experimental conditions, it was also prepared for the experiment using a higher concentration of CH2 to afford measurement
of the production yield of CO, which is much less sensitive than H and O atoms. Validity of the reaction scheme and kinetic Table 2. continued reactionsa Aa na Θa reference 41 H+O2+Ar=O2+Ar 1.66× 10⁻¹² 0 0 18 42 HO2+CH3=CH O3 +OH 6.28× 10⁻¹¹ 0 0 18 43 H+HO2=H2+O2 7.44× 10⁻¹¹ 0 538 18 44 H+HO2=O+H O2 6.59× 10⁻¹² 0 338 18 45 H+HO2=2OH 1.40× 10⁻¹⁰ 0 320 18 46 O+HO2=OH+O2 3.32× 10⁻¹¹ 0 0 18 47 CH +HO =CH O+OH 2 3 2 2 3.32× 10 −11 0 0 18 48 CH3+C H2 6=CH4+C H2 5 5.88× 10⁻¹⁸ 2.1 438 18 49 OH+C H2 6=H O2 +C H2 5 1.02× 10⁻¹⁷ 1.7 5262 18 50 H+C H2 6=H2+C H2 5 1.91× 10⁻¹⁶ 1.92 3792 18 51 O+C H2 6=OH+C H2 5 1.49× 10⁻¹⁶ 1.92 2865 18 aThe reverse reaction is considered when the reactants and the products are connected by“ = ”. The rate is expressed by k = ATnexp(−Θ/T) in
units of cm3, molecule, s, and K.bIn conducting numerical simulation,3CH2+ O2→ HCO +CO 2a-1) and3CH2+ O2→ H + HOCO (2a-3) are
represented by 2a-2 and 2a-4, respectively. Any combination of k2a‑2and k2a‑4gives the same calculated profiles of H and O if k2a‑2+ 2k2a‑4is kept
constant for the present experimental condition.cAny combination of k2c‑1and k2c‑2gives the same calculated profiles of H and O as long as k2c‑1+
parameters given in Table 2 will be examined in the extended work.
By conducting calculations concerning experimental uncer-tainties, it is confirmed that the experimental error of k1reported in the original study28does not influence the evaluated k2′, ϕ1a′,
norϕ1b′, since the experimental conditions have been chosen so that the profiles of H and O atoms are sensitive mainly to the rates and branching fractions of reactions 2 and 3, as well as 5. It is also confirmed that the decaying part of the profile of H atoms and the corresponding increment of O atoms followed by the initial production by reactions 2 and 3 can be very well explained by using a single rate expression for the reaction18H + O2→ OH + O (5); very small uncertainty for the evaluated k2′, ϕ1a′, or ϕ1b′,
if any, will be induced by the uncertainty of the rate of reaction 5. The result of the analysis on k2′ [=k2(1 +α)/(1 + Kc4)] is
summarized in Figure 4 as well as in Table 1. Magnitudes of k2′ evaluated independently from the profiles of H and O atoms are found to be consistent each other; all the measured rates can be summarized as k2′/cm3molecule−1s−1= (1.90± 0.31) × 10−11
(T = 1850−2050 K) without obvious temperature dependence. The parameter α represents the relative magnitude of the contribution of1CH
2+ O2(3) against 3CH2+ O2(2) in the
reaction of CH2+ O2; it is possible to evaluateα by employing
the experimental result on k3given in the previous experimental studies at room temperature assuming that k3has no
tempera-ture dependence. The removal rate (reaction 3 + collisional quenching (4)] is reported to be 3× 10⁻¹¹cm3molecule−1s−1at 298 K by Ashford et al.26This is substantially smaller than the result of 7.4× 10⁻¹¹cm3molecule−1s−1measured by Langford et al. at 295 K.27
GRI-mech 3.0 employs the rate for reaction 3 based on the latter study, but the correction for the contribution of reaction 4 has been added, i.e., k3is given as 6.64× 10⁻¹¹cm3molecule−1s−1
(independent of temperature), and the evaluation of the param-eterα = (k3/k2)Kc4in this study has been conducted based on
this rate. The result on α is summarized in Figure 5; the magnitude ofα is indicated to be α = 0.18 ± 0.04. This means that the contribution of1CH
2on the measured rate of k2′ [given
byα/(1 + α)] is only about 15% (if the result of k3reported by
Ashford et al.18is employed, the contribution of1CH
2is less than
10%); i.e., the measured k2′ approximately represents the rate of
reaction 2. The result on k2is summarized in Table 1 and Figure 4 compared with k2′; as a summary, the reaction rate for reaction 2
can be expressed by k2/ cm3molecule−1s−1= (1.69± 0.31) ×
10−11(T = 1850−2050 K).
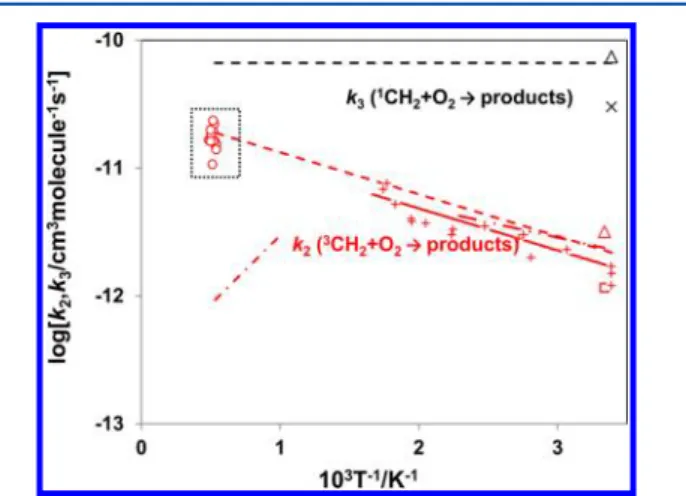
The present results on k2′ and k2 are compared with the previous works in Figure 6. The result of the previous study at high temperature range (1000− 1700 K)23,25 is found to be about an order of magnitude lower than the result of this study. Although the reason for having such disagreement between the results on k2obtained in the previous and the present works is
not clear, contributions of the secondary reactions may be too large in the previous study to evaluate k2accurately. It is also
indicated that extrapolation of k2 measured by Vinckler and Debruyn with a mass-spectrometric technique over 295−600 K21 agrees very well with this study.
Combination of the result on k2at low temperature given by
Vinckler and Debruyn with the present data may be recom-mendable as the database in combustion modeling over a wide temperature range, i.e.,
= × − = −
− − −
k2/cm molecule3 1s1 2.74 1011exp( 874/ ), (T T 295 2050K)
(IV) The results of the measurement of the branching fractionsϕ2a′
andϕ2b′ are summarized in Figure 7 and in Table 1. As for the yield of production of H atoms, the magnitudes ofϕ2a′ analyzed
Figure 3.An example of the evolution of O atoms produced in a highly diluted CH2I2+ O2mixture. Sample gas: 0.2 ppm CH2I2+ 100 ppm O2
in Ar, T = 2005 K, P = 1.91 atm, [Ar] = 7.0× 10¹⁸/cm3, [CH
2I2]0= 1.40×
1012/cm3. (A) Observed evolution of O atom (shown by the black solid
line) is compared with kinetic simulations using the analytical solution of eq III (red solid curve withϕb′ = 0.25), and the numerical solution using
the reaction scheme of Table 2 (black circle). The two red dashed curves are the solutions of (III) withϕb′ = 0.35 and 0.15. (B) The sensitivity
coefficients for O atom, defined by SOj=∂YO/∂[ln kj], where YOis the
mass fraction of O atom, and the labeled reaction number j is shown in Table 2 as well as in the text.
Figure 4.Summary of the reaction rate for CH2+ O2→ products (k2′),
and3CH
2+ O2→ products (k2), obtained in the present study. The
experimental results of this study on k2′ are expressed by the black
symbols, where○= evaluated by the evolution of [H] andΔ = evaluated by the evolution of [O], and k2is expressed by the red symbols, where
○ = evaluated by the evolution of [H] and Δ = evaluated by the evolution of [O]. Extrapolation of the reported k2at low temperature
range (ref 21) is given by the dash-dotted line; also k3(ref 18) is shown
from the evolutions of [H] and [O] are found to be consistent each other. In order to estimateϕ2aandϕ2bfrom the present results ofϕ2a′ and ϕ2b′, it is necessary to assign the branching
fractions of reaction 3 (i.e.,ϕ3aandϕ3b) in addition toα, but no information is available for these branching fractions.
It may be worth mentioning thatϕ2a≅ ϕ2a′ and ϕ2b≅ ϕ2b′ if the product branching fraction for reaction 3 is approximately the same as that for reaction 2, i.e., ϕ3a ≅ ϕ2a, and ϕ3b ≅ ϕ2b, respectively. Even if the product branching fractions for reactions
2 and 3 are very much different each other, only a small
correction is required in convertingϕ2a′ to ϕ2a, as well asϕ2b′ to
ϕ2b, since the contribution of1CH2is minor. As an example, the
results of the analysis onϕ2a andϕ2bby using the branching
fractions proposed in GRI-mech 3.0 (ϕ3a= 0.7 andϕ3b= 0)18are shown in Table 1 and Figure 7. The difference of the estimated ϕ2a′ and ϕ2a, as well as ϕ2b′ and ϕ2bis not large. It would be
appropriate to consider that the branching fractions for reaction 2 are given approximately by averagingϕ2aandϕ2a′ shown in Table 1, as well asϕ2bandϕ2b′, even though reliable information
on the magnitudes ofϕ3aandϕ3bis not available.
As a result of such analysis, the net branching fractions for producing H and O atoms in the3CH
2+O2reaction are given as
ϕ2a= 0.58 ± 0.06 and ϕ2b= 0.25 ± 0.06, where no obvious
temperature dependence is indicated. In addition, the asymptote of [O]/[CH2I2]0 for large t (which should correspond
approximately toϕ2a+ϕ2b) is confirmed to be 0.8 − 0.9 for
the measurements in the highest concentration of O2(262 ppm).
This would also support the validity of the evaluated branching fractions in this study.
4. DISCUSSIONS
It is clearly demonstrated that H and O atoms are the main products of reactions 2 and 3; the sum of the yields of H and O atoms produced in reactions 2 and 3 is shown to be 80−90% of initial CH2. Because the contribution of1CH
2is minor in the
evaluated branching fractions as is shown above, it may be reasonable to focus only to the reaction 3CH
2 + O2 (2), for
simplicity, in the following discussion.
Most of the previous theoretical works discussed only the reaction channels for producing stable molecules such as CO2+
H2or CO + H2O.12,13,37As the reaction is highly exothermic, internally hot reaction intermediates are produced, and the dynamic effect in the product branching should be important; such a nonequilibrium treatment of the reaction systems increases the difficulty in estimating the branching fractions of the products. Due to the interest to the atmospheric chemistry, extensive studies on the ozonolysis of alkenes and structures of carbonyl oxides and their isomers have been conducted to clarify the reaction mechanism.1−10,38−43Direct production of OH and O(3P) was reported in the experimental studies in the ozonolysis of ethene. Strong pressure dependence on the production yield of OH was reported in the reaction of O3+ C2H4; the yield is
0.2 at 1 atm air, but increases to 0.42 at 5.5 Torr.16Production of 0.01−0.05 of O(3P) was indicated in the reaction of3CH2+ O2at
room temperature and 1 atm in another study.38Theoretical calculations have been conducted to evaluate the branching fractions of producing OH42and O(3P)43 in the reactions of C2H4 + O3 including the reaction pathway of CH2O2. Even
though the contribution of the excited state is taken into consideration by using the master equation and statistical theory,
much lower production yields for OH (∼0.2%) than those
observed in the experimental studies were indicated;42however, production yield of OH from excited CH2O2 formed in the reaction of3CH2+ O2can be much higher than that of the
Figure 5.Summary of the evaluated parameter α. The parameter α [relative contributions of1CH2and3CH2in the reaction of CH2+ O2
defined as α = (k3/k2)Kc4] evaluated in this study is expressed by the
black circle (see text).
Figure 6.Arrhenius plot of the reaction rate for3CH
2+ O2→ products
(k2), and1CH2+ O2→ products (k3). k2is expressed by red symbols,
where○= present study,Δ = ref 20,□= ref 22, + and solid line = ref 21, dash-dot line = ref 24, dash-dot-dot line = ref 23, and dashed line = ref 18. k3is expressed by the black symbols, where× = ref 26, Δ = ref 27,
and dashed line = ref 18.
Figure 7.Summary of the measured branching fractions for the reaction CH2+ O2→ H + products, and CH2+ O2→ O + products. Branching
fraction for producing H atom:ϕ2a′ (black symbols) and ϕ2a (red
symbols);○= determined by the evolution of H atom,Δ = determined by the evolution of O atom. Branching fraction for producing O atom, ϕ2b′ and ϕ2b:□= determined by the evolution of O atom. The black
square denotesϕ2b′ corresponding to the reactions1,3CH2+ O2(2, 3)
[ϕ2b′ = ϕ2bifϕ2b=ϕ3b]. The red square denotesϕ2bwith the branching
C2H4+ O3reaction since the former reaction is 20 kcal/mol more exothermic.
The reaction mechanism for the unimolecular decomposition of formic acid (reactions 9) was studied by calculating potential energy surfaces using a quantum-chemical analysis.11,37 Com-putation by the high-level G2M(CC1) method and micro-canonical RRKM theory indicates that two reaction pathways, 9a and 9b, were suggested to dominate other reaction channels:37
→ +
HCOOH CO H O2 (9a)
→CO2 +H2 (9b)
It is also indicated that 9a is far more probable than 9b, i.e., k9a/k9b
= 13.6−13.9 between 1300 and 2000 K.
The present experimental result on the branching fraction for producing H and O atoms indicates that the production of H2+ CO2 in reaction 2c-1 or H2O + CO (2c-2) cannot be the
dominant reaction channels in reaction 2, i.e., the branching for the products containing H and O atoms cannot be explained by the simple unimolecular behavior in the HCOOH decom-position (reactions 9). The branching fractions for the produc-tion channels of CO2and CO in reaction 2 measured by IR diode laser absorption at room temperature31 are also inconsistent with those measured by the unimolecular decomposition of HCOOH.
Although the yields of products may have temperature dependence, it is interesting to compare the branching fractions of CO, CO2, and CH2O measured at room temperature31with the present result on the branching fractions for H and O atoms. As for the production channel of O atoms, it is indicated that O atoms are produced from the surface crossing from the singlet to triplet states of the isomers of CH2OO; the counterpart of the product O(3P) is CH2O, i.e., 3CH2+ O2 → CH2O + O(3P)
(reaction 2b-1) is supposed to be dominant for the production of O atoms.41The branching fraction for O(3P) atoms production (0.25± 0.06) given in this study appears to be slightly larger than that for CH2O (0.16± 0.04.) reported by the IR diode laser
absorption measurement at room temperature;31however, they overlap each other if the error limits are taken into consideration.
As for the production of H atoms, channels 2a-1−2a-4
correspond to reaction 2a, because HCO and HOCO should decompose immediately at high temperature leading to the formation of H + CO and H + CO2; it is not necessary in this
study to consider the contributions of the reactions HCO + O2or HOCO + O2.44,45If H atoms are mainly produced from highly
excited HCOOH (as drawn by the dotted lines in Figure 1), it may be reasonable to assume that reactions 2a-1 and/or (2a-3 are the candidates of the main channels for the production of
H atoms by simply breaking C−OH and/or C−H bonds in
HCOOH, leading to the formation of OH + HCO (2a-1) and H + HOCO (2a-3), respectively. The yields of H atoms measured in this study and those of CO and CO2measured in the IR diode laser absorption can be consistent by assigning approximately the same magnitudes to all the branching fractions for the product channels: H + OH + CO (2a-1 or 2a-2), 2H + CO2(2a-3 or 2a-4), H2+ CO2(2c-1) and H2O + CO (2c-2), i.e., ϕ2a‑1(orϕ2a‑2)≅ ϕ2a‑3(orϕ2a‑4)≅ ϕ2c‑1≅ ϕ2c‑2= 0.2± 0.05. This
may indicate that no special product channel dominates in the reaction3CH2+ O2(2). As a substantial difference exists among
the barrier heights and the heats of formation for these reaction channels, such nonselectivity may be due to the dominance of the reactions of highly excited reaction intermediates even for the relatively high pressure condition (about 2 atm) of this study.
Of course, the above discussion is too simple and primitive for explaining the reaction mechanism of reaction 2. In order to explain the present result on H and O(3P) as main products of
reaction 2, detailed theoretical examination of the reactions of highly excited intermediates would be desirable, even if the reac-tion system may be too complicated for evaluating the product branching quantitatively.
■
AUTHOR INFORMATIONCorresponding Author
*E-mail: Niann-Shiah Wang: [email protected] (N.-S.W.); [email protected] (H.M.).
Notes
The authors declare no competingfinancial interest.
■
ACKNOWLEDGMENTSThis work was supported by the National Science Council of Taiwan under Grant No. NSC 100-2113-M-009-007. H.M. deeply acknowledges the supports by National Science Council of Taiwan and National Chiao Tung University.
■
REFERENCES(1) Ha, T.-K.; Kühne, H.; Vaccani, S.; Güenthard, Hs. H. Chem. Phys. Lett. 1974, 24, 172−174.
(2) Criegee, R. Angew. Chem., Int. Ed. Engl. 1975, 14, 745−752. (3) Harding, L. B.; Goddard, W. J. Am. Chem. Soc. 1978, 100, 7180− 7188.
(4) Karlström, G.; Engström, S.; Jönsson, B. Chem. Phys. Lett. 1979, 67, 343−347.
(5) Cremer, D.; Schmidt, T.; Gauss, J.; Radbakrishnan, T. P. Angew. Chem., Int. Ed. Engl. 1988, 27, 427−428.
(6) Bach, R. D.; Andres, J. L.; Owensby, A. L.; Sclegel, H. B.; McDouall, J. J. W. J. Am. Chem. Soc. 1992, 114, 7207−7217.
(7) Karistrom, G.; Roos, B. O. Chem. Phys. Lett. 1981, 79, 416−420. (8) Cimiraglia, R.; Ha, T.-K.; Günthard, Hs. H. Chem. Phys. Lett. 1982, 85, 262−265.
(9) Dupuis, M.; Lester, W. A. J. Chem. Phys. 1984, 80, 4193−4195. (10) Goddard, J. D.; Yamaguchi, Y.; Schaefer, H. F. J. Chem. Phys. 1992, 96, 1158−1166.
(11) Francisco, J. S. J. Chem. Phys. 1992, 96, 1167−1175.
(12) Anglada, J. M.; Bofill, J. M.; Olivella, S.; Solé, A. J. Phys. Chem. A 1998, 102, 3398−3406.
(13) Chen, B.; Huang, M.; Su, H.; Kong, F. Acta Phys. Chim. Sin. 2000, 16, 869−872.
(14) Gutbrod, R.; Kraka, E.; Schindler, R. N.; Cremer, D. J. Am. Chem. Soc. 1997, 119, 7330−7342.
(15) Horie, O.; Moortgat, G. K. Acc. Chem. Res. 1998, 31, 387−396. (16) Fenske, G. D.; Hasson, A. S.; Paulson, S. E.; Kuwata, K. T.; Ho, A.; Houk, K. N. J. Phys. Chem. A 2000, 104, 7821−7833.
(17) Warnatz, J. In Combustion Chemistry; Gardiner, W.C., Ed.; Springer-Verlag: New York, 1984; Chapter 5.
(18) Smith, G. P.; Golden, D. M.; Frenklach, M.; Moriarty, N. W.; Eiteneer, B.; Goldenberg, M.; Bowman, C. T.; Hanson, R. K.; Song, S.; Gardiner, W. C., Jr.; Lissianski, V. V.; Qin, Z. http://www.me.berkeley. edu/gri mech.
(19) Andersen, A.; Carter, E. A. J. Phys. Chem. A 2003, 107, 9463− 9478.
(20) Pilling, M. J.; Robertson, J. A. J. Chem. Soc., Faraday Trans. 1 1977, 73, 968−984.
(21) Vinckler, C.; Debruyn, W. J. Phys. Chem. 1979, 83, 2057−2062. (22) Darwin, D. C.; Young, A. T.; Johnston, H. S.; Moore, C. B. J. Phys. Chem. 1989, 93, 1074−1078.
(23) Dombrowsky, Ch.; Hwang, S. M.; Rohrig, M.; Wagner, H.Gg. Ber. Bunsenges. Phys. Chem. 1992, 96, 194−198.
(24) Bley, U.; Temps, F.; Wagner, H. Gg.; Wolf, M. Ber. Bunsenges. Phys. Chem. 1992, 96, 1043−1047.
(25) Dombrowsky, Ch.; Wagner, H. Gg. Ber. Bunsenges. Phys. Chem. 1992, 96, 1048−1056.
(26) Ashford, M. N. R.; Fullstone, M. A.; Hankock, G.; Ketley, G. W. Chem. Phys. 1981, 55, 245−257.
(27) Langford, A. O.; Petek, H.; Moore, C. B. J. Chem. Phys. 1983, 78, 6650−6659.
(28) Lee, P.-F.; Matsui, H.; Wang, N.-S. J. Phys. Chem. A 2012, 116, 1891−1896.
(29) Eskola, A. J.; Wojcik-Pastuszka, D.; Ratajczak, E.; Timonen, R. S. Phys. Chem. Chem. Phys. 2006, 8, 1416−1424.
(30) Welz, O.; Savee, J. D.; Osborn, D. L.; Vasu, S. S.; Percival, C. J.; Shallcross, D. E.; Taatjes, C. A. Science 2012, 335, 204−207.
(31) Alvarez, R. A.; Moore, C. B. J. Phys. Chem. 1994, 98, 174−183. (32) Lu, K. W.; Matsui, H.; Huang, C.-L.; Raghunath, P.; Wang, N.-S.; Lin, M. C. J. Phys. Chem. A 2010, 114, 5493−5502.
(33) Wu, C.-W.; Matsui, H.; Wang, N.-S.; Lin, M. C. J. Phys. Chem. A 2011, 115, 8086−8092.
(34) Friedrichs, G.; Wagner, H. Gg. Z. Phys. Chem. 2001, 215, 1601− 1623.
(35) Gannon, K. L.; Blitz, M. A.; Pilling, M. J.; Seakins, P. W.; Klippenstein, S. J.; Harding, L. B. J. Phys. Chem. A 2008, 112, 9575− 9583.
(36) Srinivassan, N. K.; Su, M.-C.; Michael, J. V. J. Phys. Chem. A 2007, 111, 3951−3958.
(37) Chang., J.- G.; Chen, H.− T.; Xu, S.; Lin, M. C. J. Phys. Chem. A 2007, 111, 6789−6797.
(38) Hatakeyama, S.; Bandow, H.; Okuda, M.; Akimoto, H. J. Phys. Chem. 1981, 85, 2249−2257.
(39) Yamaguchi, K.; Ohta, K.; Yabushita, S.; Fueno, T. J. Chem. Phys. 1978, 68, 4323−4324.
(40) Kahn, S. D.; Hehre, W. J.; Pople, J. A. J. Am. Chem. Soc. 1987, 109, 1871−1873.
(41) Paulson, S. E.; Chung, M.; Hasson, A. J. Phys. Chem. A 1999, 103, 8125−8138.
(42) Oltzmann, M.; Kraka, E.; Gremer, D.; Gutbrod, R.; Andersson, S. J. Phys. Chem. A 1997, 101, 9421−9429.
(43) Anglada, J. M.; Bofill, J. M.; Olivella, S.; Sole, A. J. Am. Chem. Soc. 1996, 118, 4636−4647.
(44) Baulch, D. L.; Cobos, C. J.; Cox, R. A.; Frank, P.; Hayman, G.; Just, Th.; Kerr, J. A.; Murrells, T.; Pilling, M. J.; Troe, J.; Walker, R. W.; Warnatz, J. Evaluated kinetic data for combustion modeling, Supple-ment I. J. Phys. Chem. Ref. Data 1994, 23, 847−1034.
(45) Miyoshi, A.; Matsui, H.; Washida, N. J. Chem. Phys. 1994, 100, 3532−3539.