On-line preconcentration and determination of ketamine and
norketamine by micellar electrokinetic chromatography
Complementary method to gas chromatography/mass spectrometry
Hsiu-Ping Jen, Yuan-Chien Tsai, Hsiu-Li Su, You-Zung Hsieh
∗Department of Applied Chemistry, National Chiao Tung University, 1001 Ta Hsueh Road, Hsinchu 300, Taiwan ROC Available online 16 June 2005
Abstract
We have investigated a rapid, simple, and highly efficient on-line preconcentration method using in micellar electrokinetic chromatography (MEKC) for the analysis of abused drugs. Ketamine is an anesthetic that has been abused as a hallucinogen. We applied the sample sweeping technique first to ketamine and its major metabolite, norketamine, and separated the analytes with MEKC. Several of the sweeping MEKC parameters to effect successful separations, such as the concentration of sodium dodecyl sulfate (SDS), the injection time, and the applied voltage were optimized. The improvements in the number of theoretical plates under the different separation conditions are presented clearly in a three-dimensional representation. The limits of detection were 2.8, 3.4, and 3.3 ng/mL for ketamine, norketamine, and ketamine-D4,
respectively. The enrichment factor for each compound was within the range of 540–800. Experimental results are in agreement with those of analysis conducted by gas chromatography/mass spectroscopy (GC/MS). Therefore, we believe that sweeping, combined with MEKC, represents a suitable complementary method to GC/MS for use in clinical and forensic analyses of ketamine and norketamine.
© 2005 Elsevier B.V. All rights reserved.
Keywords: Ketamine; Norketamine; Sweeping; Micellar electrokinetic chromatography; On-line preconcentration
1. Introduction
Ketamine is familiar to emergency physicians as a dis-sociative anesthetic that has been abused as a hallucinogen for almost 30 years. Ketamine produces effects similar to phencyclidine (PCP) in conjunction with the visual effects of lysergic acid diethylamide (LSD) [1]. Ketamine is available as either a powder or a liquid; in its powdered form, it can be inhaled nasally, smoked, or mixed into drinks; in its liquid form, it can be injected or applied to, for example, cigarettes. Ketamine is metabolized to at least two compounds of pharmacological interest. First, ketamine undergoes N-demethylation mediated to form norketamine in the liver. Then, norketamine’s cyclohexanone ring under-goes oxidative metabolism to form dehydronorketamine. Current techniques for analyzing ketamine include the use of
∗Corresponding author. Tel.: +886 3 5731785; fax: +886 3 5723764. E-mail address: [email protected] (Y.-Z. Hsieh).
high-performance liquid chromatography (HPLC)[2–5]and gas chromatography in conjunction with mass spectroscopy (GC/MS) [6]. These approaches almost always employ liquid–liquid extraction (LLE), solid-phase extraction (SPE), or solid-phase microextraction (SPME) techniques to obtain the target substances.
Capillary electrophoresis (CE) is a separation method – based on a physical process quite different from that of chromatography – that has been the focus of much attention for developing new analytical methodologies[7–9]. CE is a powerful technique that is simple, provides rapid results, has high efficiency, resolution, and sensitivity, and involves low sample consumption; additionally, many CE instruments are available commercially. CE is a rapidly growing separation technique that is being applied in bioscience, pharmaceuti-cals, environmental, food science, and forensic research[10]. Micellar electrokinetic chromatography (MEKC), which is one of the basic modes of CE, has become a popular technique for improving CE separation efficiency for both neutral and
0021-9673/$ – see front matter © 2005 Elsevier B.V. All rights reserved. doi:10.1016/j.chroma.2005.05.019
to be prepared in a low-conductivity matrix, but the conduc-tivity equal to or higher than the running micellar solution is favored.
In this paper, we describe a simple and highly sensitive method for the detection of ketamine and its major metabolite, norketamine, in urine using the techniques of on-line precon-centration and sample sweeping, and combined with MEKC. We have optimized several electrophoresis parameters to effect successful separations, such as the concentration of sodium dodecyl sulfate (SDS), the injection time, the applied voltage, and the temperature. We provide a three-dimensional representation to present a clear visualization of the improve-ments in the number of theoretical plates with respect to the different separation conditions. We determined the opti-mal separation conditions for this method and decreased the amount of sample consumed and the separation time. Finally, we also compare the results of this analytical approach with those obtained when using MEKC, sweeping MEKC, and GC/MS.
2. Experimental
2.1. Chemicals
Ketamine hydrochloride (K·HCl, 1 mg/mL methanol), norketamine hydrochloride (NK·HCl, 1 mg/mL methanol), and the internal standard, [2H4]ketamine hydrochloride
(ketamine-d4, K-D4·HCl, 1 g/mL methanol), were obtained
from Radian International. Fig. 1displays their structures. SDS was purchased from Sigma (St. Louis, MO, USA). Disodium hydrogen phosphate (Na2HPO4) and sodium
hydroxide (NaOH) were purchased from Fluka (Buchs, Switzerland). Citric acid was obtained from Merck (Darm-stadt, Germany). Methanol, dichloromethane, n-hexane, isopropanol, acetic acid, ammonium hydroxide, acetone, and phosphoric acid were obtained in analytical grade
A Beckman P/ACE 5500 capillary electrophoresis sys-tem (Beckman Instruments, Fullerton, CA, USA) was used to effect the separations. A diode-array detector was employed for detection. Separations were performed in a 47 cm (40 cm to detector)× 50 m I.D. fused-silica capillary tube (Polymi-cro Technologies, Phoenix, AZ, USA). The capillary tube was assembled in the cartridge format. A personal computer using System Gold software controlled the P/ACE instrument and allowed data analysis. The separation capillary was pre-conditioned prior to use with 1 M NaOH for 30 min, 0.1 M NaOH for 30 min, and then deionized water for 30 min. The sample was injected hydrodynamically and then a negative voltage was applied with the micellar background electrolyte (BGE) at both ends of the capillary to effect separation. Between runs, the capillary was flushed sequentially with 0.1 M NaOH, water, and BGE for 10 min each. The opti-mal buffer (pH 2.6) consisted of 25 mM citric acid/disodium hydrogenphosphate.
2.3. Sweeping and separation procedures
The column we used was a bare fused-silica capillary that we conditioned initially using a low-pH micellar electrolyte. The electroosmotic flow was suppressed by the low pH (2.6). Samples were pressure-injected at 0.5 psi. The detec-tion wavelength was set at 200 nm. The neutral sample moved slowly because the velocity of the electroosmotic flow was very slow. The inlet and outlet of the capillary were placed in vials containing the BGE, and a negative voltage (15–30 kV) was applied. After the anionic micelles entered the sample zone, sweeping and separation were achieved through MEKC [21]. Stock sample solutions were prepared in methanol at a concentration of 100–1000 ppm. Different sample concentra-tions were obtained by diluting concentrated samples while keeping the sample matrix as 25 mM citric acid/disodium hydrogen phosphate and a low percentage of organic solvent (around 5–10%, v/v).
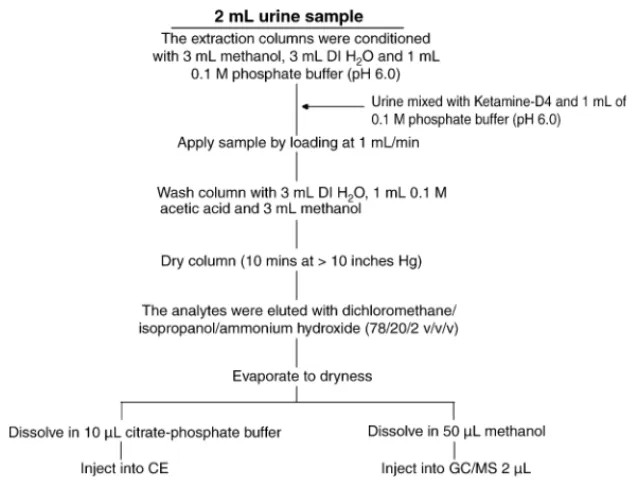
Fig. 2. The procedures used for sample preparation for urine by solid-phase extraction of urine.
2.4. GC/MS apparatus and method
A Hewlett-Packard (HP; Palo Alto, CA, USA) system was used for gas chromatography/mass spectrometry (GC/MS). It consisted of an HP 6890 series GC, an HP 5973 quadrupole mass-selective detector, and an HP 7683 auto-injector; data were collected using an HP Chem Station computer system. Helium was the carrier gas and was used at a flow-rate of 1 mL/min. The injector temperature was 250◦C. A Zebron ZB-5 MS fused-silica capillary column (30 m× 0.25 mm I.D.; 0.25m film thickness of 5% phenylmethylsilicone) provided the analytical separation. The retention times for ketamine, norketamine, and ketamine-d4 (I.S.) were 9.87,
9.60, and 9.84 min, respectively. The oven temperature was programmed as follows: beginning at 120◦C (held for 1 min), the temperature was ramped to 200◦C at 15◦C/min and then held for 2 min. Next, it was ramped to 250◦C at 18◦C/min and then finally held at that temperature for 5.0 min. The total analysis time was 16.12 min. The MS system was oper-ated in electron ionization and selected ion monitoring (SIM) modes. The spectrometer was operated under the following conditions: SIM mode; ionization energy, 70 eV; the ion tem-perature was maintained at 280◦C; 40–300 u at 1.84 scans/s.
2.5. Solid-phase extraction procedure
The cartridges (column type, LRC) were obtained from Varian (CA, USA). The cartridges were conditioned with methanol (3 mL), water (3 mL) and 0.1 M phosphate buffer (pH 6.0; 1 mL). The urine sample (2 mL) was mixed with ketamine-d4 (100L) and 0.1 M phosphate buffer (pH
6.0; 1 mL). The column was washed with deionized water (3 mL), 0.1 M acetic acid (1 mL), and methanol (3 mL), and then it were dried under vacuum for 10 min. The analytes
were eluted with dichloromethane/isopropanol/ammonium hydroxide (78:20:2, v/v/v). The clean organic phase was then evaporated to dryness. The residue was dissolved in methanol (50L) and a sample (2 L) was injected into the GC/MS system.Fig. 2provides detailed procedures.
3. Results and discussion
3.1. Optimizing the conditions for separation by sweeping MEKC
SDS is the most commonly additive used for MEKC during its separation. Fig. 3 displays typical MEKC chromatograms of ketamine (K), norketamine (NK), and ketamine-d4(K-D4) that were separated in the presence of
different concentrations of SDS. In Fig. 3, in addition to SDS, the buffer also consisted of 25 mM citric acid/disodium hydrogenphosphate (pH 2.6). As indicated in chromatogram of Fig. 3a, when 25 mM SDS was used, the separation of the analytes within 5 min was poor. When 50 mM SDS was used, however, the separation (Fig. 3b) began to improve as a result of increased interactions between the analytes and SDS micelles. The separation of the analyte was optimized (Fig. 3c) at an SDS concentration of 75 mM. In the acidic buffer solution (pH 2.6), the electrophoretic mobility of the neutral analytes toward the outlet (anode) is provided by the negative charged SDS micelles. The migration sequence of analytes to the outlet is based on their interaction with SDS. Thus, NK with the highest interaction with SDS migrated first. Under these conditions, we observed migration times in the following order: NK (peak 2) < K (peak 1) < K-D4(peak
3). When the concentration of the SDS was 100 mM (Fig. 3d), peaks K and K-D4became broad and overlapped.
on the analyte’s resolution during sweeping MEKC separa-tion. We performed hydrodynamic injection at a pressure at 0.5 psi, injected the sample solution into the capillary for 90, 120, 150, 180, or 210 s, and then applied a−25 kV poten-tial to effect sweeping MEKC separation. The concentration enhancement of the analytes increased as the injection time increased. Injecting the sample for 150 s provided an excel-lent separation efficiency (Fig. 4c), but longer injection times led to incomplete peak separation; peaks 1 (K) and 2 (NK) gradually overlapped as the injection time increased, which would not allow qualitative analyses in a forensic environ-ment.
The influence that the applied voltage had on the sweep-ing MEKC separation was examined in the range of potential from−15 to −30 kV (data not shown). Clearly, an applied voltage of −25 kV provided the optimal separation. Joule heating occurs upon increasing the applied voltages and results in the occurrence of diffusion phenomena, which leads
that temperature had on the separation condition by varying the capillary temperature from 18 to 30◦C (data not shown). We found that the resolution reduced at 30◦C, so we chose 25◦C as an optimum separation temperature.
3.2. Three-dimensional representation of the effects
The number of theoretical plates changed as a function of the conditions of the many different experiments, i.e., the injection time, SDS concentration, applied voltage, and tem-perature;Fig. 5provides a clear visualization of these data for K and NK in three-dimensional representation.Fig. 5a indicates the plate numbers for K and NK, respectively, in the range from 1.0× 10⁵to 3.6× 10⁵. We have fitted contin-uous analytical functions to the experimental values to guide the eye; they indicate that the optimized plate numbers for K and NK of 3.48× 10⁵and 2.81× 10⁵, respectively, occur for injection times in the neighborhood of 150 s at an SDS
Fig. 4. Effects that different injection times have on sweeping MEKC separations. (a) 90 s, (b) 120 s, (c) 150 s, (d) 180 s, and (e) 210 s. Conditions: SDS concentration, 75 mM; sample concentrations: 500, 300, and 200 ppb for K (peak 1), NK (peak 2), and K-D4(peak 3), respectively. Other conditions are the same as those inFig. 3.
Fig. 5. Three-dimensional representation of the effects that (a) SDS concentration and injection time, (b) applied voltage and injection time have on the number of theoretical plates for (1) ketamine and (2) norketamine.
concentration of 75 mM.Fig. 5b illustrates the plate numbers for K and NK, respectively, as a function of injection time and applied voltage. By comparing the sub-figures inFig. 5, we find that the SDS concentration is the most important condition, more so than the applied voltage or temperature (data not shown), for affecting the plate number of the sepa-ration. In comparison, the temperature effect is minimal. We believe that such a three-dimensional representation is useful for determining a range of the optimized conditions for CE separation.
3.3. Comparing MEKC and sweeping MEKC
Fig. 6depicts the analysis of K and NK by MEKC and sweeping MEKC methods. The concentrations of the ana-lytes K, NK, and K-D4were 50, 30, and 20 ppm, respectively
inFig. 6a. However, the sample concentration was diluted 100-fold used inFig. 6b. Under these conditions, K, NK, and K-D4had ca.∼760-, ∼540-, and ∼800-fold enhancements
in their detection sensitivities, respectively, relative to those obtained inFig. 6a.Table 1presents values for the range of linearity, coefficient of determination (r2), limit of detection (LOD), RSD, and the number of theoretical plates for K, NK,
and K-D4using the MEKC and sweeping MEKC methods;
in addition, we compare these values with those obtained when using the GC/MS method. The results indicate that the sweeping MEKC method provides better results than do the other methods for the separation of these analytes.
3.4. Separating and determining of ketamine and norketamine in suspect urine samples
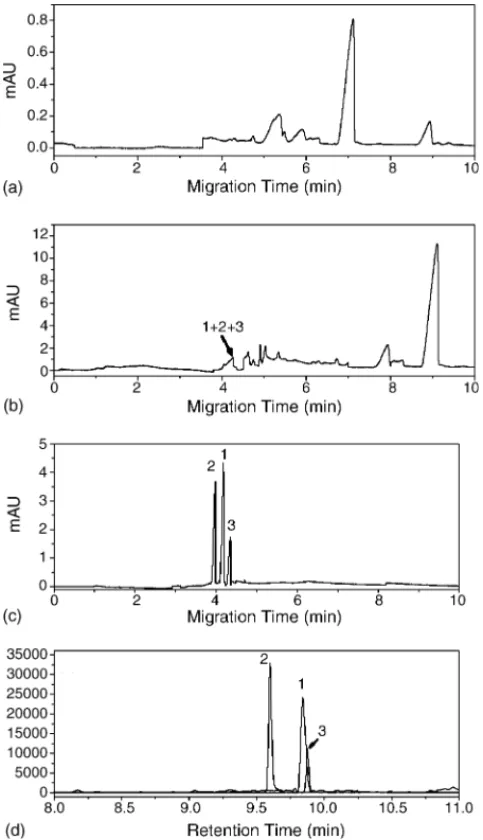
Finally, we have used the sweeping MEKC method com-bined with SPE, was compared it with the GC/MS method, to analyze real urine samples obtained from suspected K users. First, we attempted to analyze the urine sample with-out extraction or sweeping, but we could not obtain a signal for K or NK (Fig. 7a). Next, we applied the same conditions as those used to obtainFig. 7a, but with an injection time of 150 s; the resulting separation remained poor, but peaks for the target of analytes gradually appeared (Fig. 7b). Then, when we utilized SPE in conjunction with sweeping, we were able to clearly distinguish peaks for K, NK, and K-D4from
the urine sample within 5 min (Fig. 7c). The concentrations of K and NK are 61.2 and 55.4 ppb, respectively. We also compared these results with those obtained by GC/MS for
Fig. 6. Analysis of ketamine and norketamine by (a) MEKC and (b) sweeping MEKC methods. Sample concentrations: (a) 50, 30, and 20 ppm for K (peak 1), NK (peak 2), and K-D4(peak 3), respectively and (b) 500, 300, and 200 ppb for K (peak 1), NK (peak 2), and K-D4(peak 3), respectively. Other conditions are the same as those inFigs. 3 and 4.
Table 1
Values of the range of linearity, coefficient of determination (r2), limit of detection (LOD), RSD, and the number of theoretical plates for ketamine, norketamine, and ketamine-d4during separation by MEKC, sweeping/MEKC and GC/MS, respectively
Ketamine Norketamine Ketamine-d4
MEKC
Range of linearity (g/mL) 5–500 5–500 5–500
Coefficient of determination r2= 0.9921 r2= 0.9963 r2= 0.9938
LOD (S/N = 3) (g/mL) 1.1 1.2 1.9
RSD (%; n = 5)
(a) Migration time 3.12 4.74 3.87
(b) Peak area 4.22 3.85 4.66
Number of theoretical plates (N/m) 2.58× 10⁵ 2.45× 10⁵ 2.41× 10⁵
Sweeping MEKC
Range of linearity (ng/mL) 5–500 5–500 5–500
Coefficient of determination r2= 0.9957 r2= 0.9984 r2= 0.9961
LOD (S/N = 3) (ng/mL) 2.8 3.4 3.3
RSD (%; n = 5)
(a) Migration time 2.11 2.03 1.89
(b) Peak area 1.76 1.92 2.04
Number of theoretical plates (N/m) 3.48× 10⁵ 2.81× 10⁵ 3.18× 10⁵
GC/MS
Range of linearity (ng/mL) 10–1000 10–1000 10–1000
Coefficient of determination r2= 0.9992 r2= 0.9991 r2= 0.9993
LOD (S/N = 3) (ng/mL) 5.4 7.1 4.5
RSD (%; n = 5)
(a) Retention time 1.01 1.03 1.0
Fig. 7. Electropherograms and GC/MS traces for the analysis of a urine sample of a suspected ketamine user via (a) MEKC; (b) sweeping MEKC; (c) solid-phase extraction and sweeping MEKC; and (d) selective ion current profile measured using GC/MS methods. Conditions are the same as those inFigs. 3 and 4.
the same sample (Fig. 7d). Although the separation remained similarly as that inFig. 7c, the analysis time was almost twice that required for using the sweeping MEKC technique.
4. Conclusions
In this study, we have demonstrated successfully the use of on-line sample preconcentration for determining the pres-ence of K and NK by sweeping MEKC, which is an easy, rapid, and efficient technique. We have presented our results in a three-dimensional plot to provide a clear depiction of the
conditions that effect the optimal separation. Under the opti-mized separation parameters, the analysis times for K, NK, and K-D4were less than 5 min, which is much faster than
similar results obtained by GC/MS. The optimized parame-ters for the sweeping MEKC method were: running buffer, 25 mM citrate/phosphate (pH 2.6); applied voltage,−25 kV; temperature, 25◦C; SDS concentration, 75 mM. The limits of detection were 2.8, 3.4, and 3.3 ng/mL for K, NK, and K-D4,
respectively, and the enrichment factor for each compound fell within the range of 540–800. Accordingly, sweeping in conjunction with MEKC represents a good method that is complementary to GC/MS for use in clinical and forensic analyses.
Acknowledgements
This research was supported by grant (NSC 92-2113-M-009-031) from the National Science Council of Taiwan ROC. We thank the Forensic Science Center (Taiwan Command of the Army Force of Military Police) for donating the urine samples.
References
[1] K.L. Felser, D.J. Orban, Ann. Emerg. Med. 11 (1982) 673. [2] Y. Hijazi, M. Bolon, R. Boulieu, Clin. Chem. 47 (2001) 1713. [3] S.B. Bolze, R. Boulieu, Clin. Chem. 44 (1998) 560.
[4] A.S. Gross, A. Nicolay, A. Eschalier, J. Chromatogr. B 728 (1999) 107.
[5] M. Shimoyama, N. Shimoyama, A.L. Gorman, K.J. Elliott, C.E. Inturrisi, Pain 81 (1999) 85.
[6] S.-L. Chou, M.-H. Yang, Y.-C. Ling, Y.-S. Giang, J. Chromatogr. B 799 (2004) 37.
[7] S.F.H. Li, Capillary Electrophoresis—Principles, Practice and Appli-cations, Elsevier, Amsterdam, 1992.
[8] P.D. Grossman, J.C. Colburn (Eds.), Capillary Electrophoresis—Theory and Practice, Academic Press, San Diego, CA, 1992.
[9] F. Foret, L. Kriv´ankov´a, P. Bocek, Capillary Zone Electrophoresis, VCH, Weinheim, 1993.
[10] Z. El Rassi (Ed.), Electrophoresis 20 (1999) 2987.
[11] S. Terabe, K. Otsuka, K. Ichikawa, A. Tsuchiya, T. Ando, Anal. Chem. 56 (1984) 111.
[12] J.L. Beckers, P. Boˇcek, Electrophoresis 21 (2000) 2747. [13] P. Britz-McKibbin, S. Terabe, J. Chromatogr. A 1000 (2003) 917. [14] J.-B. Kim, S. Terabe, J. Pharm. Biomed. Anal. 30 (2003) 1625. [15] J.P. Quirino, S. Terabe, J. Chromatogr. A 781 (1997) 119. [16] J.P. Quirino, S. Terabe, Anal. Chem. 70 (1998) 149. [17] J.P. Quirino, S. Terabe, J. Chromatogr. A 798 (1998) 251. [18] J.P. Quirino, S. Terabe, Anal. Chem. 70 (1998) 1893. [19] J.P. Quirino, S. Terabe, Science 282 (1998) 465. [20] J.P. Quirino, S. Terabe, Anal. Chem. 71 (1999) 1638.
[21] J.P. Quirino, J.-B. Kim, S. Terabe, J. Chromatogr. A 965 (2002) 357.