Photorefractive Fe:LiNbO
3
crystal thin plates
for optical information processing
Shiuan Huei Lin, Mei Li Hsieh, and Ken Yuh Hsu
Institute of Electro-Optical Engineering, National Chiao Tung University, Hsin-Chu, Taiwan Tai Chiung Hsieh
Department of Electro-Physics, National Chiao Tung University, Hsin-Chu, Taiwan Sheuan-Perng Lin, Tung-Sheng Yeh, Long-Jang Hu, Chin-Hwa Lin, and Hong Chang Materials Research and Development Center, Chung Shan Institute of Science and Technology,
Lung-Tan, Taiwan
Received November 16, 1998; revised manuscript received March 22, 1999
The effects of the donor acceptor concentration ratio in iron-doped lithium niobate (Fe:LiNbO3) crystal plates on photorefractive response time and on grating diffraction efficiency are studied both theoretically and ex-perimentally. The results provide a useful guide for designing photorefractive plates for optical information-processing applications. Two devices for real-time image recognition have been demonstrated: a photore-fractive joint-transform correlator and a VanderLugt correlator. The former emphasizes fast response time, and the latter emphasizes high diffraction efficiency. By appropriate adjustment of the dopant concentration and the ratio of the donor acceptor levels, photorefractive Fe:LiNbO3crystals that facilitate specific
applica-tions have been designed and fabricated. Shift-invariant image correlations have been achieved. © 1999 Optical Society of America [S0740-3224(99)01307-7]
OCIS codes: 190.5330, 200.3050, 160.3730, 160.5320, 100.4550, 100.5010.
1. INTRODUCTION
Recently photorefractive LiNbO3crystals have been
stud-ied for such optical information-processing applications as optical interconnections, optical neural networks, and vol-ume holographic storage.1–5 The advantages of this ma-terial are that high-optical-quality crystal with larger di-ameters can be grown and that the photorefractive characteristics of the crystal can be modified by addition of various dopant impurities, adjustment of the atmo-sphere for the thermal annealing process, or both. Typi-cal photorefractive LiNbO3 crystals are cut into
thick-nesses of a few millimeters to ⬃1 cm, and the dopant concentrations of the iron impurities are in the range 0.01–0.05 mol. %. These thicknesses and dopant concen-trations provide suitable optical absorption for producing the photorefractive effect. At the same time they permit good transmission of optical information.6–8 Under mod-erate illumination intensities (watts per square centime-ter) the characteristic time for writing a hologram in a Fe:LiNbO3 crystal is of the order of minutes, quite long
compared with that of other photorefractive crystals such as Bi12SiO20(milliseconds) and BaTiO3(a few seconds).9,10
Staebler and co-workers demonstrated that transition-metal impurities, especially iron dopants, can enhance photorefractive sensitivity.11–14 High sensitivities were also observed in heavily reduced samples of the lightly doped LiNbO3crystals.15 However, in the range of
vis-ible light, iron dopants also increase the optical
absorp-tion coefficients of the crystals. As a result, obtaining enough transmission for the output detection required the dopant concentrations to be limited to a range of 0.01– 0.05 mol. % for samples a few millimeters thick. The response-time constant for these samples was in the range of minutes. Based on Yeh’s determination of the rate of photon absorption,16a theoretical limit for the re-sponse time of LiNbO3crystals can be estimated that is
much faster. This suggests that changing the dopant concentrations provides one way to improve the response speed of LiNbO3and to adjust the photorefractivity of the
material for the specific purpose of optical information processing.
In this paper we present a study of heavily iron-doped LiNbO3crystals. In particular, we focus on the effect of
dopant concentration on the diffraction efficiency and the recording-time constant of the holographic grating. To alleviate the problem of large optical absorption in these heavily doped materials (0.06–1.5 mol. %), we use x-cut crystals polished into thin plates. This special arrange-ment makes the crystals useful for optical information ap-plications that need thin dynamic holographic media. In what follows, theoretical analysis and optical experiments for thin Fe:LiNbO3 plates are described. The results
show that heavily doped impurities in Fe:LiNbO3crystals
induce weak diffraction efficiency and a fast temporal re-sponse. They also show that the doping concentration in Fe:LiNbO3crystal can be adjusted such that the grating
diffraction and the temporal characteristics of the thin crystal can be tailored for particular image-processing ap-plications. Two examples of optical image recognition with these crystal plates are experimentally demon-strated. In these two cases, two different methods of op-timizing either the temporal response or the diffraction efficiency of the crystal plates are discussed.
2. CHARACTERISTICS OF THE THIN
PHOTOREFRACTIVE CRYSTAL PLATES
It is well known that, in response to a distribution of light intensity, a refractive-index grating can be recorded in a photorefractive crystal. Based on the band transport model proposed by Kukhtarev17 and Kukhtarev et al.,18 this phenomenon can be explained as being due to three processes: photoexcitation, transport and retrapping of free carriers, and the linear electro-optic effect. When the crystal is illuminated by incident light, the photons are absorbed and photocarriers are generated from donor impurities. The photogenerated carriers are transported in the conduction band by diffusion and drift and recap-tured by the ionized impurities; thus a space-charge field distribution is created. Finally, a refractive-index grat-ing is induced in the crystal by the Pockels effect. Be-cause the photocarriers are generated from and retrapped by the impurities and defects, the empty traps NA (accep-tors) and the occupied traps ND(donors) are key param-eters for determining the photorefractivity of the crystal. From Kogelnik’s coupled-wave theory,19the intensity dif-fraction efficiencyand the response-time constant of a transmission photorefractive grating can be derived as
⫽ exp共⫺␣d兲sin2
冉
d 2cosn 3r effESC冊
, (1) where ␣ ⫽ s共ND⫺ NDi兲h, (2) ESC⫽ Re冉
iEd⫺ E0 1⫹ 共Ed/Eq兲 ⫹ i共E0/Eq兲 I1 I0冊
, (3) ⫽ NA sI0ND Ed⫹ E⫹ iE0 Ed⫹ Eq⫹ iE0 . (4)Equations (1)–(4) show that the diffraction efficiency and the time constant of the photorefractive gratings are complicated functions of donor and acceptor concentra-tions. From Eq. (1) it can be seen that there are two fac-tors that affect diffraction efficiency: the exponentially decaying term, which is due to the material absorption, and the square of a sinusoidal term, which relates to the photorefractivity of the crystal and is an increasing func-tion of the coupling constant (i.e., the argument of the sine function). Both the absorption coefficient and the coupling constant depend on the impurity concentration of the crystal. Equation (2) shows that the absorption co-efficient increases linearly as the donor concentration in-creases. Thus the optical transmission of the crystal de-creases exponentially as the dopant concentration
increases. On the other hand, in Eq. (3) the coupling con-stant is intertwined with the material properties and the incident conditions of the recording beams.
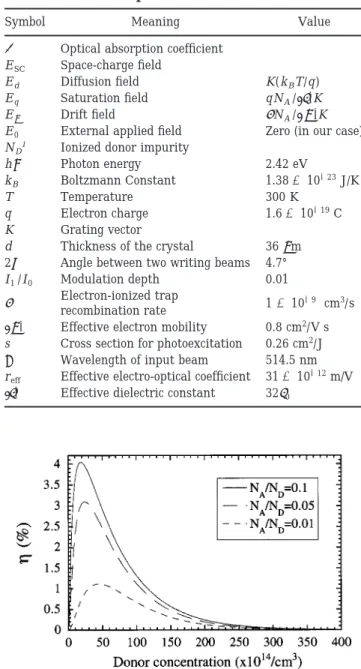
From Eqs. (1)–(4) and the parameters given in Table 1 the diffraction efficiency can be calculated as a function of the donor concentration. The result is shown in Fig. 1, with the ratio ⫽ NA/NDas a parameter. It can be seen that, for a given, the diffraction efficiency increases rap-idly to its maximum value when the donor concentration is increased. A further increase in donor concentration causes strong optical absorption and results in a decrease of diffraction efficiency. The figure also shows that the maximum value of the diffraction efficiency increases as the ratio increases, whereas the location of the maxi-mum occurs with a smaller donor concentration. This behavior is in agreement with other experimental results
Table 1. Parameters for the Computer Simulations
Symbol Meaning Value
␣ Optical absorption coefficient ESC Space-charge field
Ed Diffusion field K(kBT/q)
Eq Saturation field qNA/具⑀典K E Drift field ␥NA/具典K
E0 External applied field Zero (in our case) NDi Ionized donor impurity
h Photon energy 2.42 eV
kB Boltzmann Constant 1.38⫻ 10⫺23J/K
T Temperature 300 K
q Electron charge 1.6⫻ 10⫺19C K Grating vector
d Thickness of the crystal 36m 2 Angle between two writing beams 4.7° I1/I0 Modulation depth 0.01
␥ Electron-ionized traprecombination rate 1⫻ 10⫺9 cm3/s
具典 Effective electron mobility 0.8 cm2/V s s Cross section for photoexcitation 0.26 cm2/J
Wavelength of input beam 514.5 nm reff Effective electro-optical coefficient 31⫻ 10⫺12m/V
具⑀典 Effective dielectric constant 32⑀0
Fig. 1. Diffraction efficiency versus donor concentration for three ratios NA/ND(theoretical analysis).
in which the photorefractivity of a lightly doped Fe:LiNbO3 crystal was significantly improved when the
crystal was heavily reduced in an argon (or nitrogen) atmosphere.14,15 To optimize diffraction efficiency, a trade-off between the absorption and the photorefractiv-ity of the crystal should be made. This trade-off strongly depends on the thickness of the crystal plate.
It is also interesting to see how the dopant concentra-tion affects the time constant for recording gratings in the photorefractive crystal. Equation (4) shows that the in-trinsic photorefractive response time of the crystal is pro-portional to the ratio ⫽ NA/ND. As the ratio in-creases, the intrinsic response time inin-creases, which leads to an increase in the time constant of the crystal (i.e., the response speed decreases). By using Eq. (4) and the parameters given in Table 1 one can calculate the time constant for recording the photorefractive grating as a function of the dopant concentration for various ratios of . The result is shown in Fig. 2. It can be seen that, in all cases for different ratios of , the time constant de-creases monotonically as the donor concentration increases. The slope becomes smoother as the ratio decreases. When the donor concentration is larger than 2 ⫻ 1016/cm3, the time constant approaches the
funda-mental limit (⬃milliseconds) given by Yeh’s calculation.11 However, because of strong absorption, we need thin plates to provide enough light transmission.
In optical information-processing applications the dif-fraction efficiency and the response time of the photore-fractive crystal are both important factors. The speed of formation of the gratings determines the time required for updating the dynamic memories, and the diffraction efficiency of the grating determines the signal-to-noise ra-tio of the output signal. Figures 1 and 2 provide a useful guide for designing the crystal plate.
In what follows, we consider two different applications. The first is a VanderLugt correlator. For this applica-tion, first the matched filter is recorded and then the im-ages to be recognized are present in real time. The time constant is relevant only when the matched filter is being updated. On the other hand, a strong correlation peak can provide a large signal-to-noise ratio. Thus the dif-fraction efficiency is more important than the response time. For a given thickness of the crystal plate, in the
large-K regime (K Ⰷ kD) the donor concentration for maximizing the diffraction efficiency can be derived as
ND⫽ 1 dshC共1 ⫺ 兲tan ⫺1共C兲, ⬇ dsh共1 ⫺ 兲1 , C Ⰶ 1, (5) where C⫽ en 3I 1 sI0⑀Khcos reff,
and the maximum diffraction efficiency is given by 兵其max⫽ 共C兲2 1 ⫹ 共C兲2exp
冋
⫺ 1 C tan ⫺1共C兲册
(6) ⬀ 共C兲2, C Ⰶ 1.Expression (5) shows that the required concentration de-creases as the ratio or the thickness of the crystal plate increases if Ⰶ 1. In contrast, relation (6) shows that the maximum diffraction efficiency increases as the ratio increases if Ⰶ 1. Therefore a lightly doped crystal is good for the VanderLugt correlator application. We can enhance the diffraction efficiency by increasing the ratio of the crystal by a reduction reaction in the annealing pro-cess.
The second application is a joint-transform correlator. For this application the spatial filters are updated in real time. Thus the writing speed of the grating is as impor-tant as the diffraction efficiency. If the required mini-mum diffraction efficiency is given, then the required do-nor concentration can be derived. For weak diffraction efficiency (coupling constantⰆ1), the donor concentration is a solution of a transcendental equation given by
冋
ND 1 ⫹ C2共1 ⫺ 兲ND册
2 ⫻ exp关⫺共1 ⫺ 兲ND兴 ⫽min冋
1 C1共1 ⫺ 兲册
2 , (7) where ⫽ sdh, C1⫽ edI1 2I0具⑀典Kcos n3r eff, C2⫽ e2 具⑀典kBTK .The maximum updating speed of the reference image can be obtained by substitution of the solution of the tran-scendental equation into Eq. (4). Note that in Eq. (4) the time constant increases as the ratio NA/ND increases. To obtain a thin plate with fast response, it is necessary to keep the ratio NA/ND as small as possible. This will reduce the diffraction efficiency of the plate. Thus one should compromise between these two requirements by using the plots of Figs. 1 and 2.
Now we describe the experimental measurements of our thin crystal plates. To prepare a series of the crystal plates, we grew LiNbO3single crystals with Fe2O3doping
Fig. 2. Response-time constant versus donor concentration for three ratios NA/ND(theoretical analysis).
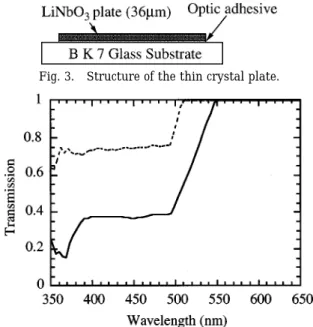
concentrations that varied from 0.06 to 1.5 mol. % by the Czochraski technique. The crystals were cut into thin x plates and then attached to an optical glass (BK 7) sub-strate. Finally they were polished to a thickness of⬃36 m. The structure of the thin plate is shown in Fig. 3. First we measured the transmission spectrum of these plates in the spectral range 350–650 nm. Typical trans-mission spectra of the 0.06- and 1.5-mol. % plates are shown in Fig. 4. Also, the absorption coefficient at 514.5 nm is measured as a function of the dopant concentration, as shown in Fig. 5. It can be seen that the absorption co-efficient is almost a linear function of the dopant concen-tration, in agreement with our theoretical analysis de-rived in Eq. (2). Note that an intrinsic absorption coefficient exists in undoped crystal that might be a result of crystal defects or impurities during crystal growth.
To measure the photorefractivity of different plates we constructed a typical four-wave mixing system (as shown in the inset of Fig. 6). Two extraordinarily polarized plane waves from an argon laser (with a wavelength of 514.5 nm) were incident symmetrically into the crystal plate such that the grating vector was parallel to the c axis. The intersection angle between the writing beams
was 4.7°. The total intensity of the writing beam was 1 W/cm2. An extraordinary plane wave from the same la-ser (with an intensity of⬃83 mW/cm2) was incident from
the opposite side of the plate to monitor the temporal be-havior of the first-order diffraction. As much as 3 orders of diffraction was observed. Figure 6 shows a typical curve of the temporal response of grating formation and decay for a crystal plate with a dopant concentration of 1.0 mol. %. It is estimated that the buildup time con-stant (which is defined as the slope of growth of the grat-ing amplitude obtained from the square root of the dif-fracted power) of the grating is ⬃28 ms and that the decay time is ⬃7.8 ms. By comparing these time con-stants with those of the conventional lightly doped Fe:LiNbO3 crystals (which have a long time constant of
dark storage and a slow temporal response in the range of minutes to hours), we see that heavy iron doping signifi-cantly improves the response speed of the crystal plate.
The relationship between the time constant for grating buildup and the dopant concentrations was measured and is shown in Fig. 7. The figure shows that the response time decreases with increasing dopant concentration. As the dopant concentration is increased to 1.5 mol. %, the time constant decreases to 12.5 ms. This value is close to the fundamental limit calculated from Yeh’s model. In-asmuch as our crystals were grown without any special annealing processing, the exact values of the ratio of
Fig. 3. Structure of the thin crystal plate.
Fig. 4. Transmission spectra of the 0.06-mol. % (dashed curve) and the 1.5-mol. % (solid curve) iron-doping LiNbO3plates.
Fig. 5. Experimental measurement of the absorption coeffi-cients of the crystal plates versus the iron-doping concentrations.
Fig. 6. Typical temporal behavior of grating formation and de-cay for the 1.0-mol. % iron-doped LiNbO3plate.
Fig. 7. Experimental measurement of the buildup time constant for grating formation versus the iron-doping concentrations for the crystal plates.
these plates were unknown. However, the experimental curve still shows a trend similar to that of the theoretical prediction. We also measured the diffraction efficiency as a function of the dopant concentration. The results are shown in Fig. 8. It can be seen that the diffraction efficiency increases rapidly as the dopant concentration increases, reaching a maximum near a concentration of 0.14 mol. %, and then decreases because of strong optical absorption. This trend is again in coincidence with our theoretical prediction.
Under our experimental conditions the time constant for the crystal plate with the maximum diffraction effi-ciency (i.e., the crystal plate with 0.14-mol. % iron-doping concentration) is 4.7 s. This rate is slow and is not suit-able for dynamic grating applications such as a joint transform correlator. Thus a trade-off between diffrac-tion efficiency and response speed has to be considered when we design a photorefractive crystal for optical pro-cessing applications. In what follows, we describe two optical correlators that utilize LiNbO3crystal plates.
3. REAL-TIME OPTICAL
INFORMATION-PROCESSING
APPLICATIONS
A. Joint-Transform Correlator
Figure 9 is a generic diagram of a photorefractive joint-transform correlator (PRJTC). Two input patterns, u1
and u2, are Fourier transformed and interfered to write a
refractive-index grating in the crystal plate. This index grating is read out by a plane wave, which is incident from the back side of the crystal plate. For the PRJTC we operated the thin plate in the Raman–Nath regime. To achieve this operation, we designed the intersection angle between the writing beams and the thickness of the crystal plate such that the hologram parameter Q⬍ 1. Thus the mth-order diffraction from the photorefractive grating is proportional to the mth-order Bessel function20:
Edm⫽ U3Jm
冉
2 cosRn1d
冊
, m⫽ ⫾ 1, ⫾ 2, ⫾ 3, . . . ,(8) where U3is the amplitude of the reading beam,Ris the incident angle of the reading beam, and n1 is the
refractive-index perturbation induced by the interference
pattern of the writing beams in the photorefractive crys-tal plate. Based on the photorefractive theory, n1 is
given by
n1⬃ U1*U2⫹ U1U2*, (9)
where U1 and U2 are the amplitudes of two writing
beams in the crystal plate, which are Fourier transforms of input images u1and u2, and*represents complex
con-jugation. Under the condition that the arguments of the Bessel functions are much smaller than 1, the first-order diffraction can be approximated as
Ed1⫽ U3J1
冉
2 cosR n1d冊
⬇ U3 2 cosR n1d ⬀ U3共U1*U2⫹ U1U2*兲. (10)If the U3is a plane wave (i.e., u3 is a point source),
rela-tion (10) represents a spatial filter. The Fourier trans-form of the⫹1-order diffraction gives the output
C共x⬘, y⬘兲 ⫽ u1共x, y兲 丢 u2共x, y兲, (11)
where丢represents the correlation operation. The above analysis shows that a PRJTC system can be achieved by use of a thin photorefractive crystal plate in the Raman– Nath diffraction regime (i.e., Q ⬍ 1). There are several advantages to this operation. First, the planar grating characteristics of the Raman–Nath diffraction make this system shift invariant. Thus the correlation signal will not be degraded when either the reference or the target image is shifted in the input plane. Second, there is no requirement for Bragg matching of the reading beam, which can be incident into the planar hologram from an
Fig. 8. Experimental measurement of diffraction efficiency ver-sus the iron-doping concentrations for the crystal plates.
Fig. 9. Generic diagram of a photorefractive correlator: FL’s, Fourier lens; other abbreviations defined in text.
Fig. 10. Schematic diagram of the PRJTC: FT, Fourier trans-form; JT, joint transtrans-form; B.S., beam splitter; other abbrevia-tions defined in text.
arbitrary angle. If the response speed of the crystal plate is fast enough, both the reference and the input images can be updated in real time.
A schematic diagram of our PRJTC system is shown as Fig. 10. A collimated extraordinarily polarized beam from an argon laser with a wavelength of 514.5 nm and a total intensity of 1 W/cm2was split into two beams. Each
beam passed through a liquid crystal television (LCTV) that carried the input images. LCTV1 showed the refer-ence object, and LCTV2 showed the target object. These two images were Fourier transformed and intersected in the crystal. The interference pattern induced a refractive-index grating in a Fe:LiNbO3 crystal plate.
The focal length of the Fourier lens was 40 cm, and the width of the LCTV was 3 cm. Therefore the minimum in-tersection angle should be larger than 4.5°, such that two LCTV’s can be separated. Under this condition, achiev-ing a Raman–Nath regime (Q ⬍ 1) requires that the crystal plate be thinner than 36m. The correlation sig-nal was read out by a plane wave from a He–Ne laser at a wavelength of 632.8 nm with an intensity of 82 mW/cm2.
Because the background scattering noise of the crystal plate observed in our experiments was⬃82 W/cm2, the
minimum required diffraction efficiency had to be larger than 1⫻ 10⫺2, such that the correlation signals could be detected well. From Eq. (7), the concentration of the do-nors had to be smaller than 1⫻ 1016/cm3. At this
dop-ing level the response time of the crystal plate was⬃250 ms. Therefore the updating rate of the target object, the reference objects, or both is limited to approximately four frames per second. In our experiments we picked up the crystal plate with a 0.59-mol. % iron-doping concentra-tion. The plate’s response time is⬃352 ms.
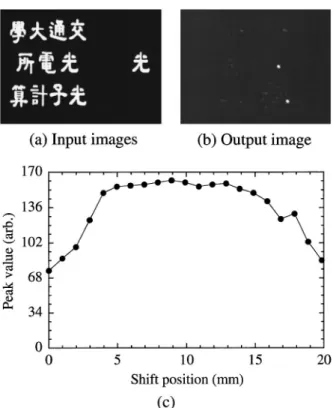
Figures 11(a) and 11(b) are photographs of the experi-mental results. Figure 11(a) shows the input images to the PRJTC. At the left is the input image, which consists of three rows of Chinese words. At the right is the refer-ence image, which is a Chinese character. Figure 11(b) shows the correlation output. The two correlation peaks demonstrate the shift-invariant property of this PRJTC system. In addition, if the reference object was updated at the rate of 1 frame/s, the correlation output followed the change at the same speed. The result is shown in Fig. 11(c), in which the upper trace represents the se-quence of the input image that is generated by chopping of the input beam with an electronic shutter and the lower trace is the correlation peak detected by a photode-tector. It can be seen that the system is capable of dy-namic filter updating.
B. VanderLugt Correlator
Figure 9 can also be used as a generic diagram of a pho-torefractive VanderLugt correlator (PRVLC). In this case, u2is a point source and u1is the object wave. Thus
U2is a plane wave and U1is the Fourier-transform
spec-trum of u1. U1and U2interfere to record a holographic
matched filter in the crystal plate. PRVLC operation needs a 4-F optical system, where F is a focal length. To reduce the space of the optical system we chose a focal length of 10 cm for the Fourier-transform lens in our ex-periments. Because the width of our LCTV is 3 cm, sepa-rating the input image from the reference requires that
the intersection angle between the plane wave and the center of the reference image be at least 8.55°. Thus,
Q ⬎ 1, the 36m crystal plate could not be operated in
the Raman–Nath regime, and the system should be ana-lyzed by use of the coupled-wave theory of the thick holo-gram. According to Kogelnik’s analysis for a transmis-sion volume phase grating, the diffracted amplitude is given by19 Ed⫽ ⫺iU3exp
冉
⫺ ␣d 2 ⫹ i ⌬ 2 d冊
⫻ n1/cosR 关r2⫹ 共⌬/2兲2兴1/2sin再
rd冋
1⫹冉
⌬ 2r冊
2册
1/2冎
, (12) with r⫽ cosR n1, ⌬ ⫽ ⫺4n sin⌬ ⫺ 4n 2 sin2 cos ⌬,where U3 is the amplitude of the reading beam,⌬ is a
dephasing term that is due to the Bragg mismatch of the reading beam, is the Bragg angle, R is the incident angle of the reading beam, and n1is the refractive-index
perturbation induced by the interference pattern of the writing beams in the photorefractive crystal plate. The Bragg mismatch comes from a small-angle deviation⌬, which is induced by a small shift of the target object in the u3plane, and a wavelength deviation⌬, which is
in-duced by a reading beam with a different wavelength. Note that the dephasing factor⌬ could be eliminated if the reading beam were incident at the Bragg angle for the different wavelength. Taking u3as the complex
conjuga-tion and with 180° rotaconjuga-tion of the target object, the Fou-rier transform of the diffracted wave can be derived to be Fig. 11. (a), (b) Input images and correlation output for our PRJTC. (c) Temporal response of updating the reference image in the PRJTC.
C共x⬘, y⬘兲 ⬀ u1共x, y兲丢u3共x, y兲sinc兵rd关1 ⫹ 共⌬/2r兲2兴1/2其.
(13) Relation (13) shows that image correlation can be achieved by use of the PRVLC structure. Note that the sinc function serves as a window function if the incident angle of U3does not match the Bragg condition. In other
words, the correlation peak degrades when the target ob-ject is shifted in the u3 plane. The sinc function thus
serves as a limit on the viewing range of the target object. If the range of shift invariance is defined as a shift in the target object such that the autocorrelation peak decays to the first zero of the sinc function, then the range⌬ can be derived as ⌬ ⫽ sinfr
冋
冉
rd冊
2 ⫺ 1册
1/2 , (14)where f is the focal length of the Fourier-transform lens. Note that this range is inversely proportional to the
thick-ness of the crystal plate when rd Ⰶ. Thus, the thinner the crystal plate, the larger the range for shift invariance. However, as the thickness of the crystal plate decreases, the diffraction efficiency of the photorefractive grating also decreases. Of course, as shown in Eq. (14), one can increase the shift-invariant range by increasing the focal length of the lens. However, doing so will cause the sys-tem to occupy a larger space. Hence, to maintain rigid space and also obtain a large shift-invariant range of the system for a given crystal thickness it is necessary to op-timize the diffraction efficiency by proper adjustment of the dopant concentration.
A schematic diagram of our PRVLC system is shown in Fig. 12. A collimated extraordinarily polarized beam from an argon laser at a wavelength of 514.5 nm with a total intensity of 1 W/cm2was split into two beams: The
beam that passed through LCTV1 was used for carrying the reference images, and the other beam was used as the reference wave. The two beams interfered at an intersec-tion angle of 10° upon the Fe:LiNbO3 crystal plate, and
the matched filter was recorded. The matched filter was read out by the target objects shown on LCTV2, which was illuminated by the same laser with an intensity of 100 mW/cm2. The correlation output was detected by a
CCD camera in the Fourier plane of lens L3. The focal length of all the Fourier lenses was 10 cm, the screen size of the LCTV was 3 cm, and the thickness of the crystal plate was 36 m. As we explained for the PRJTC, to overcome the scattering noise of the crystal plate the minimum diffraction efficiency of the grating must be larger than 4 ⫻ 10⫺2. From expression (5), the concen-tration of the donors should be close to 2⫻ 1014/cm3. Using these parameters, we estimated the response time of the crystal plate to be⬃2 s. Therefore the maximum updating rate of the matched filter was approximately one reference object in every 2 s. In our experiments we used a crystal plate with a 0.15-mol. % iron-doping con-centration. The response time of our plate was⬃4 s.
Figures 13(a) and 13(b) are photographs of the experi-mental results. Figure 13(a) shows the input images to the PRVLC. At the left is the input image and at the right is the reference image. Figure 13(b) shows the cor-relation output. The two correlation peaks demonstrate the shift-invariant property of this PRVLC system. In addition, if the target object is shifted in the u3plane, the
correlation peak follows. The value of the correlation peak as a function of the shifted distance is shown in Fig. 13(c). The system is thus capable of shift-invariant cor-relation.
4. CONCLUSION
We have performed both a theoretical analysis and ex-perimental studies of photorefractive characteristics by adjusting the donor acceptor concentration ratio in iron-doped lithium niobate (Fe:LiNbO3) crystal plates. Our
results show that the impurity doping concentration af-fects the grating diffraction efficiency and the temporal characteristics of the thin crystal plates. They provide a useful guide for designing photorefractive crystals for various optical information-processing applications. We have experimentally demonstrated two examples of
real-Fig. 12. Schematic diagram of our four-wave-mixing PRVLC. FT, Fourier transform; B.S., beam splitter; other abbreviations defined in text.
Fig. 13. (a), (b) Input images and correlation output for our PRVLC. (c) Correlation peak versus shift-invariant distance for our PRVLC.
time optical image recognition by considering two differ-ent methods of optimization. In the PRJTC system, the fast response speed is necessary for achieving image rec-ognition with the capability of dynamic filter updating. Thus a fast response is emphasized. According to our analysis, the time constant and the diffraction efficiency of the crystals both decrease when donor concentrations are at high dopant levels. Hence the speed of operation is limited by the detectable diffraction efficiency of the output signal under the scattering noise. The updating speed in our system is⬃4 frames/s. On the other hand, in the PRVLC system, high diffraction efficiency is more important for achieving a compact correlator system with a large shift-invariant range. Thus the crystal plate is optimized to yield maximum diffraction efficiency. Ac-cording to our analysis, the decrease in diffraction effi-ciency results mainly from optical absorption. Hence a lightly doped crystal is good for VanderLugt correlator ap-plication. One can enhance the diffraction efficiency by increasing the ratio NA/ND through a crystal reducing process. Our analysis for LiNbO3crystal is valid in
gen-eral; thus the results can be applied to other photorefrac-tive crystals.
ACKNOWLEDGMENT
Support for this research by the National Science Council of the Republic of China under contract NSC88-2215-E009-008 is gratefully acknowledged.
REFERENCES
1. D. Psaltis, D. Brady, and K. Wagner, ‘‘Adaptive optical net-works using photorefractive crystals,’’ Appl. Opt. 27, 1752– 1759 (1988).
2. F. H. Mok, ‘‘Angle-multiplexed storage of 5000 holograms in lithium niobate,’’ Opt. Lett. 18, 915–917 (1993).
3. K. Y. Hsu, S. H. Lin, and T. C. Hsieh, ‘‘Photorefractive memories for real-time image processing,’’ Opt. Mem. Neu-ral Netw. 4, 277–285 (1995).
4. K. Itoh, O. Matoba, and Y. Ichioka, ‘‘ODINN in LiN: opti-cal dynamic interconnections for neural networks in lithium niobate,’’ in Photorefractive Fiber and Crystal
De-vices: Materials, Optical Properties, and Applications, F. T. Yu, ed., Proc. SPIE 2529, 71–81 (1995).
5. C. Sun, R. Tsou, J. Chang, and M. Chang, ‘‘Real-time pho-torefractive interferometer for dynamic phase perturbation by self-interference in LiNbO3,’’ Appl. Opt. 36, 3581–3585
(1997).
6. H. Kurz, ‘‘Lithium niobate as a material for holographic in-formation storage,’’ Philips Tech. Rev. 37(5/6), 109–120 (1977).
7. H. Vormann, G. Weber, S. Kapphan, and E. Kratzig, ‘‘Hy-drogen as origin of thermal fixing in LiNbO3:Fe,’’ Solid
State Commun. 40, 543–545 (1981).
8. S. Yin, F. Zhao, H. Zhou, M. Wen, J. Zhang, and F. T. S. Yu, ‘‘Wavelength-multiplexed holographic construction using a Ce:Fe:LiNbO3crystal with a tunable visible-light diode la-ser,’’ Opt. Commun. 101, 317–321 (1993).
9. M. Peltier and F. Micheron, ‘‘Volume hologram recording and charge transfer process in Bi12SiO20and Bi12GeO20,’’ J.
Appl. Phys. 48, 3683–3690 (1977).
10. Y. Fainman, E. Klancnik, and S. H. Lee, ‘‘Optimal coherent image amplification by two-wave coupling in photorefrac-tive BaTiO3,’’ Opt. Eng. (Bellingham) 25, 228–234 (1986).
11. J. J. Amodei, W. Philips, and D. S. Staebler, ‘‘Improved electro-optic materials and fixing techniques for holo-graphic recording,’’ Appl. Opt. 11, 390–396 (1972). 12. D. L. Staebler, W. Burke, W. Philips, and J. J. Amodei,
‘‘Multiple storage and erasure of fixing holograms in Fe-doped LiNbO3,’’ Appl. Phys. Lett. 26, 182–184 (1975). 13. W. Phillips, J. J. Amodei, and D. S. Staebler, ‘‘Optical and
holographic storage properties of transition metal doped lithium niobate,’’ RCA Rev. 33, 95–109 (1972).
14. P. Gunter and J. P. Huignard, Photorefractive Materials and Their Applications (Springer-Verlag, New York, 1988), Chap. 6.
15. R. Orlowski and E. Kratzig, ‘‘Holographic method for the determination of photo-induced electron and hole transport in electro-optic crystal,’’ Solid State Commun. 27, 1351– 1354 (1978).
16. P. Yeh, ‘‘Fundamental limit of the speed of the photorefrac-tive effect and its impact on device applications and mate-rial research,’’ Appl. Opt. 26, 602–605 (1987).
17. N. V. Kukhtarev, ‘‘Kinetics of hologram recording and era-sure in electro-optic crystal,’’ Sov. Tech. Phys. Lett. 2, 438– 440 (1976).
18. N. V. Kukhtarev, V. B. Markov, S. G. Odulov, M. S. Soskin, and V. L. Vinetskii, ‘‘Holographic storage in electro-optic crystals. I. Steady state,’’ Ferroelectrics 22, 949–960 (1979).
19. H. Kogelnik, ‘‘Coupled wave theory for thick hologram grat-ings,’’ Bell Syst. Tech. J. 48, 2909–2947 (1969).
20. For example, see P. Yeh, Introduction to Photorefractive Nonlinear Optics (Wiley, New York, 1993), Chap. 2.