Journal of Oceanography Vol. 49, pp. 193 to 210. 1993
Low Frequency Current Variability on the Shelf Break
Northeast of Taiwan
T. Y. TANG and Y. J. YANG
Institute of Oceanography, National Taiwan University, P. O. Box 23-13, Taipei, Taiwan, ROC (Received 26 February 1992; in revised form 3 August 1992; accepted I September 1992) A buoy-mounted Acoustic Doppler C u r r e n t Profiler was deployed on the shelf break offtbe northeast coast of Taiwan to monitor c u r r e n t variations in the upper ocean. The acquired data show that the flow in the upper water column was initially southwest and then abruptly turned northwest. This a b r u p t change occurred in mid-October, starting from the surface layer and then gradually extending to the deeper layer. In contrast with this flow, the flow in the lower water column was southwest over the entire record, but its amplitude was reduced after the middle of October. The abrupt change of c u r r e n t from southwest to northwest is related to the intrusion of Kuroshio. Examination of two CTD casts showed the salinity of the upper ocean to have increased after the directional shift in mid- October, f u r t h e r indicating the Kuroshio intrusion. The sea level data at Keelung provided other evidence for the intrusion of Kuroshio. The sea level descended as the intrusion Occurred and kept the low value until the end of the record. The northwest flow, which carried the water away from the n o r t h e r n coast of Taiwan, is responsible for this descent. Although the intrusion of Kuroshio was mainly confined to the upper ocean, it did have influence on the whole water column. Examination of the wind record at Pengchiayu showed that the time of Kuroshio intrusion was not coincident with the intensification of the northeasterly monsoon. The local wind and the c u r r e n t at 20 m were incoherent. Both the variation of Kuroshio c u r r e n t and the fluctuation of Kuroshio path may be responsible for the variation of the local current. Since the intrusion of Kuroshio has a weak relationship w i t h local wind variation, it appears to be induced by non-local factors.
1. Introduction
As the North Equatorial Current (NEC) reaches the western boundary of the Pacific, the eastern coast of the Philippines, it separates into two branches. One is the Mindanao Current which flows to the south along the Mindanao coast; the other is Kuroshio, which flows to the north along the eastern coasts of the Philippines and Taiwan. After leaving Taiwan, the main stream of Kuroshio flows northeast along the isobath of the continental shelf. Its branches sometimes intrude into the marginal East China Sea. This intrusion of Kuroshio has significant impact on the local fishery, navigation, and water circulation on the continental shelf. Due to insufficient data, the characteristics of the intrusion of Kuroshio have long remained unknown. For example, we do not know whether the intrusion is confined to the surface layer, or if it extends over the whole water column. We also do not know whether the intrusion is induced by local or non-local forces. In our study, we attempt to provide answers to some o f the questions by studying
194 T. Y. Tang and Y. J. Yang
the current variation over the water column and its relation with the local wind.
In order to monitor the variation of current in the upper ocean on the edge of the continental shelf off northeastern Taiwan, an upward-looking Acoustic Doppler Current Profiler (ADCP) was deployed for 2 months during the northeasterly monsoon season. The ADCP data, combined with the wind record at the nearby island of Pengchiayu, were analyzed and discussed, with particular attention to indications of the intrusion of Kuroshio.
Subsequent sections of this paper are as follows: Section 2 gives a review of the studies on the intrusion of Kuroshio and the b~ickground of local ocean circulation. Earlier applications of buoy-mounted ADCP are briefly described. The description of measurements is stated in Section 3. The abrupt change of current direction from southwest to northwest is noted and referred as the intrusion of Kuroshio. Section 4 discusses the additional evidence related with the intrusion of Kuroshio by using CTD measurement and sea level record. The relations between the current and local wind variations are examined and discussed. A summary is provided in Section 5.
2. Background
The Kuroshio is a branch of the NEC and flows northward. According to Nitani (1972), the Kuroshio begins to the east of northern Luzon. Wyrtki (1961) called the Kuroshio at the east of Taiwan the Taiwan Current. Flowing eastward south of Japan, the Kuroshio is usually called the Kuroshio Extension. The Kuroshio carries a large quantity of mass and heat from the subtropics
35"N
30"N
25"N
120~ 125"E 130~
Fig. 1. Mean surface flow pattern in the East China Sea attained by averaging 32 years' (1953-1984) GEE observations (after Qiu and Imasato, 1990).
Low Frequency Current Variability on the Shelf Break Northeast of Taiwan 195 to the middle latitudes. It has a huge impact upon the global weather and ocean heat balance, and has a notable influence on the circulation pattern, navigation, and fisheries of the marginal seas. As the Kuroshio current (Taiwan Current) leaves Taiwan, its main stream flows northeastward following the isobaths to conserve barotropic potential vorticity. Due to overrun, the Kuroshio water sometimes spills over the continental shelf north of Taiwan. This overrun feature, intrusion of Kuroshio, has been found by examining hydrographic data and surface current measurements. For example, a persistent upwelling of cold water to the northeast of Taiwan has been documented by Uda and Kishi (1974), and Fan (1980). Chern and Wang (1989) found that this cold water originates from the subsurface Kuroshio water. By examining current data collected on the shelf north ofTaiwan, Chern and Wang (1990) claimed that the intrusion of the subsurface Kuroshio water begins at the shelf bre.ak northeast of Taiwan and in the depth range of 100-200 m. Direct current measurements on the shelf break, made by Chuang and Wu ( 1991) and H.-W. Lee (personal communication), showed no intrusion in the lower layer (deeper than 200 m). Their observed current (the lower water column) is dominated by either a southwest or southeast flow. By using GEK observation, the surface intrusion of Kuroshio has been detected. Figure 1, after Qiu and Imasato (1990), shows the mean surface flow pattern in the East China Sea by averaging GEK observations from 1953 to 1984. The Kuroshio intrudes onto the continental shelf immediately after passing noah of Taiwan. Nitani (1972) and Chu (1976) found that this surface intrusion varies seasonally, at a maximum in the fall when the Kuroshio moves shoreward and minimum in the summer when it moves seaward. By using the seasonal average of 25 years of (1953-1977) GEK data, Sun (1987) demonstrated this seasonal variation of the surface axial
129o E "-MEAN I ~'4 i/:.i ,,,,, ..
IiT/ ~
i
177.i:7,4;" ; - ~
__-,u,,,,
p D . . . . Wl Nr R EFig. 2. The axial paths of Kuroshio in the spring, summer, fall, winter, and mean (after Sun, 1987). The paths were defined based on 25 years of GEK data.
196 T. Y. Tang and Y, J. Yang
path of Kuroshio (Fig. 2). The numerical model study by Chao (I 990) found that the Kuroshio moves shoreward when the northerly wind prevails and seaward when the southerly wind prevails. In addition to this seasonal variation, Qiu et al. (1990) and Masaki et al. (1986) found that the path of Kuroshio exhibits fluctuations at higher than seasonal frequency.
Owing to heavy fishing activity on the shelf northeast of Taiwan, no current measurement in the upper ocean has ever been made to monitor the intrusion of Kuroshio. The recently developed upward-looking buoy-mounted ADCP is usually moored 250 m under the water to measure the current above it, thus avoiding potential damage from fishing activities. So, we conducted an ADCP mooring experiment on the shelf break northeast of Taiwan to monitor the variation of current and the intrusion of Kuroshio.
The use of ADCP is not new. The first measurement was reported by Pettigrew and Irish (1983). The sequence of applications.includes Schott (1986) in the Florida Current, Schott and Johns (1987) in the Somali Current, Johns (1988) in the Gulf Stream, and Weisberg and Hayes (1993) in the Pacific Equatorial Undercurrent. According to laboratory testing (Pettigrew et al.,
1986), the ADCP has better precision than the traditional currentmeters such as VACM and VMCM. McPhaden et al. (1991) showed that the current data collected from a downward looking ADCP and a VMCM are nearly identical.
3. Description of the Measurements
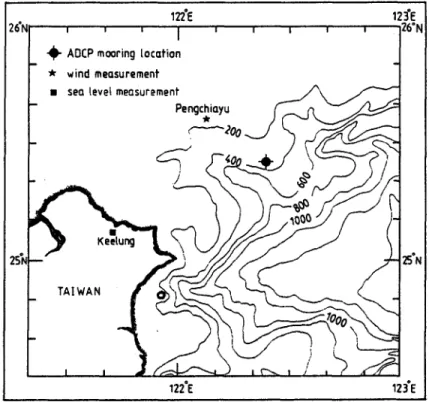
Figure 3 shows the location of mooring (25025 ' N, 122024 ' E) and the surrounding bathy-
26~ m seo level
m
e
a
s
u
e
r
m
e
P
n
t
e
n
g
a
c
h
y
u
i
|T
A
W
I
A
N
~
122~ 123E I~~ 123"E ' ' ' I ' ' ' ' ' 1 2 6 ~ i~t- ADCP mooring location * wind measurement
Fig. 3. The location ofm0oring and the surrounding bathymetric chart. The asterisk and square mark the locations of Pengchiayu, where the wind measurements were taken, and Keelung, where the sea level record was obtained, respectively.
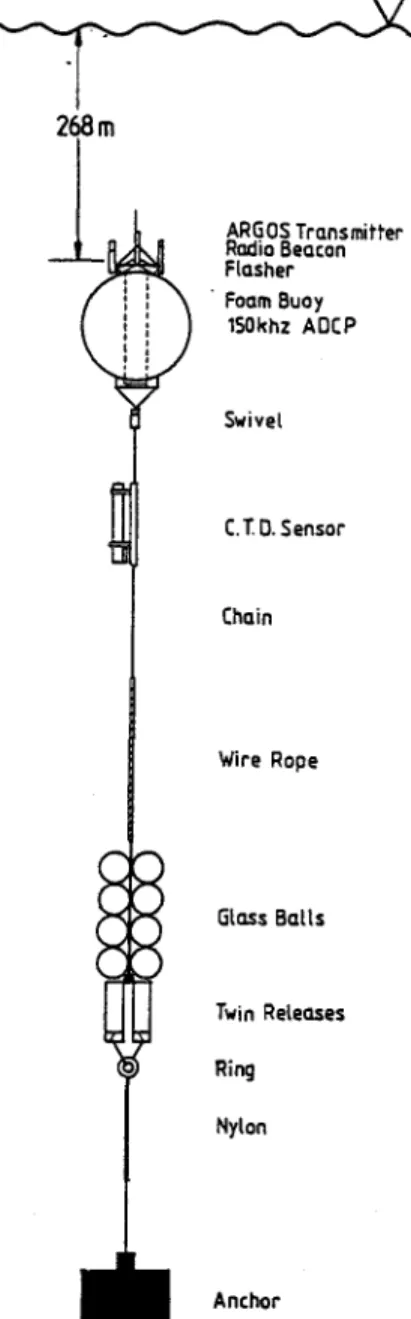
Low Frequency Current Variability on the Shelf Break Northeast of Taiwan 197 metric chart. The local water depth is 386 m. The duration of deployment was 59 days, September 28 to November 27 of 1991. The diagram o f ADCP mooring is shown in Fig. 4. A 150 kHz ADCP with 20 ~ transducer was mounted on a 45" syntactic foam buoy, which has 800 lbs buoyancy. A flasher, a radio beacon, and an Argos transmitter were mounted at the top o f the buoy to aid in retrieving the mooring. The equilibrium depth o f the moored ADCP was around 270 m. A self- recording SEACAT CTD was mounted 2.5 m beneath the buoy and twin acoustic releases were parallel mounted 60 m from the bottom. The resultant platform was fairly steady. The tilt of the
2~m ARGOS Transmitter Radio Beacon Flasher Foam Buoy 1SOkhz AOCP Swivel C.TD.Sensor Chain Wire Rope Glass BaLLs Twin Releases Ring Nylon Anchor
198 T. Y . T a n g a n d Y. J. Y a n g
B
~J z I!
I I I I I I I I I I ( ~ s l ~ ) a ~ s v m==, 0 z z 0 0 {,J 00 .,( F.~ 0 t i t J I I I 0 L'" ,=4 [ i i T~'~I l i I | I I I I I I t ! ( ~ s l ~ ) a ~ s 0 {P '.,.4 4 , ) 9 .4.=, . . c : " ' L~Low Frequency Current Variability on the Shelf Break Northeast o f Taiwan 199 buoy was generally less than 2 degrees. The CTD pressure sensor data showed that the maximum vertical excursion was around 10 m, but most o f the excursions were less than 3 m.
The nominal bin size for a 150 kHz ADCP with 20 ~ transducer is 8.68 m beginning at a range o f 1 bin from the transducer. The local sound speed average over the whole water column was 1508 m see -~ , so the actual bin size was 8.9 m. The near surface bin data is contaminated by side- lobe reflection from the water surface. The nominal contaminated depth is D(1 - cos0) where D is the transducer depth and 0 is the transducer beam angle. With D = 270 m and 0 -- 20 ~ the contaminated depth in this application was 16 m. Using the housing orientation determined by a fluxgate compass and its tilt sensor, the instrument calculated Cartesian velocity components. The Cartesian velocity components were then corrected for magnetic deviation and sound speed at the transducer. Finally, the data were linearly interpolated and the vertical profile resampled at fixed 10 m intervals.
Figures 5(a) and (b) show the representative time series for the east component velocity (U) and north component velocity (V), respectively. The half hour sampled time series and its 36 hours low-pass filtered time series arc given at depths o f 20 m, 70 m, 120 m, 170 m, and 220 m. The low-pass filtered time series is obtained by using a truncated Fourier transform to remove fluctuations shorter than 36 hours from the original time series. Except for some short events, a westward flow was persistent from the beginning o f the record to the end, over the whole water column. Comparing the low-pass filtered time series at 20 m and 220 m, the U shows different variations between the upper and lower water column, especially after October. For example, the U w a s decelerated for 2 weeks at 20 m after October but it remained near constant at 220 m. In contrast with U~ V abruptly reversed its direction from south to north at the middle o f October. The reversal started in the surface layer and then gradually extended to the deeper layer. Although the Vin the lower layer continued flowing southward after the middle o f October, its amplitude was reduced. Corresponding to the abrupt change shown in V at the middle o f October, the
U (CM/SEC) - 8 0 - 8 0 - 4 0 - 2 0 0 2 0 4 0 8 0 8 0 0 1 . . , I , , , I , , , I . , , I , , . I , , , I , . . I , , . I ', I
5o.
i!
//
i i r.T:150
~
i ', : , o o ,,!i,
2 5 0 ~ v (cM/szc)o-oo ,,,,-~~ :4o., r ao,, ?,, ,zo., 4,0,, .6,o, , ,,~
5 0 1oo S-
~=15o
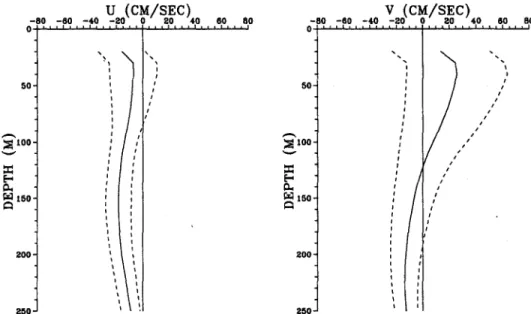
2 0 0 25(] I I I i I i / i i i i i ,, tFig. 6. The vertical distribution of mean and standard deviation of U(left panel) and V(right panel). The solid line is the mean and the dashed line is standard deviation.
200 T. Y. Tang and Y. J. Yang
(a)
u
~ D
E A S T W E S T 0 0 ~,~, loo - loo~
150. J 150 ,,.-.., ' E 200. i t 200~,o
~
~
~
30 5 : 10 15 20 25 30 Sep Oct 1991 5 10 15 20 25 Nov(b)
50 ~ 1 0 0 150 2 0 0 250 oQ
, l l , , ~ J S e pv
~ l
I
N O R T H S O U T H p l r , , 10 t0
, p l l l r l * ' l l l l l l l ~ ' l ~ t5 20 25 30 0et 1991 i 5 10 15 20 N o v all 25 .50 9 100 9 150 . ~ 9 200 250Fig. 7. (a) The east component velocity isotachs as a function o f depth and time. The contour interval is 30 cm sec -I. The shaded area indicates eastward velocity. (b) The north component velocity isotachs as a function o f depth and time. The contour interval is 30 cm sec -l, The shaded area indicates northward velocity.
Low Frequency Current Variability on the Shelf Break Northeast of Taiwan 201
westward current also reduced its amplitude, but regained its strength 2 weeks later. The low frequency variation of V is similar between the upper and lower portions of the water column. The high frequency fluctuations in both U and Vare dominated by a semi-diurnal tide. The mean and the standard deviations of low-pass filtered time series U and V at each depth are shown in Fig. 6. The Uhas near constant mean value over the whole water column, while the Vhas positive mean value in the upper water column and negative mean value in the lower water column. The zero crossing is at around 120 m, The standard deviations decrease with depth for both U and V. The variance of V in the upper water column is much larger than the variance of U.
Figures 7(a) and (b) show the.isotachs as a function of depth and time for low-pass filtered U and/I, respectively. Except for some short events, the value of U is negative (westward flow). The vertical shear in the U field is smaller than in the V field. The feature of the directional change in Vfrom south to north, is shown even more clearly here. It begins initially in the surface layer and then gradually extends down to greater depths. After the end of October, the zero crossing is generally located at around 170 m. The time series of transport per unit width, which is calculated by linearly vertical integration of low-pass filtered velocity from 20 m to 250 m, is shown in Fig. 8. Each stick indicates the amplitude and direction of transport. The transport is to the southwest initially and then turns to the northwest. Although the surface V turned northward in mid-October, the transport did not have a northward component until the subsurface
V also turned north, near the end of October.
The spectra for Uand Vas a function of depth and frequency are shown in Figs. 9(a) and (b), respectively. The spectra were calculated from demeaned, 10% cosine-tapered, and zero- argument time series using a fast Fourier transform (over an argumented record length of 1500 hours). Smoothing was performed by convolving a uniform spectral window, 9 fundamental frequency bands in width. The fundamental frequency and bandwidth were 0.00067 and 0.006 cph, respectively. The resulting degree of freedom is 17. The low frequency variance of Vis much larger than U. It reduces rapidly with depth. This low frequency variation is generated by the
VOLUME TRANSPORT PER UNIT WIDTH
t 5 0 r t O 0 t 5 0 L 2: -5o - 1 0 0 - 1 5 0 ' ' ' " ' 3 0 5 t 0 1 5 2 0 2 5 3 0 5 1 0 1 5 2 0 2 5 S e p O c t N o v 199t
Fig. 8. The stick diagram oftransport per unit width. The transport is calculated by linear integration of low-pass filtered velocity. Each stick indicates the amplitude and direction of transport.
202 T. Y. Tang and Y..L Yang
DEPTH (M)
o ~ ~ ~ Ch > o(I~I) H.I.a.';[(I
DEPTH (M)
J 1 % ~ } J ~ ~ I J ] I , i I I ~ ~ I ~ ~ I . ~ % - I I I I l I I I I I I I I I I I I I I I I 0 ( ~ ) Iq~aaa d o F . . r ca 0 o ~ r d ~aO(a)
Low Frequency Current Variability on the Shelf Break Northeast of Taiwan 203
C O H E R E N C E B E T W E E N U AT 2 0 M & ALL O T H E R D E P T H S ~,, 1oo t" eu 13o 000 PERIOD (HOURS) 3~176 , . 1 0 0 , 3 0 0 . " '1-- ~ e.co + ' - : o - 50 9 ,., , , ~ , ~ , l , , ~ l , ~ , , ~ , 1 , + , , 1 ~ , [ , , , , I 300 0.003'3 0.0067 0.0~+ 0.0133 0.3167 0.I~. 3+0~33 0.0287 FREquENcY (C.P.}I.) 100 150 200 PERIOD (HOURS) 390 100 I00 75 80 ,~I 43 38 ,,,,l,+++l~,,,l,+~,l,,,,l,,,,l++,,l+~,+l~ o
-o3
0.0033 0.0007 0.01 0,0130 0.0107 O.02 010233 00~O? FREQUENCY C.P.I1.)(b)
COHERENCE BETWEEN V AT 20M & ALL OTHER DEPTHS~
100 150 PERIOD (HOURS) 3O0 100 I00 70 00 SO 40 38 0 , l l ] , , , , l + l , , l + , , , l l , , , i , l , + l + + , , l + , , , I , I+,-
j
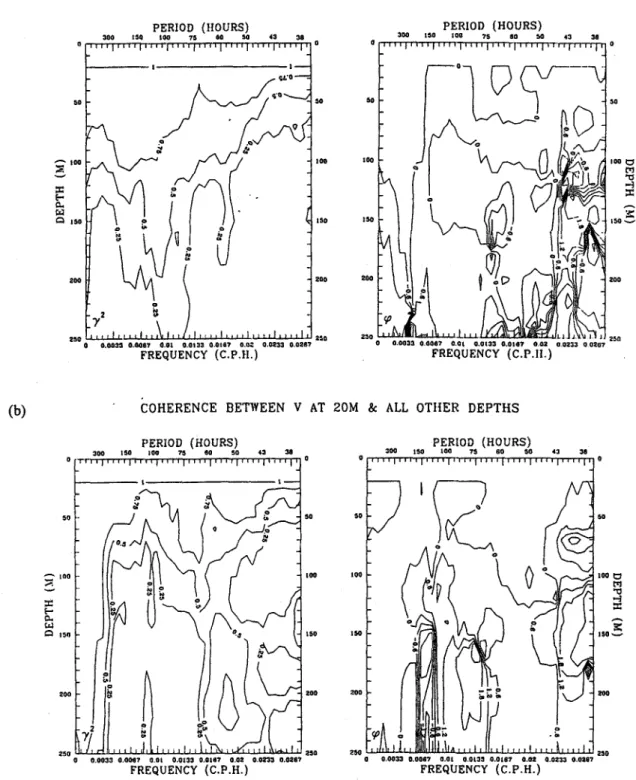
, ~ t" 200 0.0030 0.000? O.Ol 0.0133 0.0167 0+02 0.02'33 0,0287 FREQUENCY (C.P.H.) FREQUENCY (C.P.H.) I00 160 000 PERIOD (HOURS) ~00 100 I00 75 6O 50 43 30 O ~ , ~ ' l ' + ' l l ' ' ' ' l ' , , ' I , , l ' t , , I , l , + + , l , ~ , , I I 0 20O ZOO 0.0023 0.00417 O.Ol 0,0103 0.0187 0.02 0+0~33 O.O~8'r/Fig. 10. (a) The coherence square, 3;, (left panel) and the phase, #, (right panel) between Uat 20 m and at all other depths as a function of depth and frequency, The contour interval are 0.25 and 0.6 radian for coherence square and phase, respectively. The 90% significance level is 0.27. (b) The coherence square, ~ , (left panel) and the phase, #, (right panel) between V at 20 m and at all other depths as a function of depth and frequency. The contour interval are 0.25 and 0.6 radian for coherence square and phase, respectively. The 90% significance level is 0.27.
1 0 6
T. Y. Tang and Y. J. Yang
intrusion of Kuroshio which is confined to the upper ocean. The influence o f this intrusion is primarily on the local north component velocity. The most energetic fluctuation o f U is seen in the frequency band of 3 - 4 day. Figures 10(a) and (b) show the coherence square and phase between the current at 20 m and at all other depths as a function of frequency and depth for Uand
V,
respectively. The Uat 20 m is generally incoherent with the Uin the lower water column except on the frequency band of 3-4 day. In this frequency band, there is no phase difference over the whole water column. The Vis coherent and in phase in the low frequency part. The effect of the intrusion o f Kuroshio on the local cui'rent is over the whole water column. It reversed the Vfrom south to north in the upper layer and reduced the amplitude of southward flow in the lower layer.V A R I A N C E D E N S I T Y S P E C T R A OF WIND 1 0 s 9 0 z E A 1 0 4 ~ I 0 = ' ~ _ . ~ to t O P E R I O D ( H O U R S ) 9 1 0 ' t O ' tO | . . . i . . . i , , ' . . . i 1 0 "4 1 0 "~ t 0 ..a t O - t FREQUENCY (C.P.H.) 1 0 ' 9 1 0 ' , 1 0 e 'I0 I0 I0 ,,.? eL 10 %-, t.~ 0 ~U t r.n m l0 .PERIOD (.HOURS) 1 0 * 1 0 " 1 0 " 1 0 N O R T H C O M P O N E N T 1 0 .-4 1 0 - , 1 0 4 1 0 "~ FREQUENCY (C.P.H0 204 1 0 * 1 0 s 1 0 t 10
Fig. 1 I. The variance density spectra o f the wind velocity at Pengchiayu. The upper and lower panels are for the east and north component velocity o f wind, respectively.
Low Frequency Current Variability on the Shelf Break Northeast o f Taiwan 205
4 . D i s c u s s i o n
The abrupt change of current from the southwest to northwest in the upper ocean is the most distinguishing feature in these data. According to previous studies (Chao, 1990; Nitani, 1972; Sun, 1987), this feature may be related with either the intrusion of Kuroshio or the intensification of the northeasterly monsoon. The northeasterly monsoon will induce an Ekman transport to the northwest; the intrusion of Kuroshio will accelerate the current to the north. The wind measurements at Pengchiayu, 40 km northwest of the mooring's site (Fig. 3), are examined here. These data, collected every three hours, were provided by the Central Weather Bureau of the Republic of China. Figure 11 shows the density spectra of wind velocity. The data length is 5 months, from July to November of 1991. The spectra were calculated by using the similar method as mentioned before. The fundamental frequency, bandwidth, and resulting degree of freedom were 0.00027, 0.0024 cph, and 17, respectively. The spectrum has distinguished peaks centered on the 4-day and daily periods in the north component and 5-day, 3-day, and daily periods in the east component. The north component of wind velocity is slightly larger than the east component in the low frequency domain.
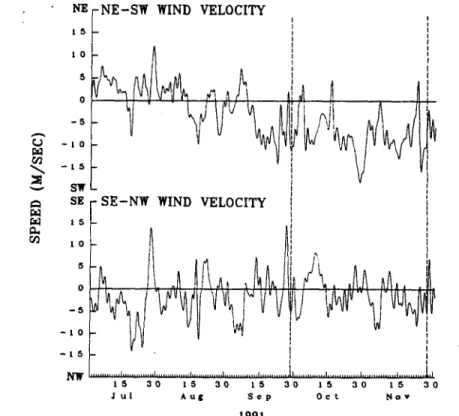
Since the northeasterly monsoon is prevailed in this area, the wind was rotated clockwisely by 45 ~ to easily examine the intensification of monsoon. This rotated and 36 hours low-pass filtered wind velocity time series is shown in Fig. 12. The northeasterly monsoon intensified
L~ :m
0..,
NEr-NE-SW WIND VELOCITY
t 5 t 0 5 0 - 5 - 1 0 - t 5 SW SE t 5 t O 5 0 - 5 - t 0 - t 5 N ~ 1 . SE-NW WIND VELOCITY !
. .A I
l a,
i J A A.A . .... , ... , ... , ... , ... h ... , ... 1.,
1 5 3 0 1 5 3 0 1 5 3 0 1 5 3 0 1 5 3 0 J u l A u f f S e p O c t N o v
1991
Fig. 12. The 36 hours low-pass wind velocity time series. The wind velocity has been rotated clockwise. Its NE-SW component is shown in the upper panel and its SE-NW component is shown in the lower panel. The two dashed lines indicate the duration of the ADCP mooring deployment.
206 T. Y. Tang and Y. J. Yang
COHERENCE SQUARE BETWEEN WIND & CURRENT AT 20M
S E - N W & U AT 2 0 M
L.o,O,:
, ,,o.PEm~ (H~
h., . . . . t . . . 10 . . . 0.8. 0.6" 0.4' o.0 . . . ., 9 .', ~ .,-i . . . tO "4 lO~ 1 0 " C.P 1~ "? . H ) FREQUENCY 1.0 0.8 0.6 0.4 0.2 0.0 N E - S W & U AT 2 0 M .PERIOD (.HOURS) 1 0 9 1 0 " 1 0 " tO 1.0 i . . . i . . . s .. . . i .. . . 0,0 1 O.O 0.2 7 2 0.0 . . . 1 0 ..4 1 0 4 1 0 . 4 F~EQUENCY(C.P:~.'i
1.0 ,0.8 0.0 ,0.4 ,0.2 0.0 S E - N W & V A T 2 0 M .PERIOD (HOURS) l 0 4 t 0 " 1 0 ' 1 0 | . 0 h . , , , , , I H H , , ' ' I . . . J .. . . 0 . 8 0 . 6 0 . 4 ~ - - _ ~ 0.2 ' - " 2 . . . . 0 & 0 ' ' T ~ ' ' t t[ . . . ' . . . ' . . . l0 ..4 l 0 -s 10 4 0 " FREQUENCY (C.P.II~.) 1.0 0.8 0.8 0.4 0.4 0 . 2 0 . 2 0.0 NE-SW & V AT 20M PERIOD (HOURS) 1 0 ' 1 0 " 1 0 ' 1 0 1 . 0 h . a l e i e I . . . i . . . i . . . 0 . 8 0 . 6 0 ' 0 1 0 . 4 1.0 ,0.8 '0.6 ,0.4 0.2 0.0Fig. 13. The coherence square, y2, between the current at 20 m and the wind measurement at Pengchiayu. The upper two panels show the coherence square between the U at 20 m and SE-NW wind ;velocity (left) and NE-SW wind velocity (right), respectively. The lower two panels show the coherence square between the Vat 20 m and SE-NW wind velocity (left) and NE-SW wind velocity (right), respectively. The 90% significance level is given by dashed line.
Low Frequency Current Variability on the Shelf Break Northeast of Taiwan 207
around the middle o f September, one month earlier than the current changes. After it built up, the monsoon generally maintained its strength until the end o f record. At the middle o f October, the wind record shows that the northeasterly wind did undergo a relaxation/intensification event. This event may have an impact on the current, but it could not be a major force to reverse the V from south to north. Specially, the event was short and northeasterly wind was relaxed, not intensified, when the current changed direction. The monsoon regained its strength 10 days later, while the northward current persisted until the end o f record. This weak relation between the abrupt change o f current in the upiaer ocean and the variations o f the monsoon indicates that the monsoonal wind is not responsible for the observed current reversal.
Figure 13 shows the coherence square between the wind velocity at Pengchiayu and the current velocity at 20 m. A high coherence is found between the wind and the current in the frequency band of 3-4 day. Since thedurrent in this frequency band is coherent and in phase, the deeper current shall be also coherent with the wind. This result is generally in agreement with the conclusion o f Chuang and Wu (1991). The 2--4 day energetic barotropic flow is in conj unction with the frontal passages on the edge of the East China Sea. Except in the above frequency bands, the coherence square is generally low.The effect of local wind on the current appears to be minor. Perhaps a non-local factor, e.g. an intrusion o f Kuroshio, is more important than the local winds. Since the Kuroshio water is more saline than the East China Sea water, the intrusion o f Kuroshio should increase the salinity of local water. By examining the vertical salinity profiles before and aRer the intrusion, the evidence o f Kuroshio intrusion can be checked. Figure 14 shows the salinity and temperature vertical profiles from two CTD casts, done before and after the ADCP mooring deployments. On the later cast, the salinity did increase significantly in the upper water column. This result offered evidence for the intrusion of Kuroshio. The lower water
34.0 3 5 . 0 0 i t 50 too 150 2 0 0 50" SALINITY (PSU) 34.5 i t l I I ' I I I I ~ f ioo, 150. 2 0 0 - 250 2 5 0 T E M P E R A T U R E (~ IO L5 2 0 2 5 3 0 0 I I I I I I I I I I I I I I I I I I i 1
/
/
Fig. 14. The vertical profiles of salinity (left panel) and temperature (right panel). The dashed and solid lines indicate the profiles which were measured before and after deployment of ADCP mooring, respectively.
208 T. Y. Tang and Y. J. Yang
temperature in the upper layer in the later cast may be related with the lower air temperature in the November than in the September.
The sea level at Keelung was examined. Figure 15 shows a near 2-year, from January, 1990 to November, 1991, sea level record at Kcelung. The mean and the effect o f atmospheric pressure were removed from the original record. The data was sampled by three hours interval and filtered out the fluctuations which frequencies are higher than 0.028 cph (36 hours). A distinct annual cycle was displayed. The sea level rose in summertime and descended in autumn. In 1991, the sea level descended in mid-Octol~er, which is consistent with the time o f the intrusion o f Kuroshio. In order to examine the relationship between sea level and the intrusion, we reversed the sign o f sea level variation and then compared with the vertically integrated V. The result is shown in Fig. 16. Both time series have been filtered to remove high frequency (period shorter than 36 hours) fluctuations and then.n0rmalized by their standard deviations. The consistency between the integrated V and sea level variation with reversed sign was found. The southward
4 0 3 0 2 0 1 0 0 - 1 0 - 2 0 - 3 0 - 4 0 SEA LEVEL (CM) F e b A p r J u n A u g O c t D e c F e b A p t J u n A u g O c t 1 9 9 0 1 9 9 1
Fig. 15. The sea level variation at Keelung. The time series is demeaned and 36 hours low-pass filtered.
- - VERTICALLY INTEGRATED V
. . . SEA LEVEL VARIATION WITH REVERSAL SIGN
3 ~ 2 - 1 - 0 - 1 " - 2 - ii ,, ," ".. ," ' '" ': [ . . . . I . . . I . . . . I . . . S e p O c t N o v 1991
Fig. 16. A comparison between the vertically integrated V and the sea level variation with reversed sign. Both time series have been normalized by their standard deviation and superimposed by using a linear least squares fit. The solid and dashed lines indicate the vertically integrated/,'and sea level variation with reversal sign, respectively.
Low Frequency Current Variability on the Shelf Break Northeast of Taiwan 209
integrated V, before the intrusion, piled the water up on the northern coast offTaiwan while the northward integrated V, after the intrusion, carried the water away. This result provided addi- tional evidence for the intrusion of Kuroshio. More current measurements are definitely required to study the relation between their seasonal variations.
Chern and Wang (1990) suggested that the intrusion o f Kuroshio occurs mainly at a subsurface depth range of 100-200 m to explain the existence o f subsurface Kuroshio water on the shelf. The present study does not agree with their findings. Our measurements showed that the intrusion o f Kuroshio occurs" in the surface layer and varies with time. The current data measured by Chuang and Wu (199 !) and H.-W. Lee (personal communication) also showed that the current in the lower layer on the shelf break northeast o f Taiwan is dominated either by a southwest or a southeast flow. There is no direct evidence to show that the Kuroshio subsurface intrudes at the shelf break. The me.chanism that brings the subsurface Kuroshio water onto the shelf at the north o f Taiwan remains unknown.
5. Summary
In the present study, we deployed an upward-looking ADCP mounted on a 45" syntactic foam buoy to monitor the ocean current in the upper 250 m water column on the shelf break off the northeast coat o f Taiwan. The total duration of deployment was 59 days, from September 28 to November 27 o f 1991. ,The acquired raw data was linearly interpolated and its vertical profile re~ampled at fixed 10 m intervals. Attention was drawn to low frequency variations (period longer than 36 hours). The north component of velocity has greater low frequency variance than the east component.'The most distinguished variation in the data is an abrupt change o f upper ocean current from the southwest to the northwest. This abrupt change, occurring in mid- October, is apparently related to the intrusion of Kuroshio. As the Kuroshio moved shoreward the depth of the northward flow was increased. The current in the lower water column was southwest over the entire record. The CTD measurement and sea level record provided additional evidences for the intrusion. After the intrusion, the salinity in the upper ocean increased and the sea level at Keelung descended. A consistency between the vertically integrated north compo- nent velocity and sea level variation was found. The local wind record at Pengchiayu relates weakly with both the local current variation and the intrusion o f Kuroshio. Apparently the intrusion of Kuroshio is not directly triggered by the local wind. The non-local factors, e.g. large scale wind variation, should be considered for such intrusion.
Acknowledgements
This work is supported by the National Science Council of the Republic of China under grant NCS 81-0209-M-002A-08. We would like to express our cordial thanks to Dr. R. H. Weisberg and Mr. J. Donovan for providing invaluable technical support with the mooring installation and deployment. The assistance of the captain and crew of the R/V Ocean Research I is gratefully appreciated. The manuscript benefitted bY the invaluable comments from the rev.iewers. The wind data and sea level data were provided by the Central Weather Bureau. We would also like to thank Mr. S. M. Yang and W. T. Lue for assisting us in the data retrieval.
References
Chao, S.-Y. (1990): Circulation o f East China Sea, a numerical study..1. Oceanogr. Soc. Japan, 46, 273-295. Chem, C.-S. and J. Wang ( 1989): On the water mass at northern offshore area ofTaiwan. Acta Oceanogr. Taiwan.,
210 T. Y. Tang and Y. J. Yang
Chem, C.-S. and J. Wang (1990): On the Kuroshio branch current north ofTaiwan. Acta Oceanogr. Taiwan., 25, 55-64.
Chu, T.-Y. (1976): Study of the Kuroshio current between Taiwan and Ishigakijima. Acta Oceanogr. Taiwan., 6, 1- 24.
Chuang, W.-S. and C.-K. W u (I 99 I): Slope-current fluctuation Northeast of Taiwan, Winter 1990. J. Oceanogr. Soc. Japan, 47, 185-I 93.
Fan, K.-L. (1980): O n upwelling off northeastern shore ofTaiwan. Acta Oceanogr. Taiwan., II, 105-I 17. Johns, W. E. (1988): Near-surface current measurements in the Gulf Stream using an upward-looking acoustic
Doppler current profiler. J. Arm. Ocean Tech., 5, 602--613.
Masaki, T., K. Kawatate, W. Koterayama, T. Subara and H. Mitsuyasu (1986): Moored instrument observations in the Kuroshio South of Kyushu. J. Oceanogr. Soc. Japan, 42, 201-21 I.
McPhaden, M. J., H. B. Milburm, A. I. Nakamura and A. J. Shepard (1991): P R O T E U S : Profile telemetry of upper ocean currents. Sea Technology, February 1991, 10-19.
Nitani, H. (1972): Beginning of the Kuroshio. p. 129-163. In Kuroshio, Its PhysicalAspects, ed. by H. Stommel and K. Yoshida, University of Tokyo Press."
Pettigrew, N. R. and J. D. Irish 0983): A n evaluation a bottom-mounted Doppler acoustic profiling current meter. Proceedings of Oceans' 83, Sept., 1983.
Pettigrew, N. R., R. C. Beardsley and J. D. Irish (1986): Field evaluations of a bottom-mounted acoustic Doppler profiler and conventional current meter moorings. Proceedings of the IEEE third working conference on current measurement, January 22-24, 1986, Airlie VA., 153-162.
Qiu, B. and N. Imasato (1990): A numerical study on the formation of the Kuroshio Counter Current and the Kuroshio Branch Current in the east China Sea. Con't. ShelfRes., 10, 165-184.
Qiu, B., T. Toda and N. Imasat'o (I 990): O n the Kuroshio front fluctuations in the East China Sea using satellite and in situ observational data. J'. Geophys. Res., 95, 1819 I-18204.
Schott, F. (I 986): Medium-range vertical acoustic Doppler current profiling from submerged buoys. Deep-Sea Res., 33, 1279-1292.
Schott, F. and W. Johns (1987): Half-year-long measurements with a buoy-mounted acoustic Doppler current profiler in the Somali Current. J. Geophys. Res., 92, 5169-5176.
Sun, X. (1987): Analysis of the surface path of the Kuroshio in the East China Sea. p. 1-14. In Essays el'the In- vestigation ofKuroshio, ed. by X. Sun, Ocean Press, Beijing (in Chinese with English abstract).
Uda, M. and A. Kishi (1974): Cyclonic cold eddies along the edge of the Kuroshio current in relation to the genesis and passage of cyclones, I. Waters north of Taiwan. The Kuroshio IlL Proceedings of the 3rd Symposium, Bangkok, Thailand, 1972, 199-218.
Weisberg, R. H. and S. P. Hayes (1993): Upper ocean variability on the equator in the west-central Pacific at 170~ J. Geophys. Res. (in press).
Wyrtki, K. (I 961): Physical oceanography of the southeast Asia waters. Scientific results o f marine investigations of the South China Sea and Gulf of Thailand. 1959-1961. Naga Report, 2, 195 pp.