Design of Parallel Processors for Fast Extraction of Peaks From Multi-Dimensional Data Array
7
0
0
全文
(2) To simplify the input interface in designing the hardware for the first part, we should stick with the specification of using only a single channel (or stream) of data rather than using three channels to input the three consecutive data (of the same row) in parallel. The use of three consecutive data in a row to obtain the 1 x 3 local maximum in each processing cycle, on the other hand, can be viewed as having a specific data value used for three consecutive cycles. Partially taking the idea from the previous work [12], we have a broadcast provision added to the pipeline of one register and two processing elements (or PEs in short) to form the design of the first part hardware. The circuit of this sub-module, called the Row Sequence Comparator (RSC), is shown in Figure 1.. Figure 2.. The circuit diagram of the PE. To compose the 3 x 3 peak-detector, we need the second part of the module, which gathers and compares the three extracted maxima from the same column of three consecutive rows to obtain their maximum. The circuit design of this sub-module is quite straightforward that two delay buffers are used to acquire the two data from the first two rows to join the one in the third row for comparison to obtain their maximum. Thus this sub-module is called the 3-Row Delayed Comparator (3-RDC) and its circuit is shown in Figure 3. Data Input Delay. Output. Delay Reg. PE. PE. ( Nx+1 ). Output. Figure 3. The block configuration of the Row Sequence Comparator (RSC). With the row sequence comparator in operation, the maximum value of any three consecutive data can be always extracted in three comparison cycles. In the first cycle, the first data enters the register. It enters the first PE at the beginning of the 2nd cycle, when the 2nd data is broadcast and also enters the first PE via the bus. The two data are then compared in this first PE to have their maximum value turned out by the end of the 2nd cycle. In a similar way, this larger value enters the second PE at the beginning of the 3rd cycle, when the 3rd data enters the second PE via the broadcast bus. The 3rd data and the larger value of the first two data are then compared in the second PE to have their maximum value turned out by the end of the 3rd cycle. The value thus present at the output of this RSC module is indeed the maximum value we are seeking for the 3-data sequence. The circuit design of the PE mentioned above is quite simple. The PE in our design consists of a basic comparator with two input registers and a multiplexer controlled by the comparator output to select the larger value out of the two registers. The circuit diagram is shown in Figure 2. clock. 3.. PROCESSOR MODULE FOR 2-D PIPELINED PEAK DETECTION. >From the description and reasoning of the previous section, it is easy to see that the concatenation of the two sub-modules RSC and 3-RDC can form a pipelined maximum-value extractor (or called max. filter) of the 3x3 window. The complete configuration diagram of this processor module is shown in Figure 4. As designed in the previous section, the data input for this pipelined maximum filter is in raster-scan sequence. That is, the data are input one by one, from one side (either left or right) of the row toward the other end; and after finishing one row, take the next row from its starting side again, and so on. Data Input Reg. Input A. Delay. PE. PE. PE. PE. Output. ( Nx ). Delay. Reg. R2. The configuration of the 3-Row Delayed Comparator (3-RDC). Note that the labels “Nx” and “Nx+1” denote the length of delay buffers in Figure 3, where Nx is the number of data in a row of our data array. With two PEs compare the three gathered data of the same column, the maximum value of the 3 x 1 column segment is thus obtained.. Reg. R1. Input B. PE. ( Nx ). Data Input. Figure 1.. PE. Comp.. >= <. MUX. ( Nx+1 ). Output. Figure 4.. The block configuration of the 3x3 Max filter. In Figure 4, again, Nx stands for the number of data in a row of our 2-D (two-dimensional) data array. Note that the last input data of a given row is consecutive to the first data of the next row according to our raster-scan sequence. To 2.
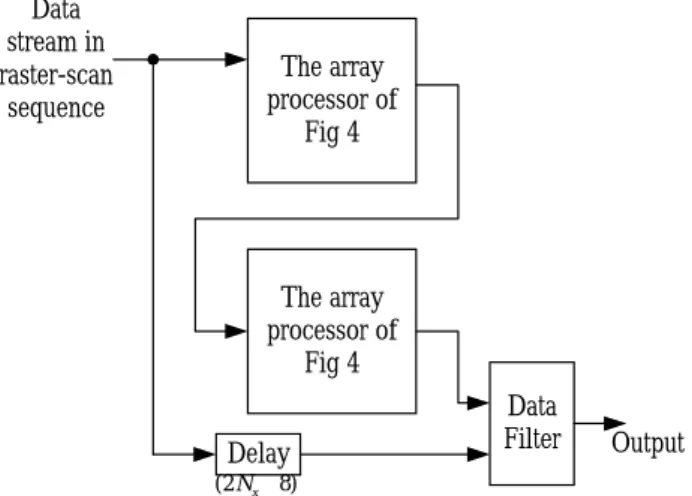
(3) avoid errors from the 3 x 3 max filter, we may neglect the maximum values on the margin of the output data array by replacing them with zero values. (Without losing the generality of our design, we assume that all the input data are non-negative integer. Thus 0 is the minimum of our input data). With the 3 x 3 max filter in operation, we may get the maximum value of any 3 x 3 window output in the sequence as that of the input data. Yet the goal of our design is to detect the local peaks out of the data array. The maximum value output corresponding to a specific position only tells us the maximum for the 3 x 3 window centered at that specific position. For the local peak we want to extract here is the data which is also the maximum over the 3 x 3 window centered at its position. Thus a simple scheme to identify the local peaks is to compare the max filter output with the corresponding original input data. If they are not equal, then this original data is not a maximum in the local window. The original data is a peak only when the two values are equal. To distinguish the peaks from others, we choose not to attach any extra label bit(s) to the original data. We adopt a simple policy that sets all the non-peak data to zero while keeps the peak data unchanged. (Zero can not be any peak value, since zero is the minimum value of the data array. The peak and non-peak data cannot be mixed.) Thus in designing our pipelined peak detector, we use a 3 x 3 max filter (module of Figure 4) and a delay buffer of proper length, connecting their output to a Data Filter which compares their values to filter out the non-peak data for the final output. The configuration diagram of this 3 x 3 peak detector design is shown in Figure 5. Data stream in raster-scan sequence. The array processor of Fig 4 Delay. Data Filter. Max { Max3x3(x, y) | for x = i –1 to i+1, and y = j –1 to j+1} = Max { S (x, y) | for x = i –2 to i +2, and y = j –2 to j +2 } where Max is the maximum function, S(x, y) is the data value at the position (x, y), and Max3x3(x, y) = Max{ S(x, y) | for x =i –1 to i +1, and y = j –1 to j +1 } Data stream in raster-scan sequence. The array processor of Fig 4. The array processor of Fig 4 Delay. Data Filter. Output. ( 2 N x + 8). Figure 6.. The configuration of the pipelined 5 x 5 peak detector. As in the previous design, we use a delay buffer and a data filter in addition to the max filter module. The two-dimensional data are input in the raster-scanned sequence, exactly the same as the previous case. The data filter is to compare the original input data with the output of the 5 x 5 max filter to get the final output of either peak data or non-peak zeros. While the delay buffer is to control the timing of the original input data to meet with the corresponding output of the 5 x 5 max filter.. Output. ( N x + 4). Figure 5.. detector, which extracts peaks from the 5 x 5 window. Based on the processor modules we have developed so far, such a pipelined peak detector of the 5 x 5 window-size can be easily configured as shown in Figure 6. The 5x5 detector design is based on the mathematical principle that:. The configuration of the pipelined 3 x 3 peak detector. Note that the delay buffer provides a delay of Nx+4 units (operation cycles) which is to match the timing of the original input data with the maximum value output of the 3 x 3 window centered at the same position. The design of the data filter is simple that it is a comparator in essence. When the comparison result indicates “equal”, one operand is copied to the output. Otherwise, the output of the data filter is set to 0. In many practical applications, we may want to detect only the peaks above certain threshold. For this requirement, we need only add another comparator to compare the previous output further with the given threshold. If it is no less than the threshold value, then keep the same peak value output; else, set the final output to 0. And this completes the array processor design for the pipelined 3 x 3 peak detector. For some applications, it may be desirable to have peak. 4.. PIPELINED PEAK DETECTION FOR EXTENDED DIMENSION. For some cases of applications, we are dealing with data arrays of high-dimension (higher than 2). Naturally, the peak detection will be more complicated. To perform the peak detection for a three-dimensional data array, for example, the local peak value must be extracted out of a 3x3x3 volume (or space). To design an array processor for the pipelined extraction of the above 3x3x3 case, the processor module of the 3 x 3 max filter (shown in Figure 4) can be used as a basic construction block again. With the understanding of data input being in raster-scan sequence, the 3-D array data are input in the same way as previously mentioned for its first plane (or 2-D data plane). And after the input of the first layer, the data of the 2nd plane will be input following the same scanning sequence. A similar flow follows for the 3rd plane, and so on. 3.
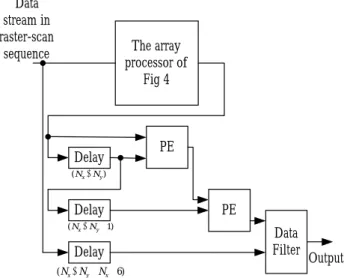
(4) The output of the 3 x 3 max filter follows the sequence of its data input as well, except for a few steps of time delay. That is, the maximum values (over the 3 x 3 window) will come out one by one, row by row, and then one plane followed by its next plane. In order to extract the maximum value of the 3 x 3 x 3 space, our parallel processor must have some way to gather the three 3 x 3 maximum values out of the same 2-D position on three consecutive data planes. Knowing the 3 x 3 max filter output being in raster-scan sequence, the three data to be gathered are present at time separation of Nx*Ny units each. Thus, we may use the delayed comparator similar to the sub-module 3-RDC but with the delay time of Nx*Ny units instead of Nx units. In this design, we incorporate the data filter once again to perform the peak filtering, with the original input data delayed for Nx*Ny+ Nx+ 6 time units. The configuration of the array processor design is shown in Figure 7. Data stream in raster-scan sequence. The array processor of Fig 4. Delay. PE. PE. ( N x × N y + 1). Delay ( N x × N y + N x + 6). Figure 7.. Input C. Data Filter. Output. The configuration of the pipelined 3x3x3 peak detector. With the same design methodology, we may extend our parallel processor design to 5 x 5 x 5 peak detector, or to 3 x 3 x 3 x 3 higher-dimension peak detector. For the former case, we need only concatenate two copies of the processor module (excluding the data filter) in Figure 7, to form a 5 x 5 x 5 max filter. After incorporating the data filter and delay buffer of proper length, the pipelined 5 x 5 x 5 peak detector is achieved. For the latter case, we may take the processor module of Figure 7 (excluding the data filter), and add another delayed comparator similar to the sub-module 3-RDC but with the delay time of Nx*Ny*Nz units instead of Nx*Ny units. Again, after incorporating the data filter and delay buffer of proper length, we have the 3 x 3 x 3 x 3 peak detector for our usage. 5.. To design the parallel peak detector for two-dimensional data array, we may make use of the RSC sub-module (see Figure 1) which obtains the maximum value out of three consecutive row data. And to acquire the maximum data out of each row of the data array in parallel, we propose to use an array of RSCs, with the number of RSCs equal to the number of rows and each RSC connecting to the output terminal of each row. Now since we can get each row’s 1x3 maximum at the same time, we may compare the maximum values of any three consecutive rows directly without the use of the 3-Row Delayed Comparator. There are more than one way to design this 3-row comparator to get their maximum. To reduce the complexity of the circuit, we choose to adopt the configuration shown in Figure 8 for our 3-Row Comparator (3-RC) sub-module. Input A Input B. (N x × N y ). Delay. takes input from the data array, one data at a time. The speedup of such pipelined parallel processor is quite limited, only up to ten- or twenty-fold in most cases, comparing with the traditional general-purpose processor. Moreover, with the use of VLSI array processors in some applications, the speed of processing to generate the array data (the input source) could be much facilitated. The data could be produced with an oncoming rate of one row or one column at a time. Thus in order not to become a bottleneck, the parallel peak detection for the same order of magnitude (such as one column at a time) is highly desirable.. PE. Reg. PE. Output. Figure 8. The configuration of the 3-Row Comparator (3-RC). By connecting the RSC output of any three consecutive rows (any row, its upper one row and lower one row) to the three input channels of a 3-RC sub-module, a 3x3 max filter for one row can be formed. Repeating such construction up to the number of rows, we have the parallel 3 x 3 max filter for the given 2-D data array.. DESIGN OF ARRAY PROCESSORS FOR PARALLEL DETECTION. The design of pipelined peak detector uses only a small number of PEs (unit-comparators), and it is not complicated. Nevertheless, the pipelined peak detector 4.
(5) 0. RSC RSC RSC. 3-RC 3-RC. 6.. RSC. 3-RC. 3-RC. RSC RSC. 3-RC. RSC RSC. 3-RC. 0. The configuration of the parallel 3x3 max filter. For the final step of peak detection, we use the data filter and delay buffer in our design similar to the scheme described in the previous section. The circuit diagram of the 3 x 3 peak-detection for one row is shown in Figure 10. With the delay buffer of 4 time-units, it is adequate to match the timing for peak filtering. RSC of upper row One-row data stream. RSC. Data Filter. 3-RC. RSC of lower row Delay (4). Figure 10.. The circuit diagram of the 3 x 3 peak detector for one row. Redrawing the above addition into the whole array processor design, we have the array configuration for the completed parallel 3 x 3 peak detector shown in Figure 11.. DF DF Paralel input from data array. The Array Processor of Fig 9. DF Output DF DF DF. Delay (4). PARALLEL PEAK DETECTION FOR MULTI-DIMENSIONAL DATA. Output. Data array. Figure 9.. Figure 11. The array configuration of the parallel 3 x 3 peak detector (the block DF stands for the data filter). For many applications, the data array is of dimension higher than two. To furnish our design for various cases, we investigate the parallel detection of peaks for data arrays of higher-dimension. Working on the three-dimensional case, first, we should clarify the way of which the array data are input to our parallel detector. So far in this paper, we consistently assume that the data in a row be shifted to the right (or the data be read from the right end of the row). For our parallel detection on a two-dimensional data array, the data are read from the right side of the 2-D memory plane, column by column. For the three-dimensional case, similar to the raster-scan sequence we have adopted, right after the first data plane is completely read out, the 2nd data plane will be accessed, starting from its rightmost column. Focusing on a specific row in this data array, such a data reading sequence is just like the previous pipelined case. The data in a row are read one by one (from right to the left); after finishing one row, the next row (the row at the same position of the next data plane) will be read in the same sequence. Following this way, the data are read one row by one row (or one data-plane by one data-plane from the parallel-operation points of view) until the last data plane is finished. From the design of the previous section, the processor array of the 3x3 max filter has been able to acquire the maximum values (over the 3x3 window in the same data plane) in parallel for each row. For the design of a 3x3x3 max filter, what we need to do is to gather the 3x3 maximum values from the same position of three consecutive rows (i.e. three consecutive data-planes for a specific row processor module). Knowing the data input sequence in our case, the three 3x3 maximum data on three consecutive data-planes to be gathered are present at time separation of only Nx units each. (Here Nx is the number of data in a row of our data array.) And our design must compare these three values to get their maximum for our 3x3x3 max filter output. Just like the case of our pipelined 3 x 3 max filter, the design of the 3-row delayed comparator (3-RDC of Figure 3) fits the above functions exactly. Hence by attaching one 3-RDC to the output of each row (construction module) of the array processor of Figure 9, we have completed an array processor design of parallel 3 x 3 x 3 max filter for the three-dimensional data array. Similar to the previous design, by incorporating the data filter and delay buffer to the above 3 x 3 x 3 max filter, we will have the complete parallel 3 x 3 x 3 peak detector as shown in Figure 12. The delay of Nx+6 time units is counted to match the timing.. 5.
(6) length of 8-bit, the chip would need as many as 1024 I/O pins for just a middle size NR.). Paralel input from data array 3-RDC. DF. 3-RDC. DF. 3-RDC The Array Processor of Fig 9. DF Output. 3-RDC. DF. 3-RDC. DF. 3-RDC. DF. Delay ( Nx+6 ). Figure 12.. The configuration of the parallel 3x3x3 peak detector. With the array processor modules we have developed so far, we can easily configure these construction blocks to form the parallel peak detectors of different specifications. Taking the parallel 5x5 peak detector as an example, we may concatenate two array processor modules of Figure 9 to form a parallel 5 x 5 max filter. Incorporating an array of the data filters and delay buffers of proper length, we have a parallel 5 x 5 peak detector. As to the parallel peak detector for higher-dimension, we may extend our design using the previously proposed processor modules. For example, we may add in another array of 3-RDC modules (of proper delay length reflecting the time separation due to the fourth dimension) before the Data Filter stage in Figure 11. By setting an appropriate time delay length to the “Delay” block, the design of a parallel 3x3x3x3 peak-detector for 4-D data array can be furnished. 7. VLSI IMPLEMENTATION AND PEAKS REPORTING In this research, none of the pipelined peak detectors proposed requires many circuit components or modules. There is no difficulty for a VLSI chip to implement the whole circuit of any such detector. As the data are pipelined in operation, only an input channel and an output channel are required. There is no problem with the number of I/O pins for the chip. And since the filtered peak or non-peak data comes out one at a time, the host computer should have adequate time or memory bandwidth to collect the address and/or value of the peak. No extra provision is needed to report the peaks. For the parallel peak detector, the situation is different in several aspects. First, the circuit complexity of our array processor is about proportional to NR, the number of rows of our parallel detection (or processing). On the other hand, due to the possibly large number of rows processed in parallel, the number of input/output channels of our array processor module may require too many I/O pins to be implemented on one VLSI chip. (For NR = 64 and word. To reduce the number of I/O pins across the chip boundary and the cost (or effort) for inter-chip connection, it is possible to implement the parallel peak detector circuits in the same chip of the data array. Depending on the applications and design, the data in the data array may be generated from certain operations such as the Hough transform parallel processing, with the original source data coming from a single or a small number of input channels (for such example, refer to [6]). In this way, the output pins of the data array and the input pins of our peak-detector array processor across the VLSI chip boundary can be eliminated. And we save a large effort for chip interconnection. As to the parallel peak-detector output, it is desirable to reduce the number of output channels as well. The reasons for this are three-folded. First, it is better to reduce the I/O pins across the VLSI chip such that the size of the chip can be smaller. Second, the host computer (or host processor) taking this output usually does not have such a broad data bandwidth. The I/O interface of the host computer would become a severe bottleneck. The third, which is even more important, is that the number of peaks extracted from the data array is usually scarce with respect to the number of data for most applications. (The circle-detection Hough-transform is an example of this.) For the above reasons, a peak-data concentrator that filters the parallel output data and reports only the information of the few detected peaks is highly desirable. Depending on the probable ratio of the peak to the non-peak data, there are various ways to design such a peak-reporting stage. Taking our application on image pattern recognition based on Hough transform as an example, we have a small number of peaks to be reported. For a simple design, we may implement a scheme similar to the daisy chain along the column of register buffers (of the reporting stage) to identify the first row of output with peak data. Right after reporting the peak’s position and value, this peak data will be cleared. Thus the next peak in the register buffers, if any, can be reported. This process continues until all the peaks in this reporting stage are reported. Then we can allow the next column of the peak detector’s output to come into the register buffers again. Note that in practice the chance of having more than one peak in the same column of the output is rare. Detailed study on various designs is beyond the scope of this paper. 8. CONCLUSION In this paper, a series of VLSI array processor designs are proposed for various needs of peak detection on multi-dimensional data array. We have developed the row sequential comparator and the 3-row delayed comparator, and use them to compose a basic pipelined 3 x 3 maximum filter. Based on such module, the pipelined 3 x 3 and 5 x 5 peak-detectors can be easily configured. The design can be extended to the three-dimensional 3 x 3 x 3 and 5 x 5 x 5 peak detection, detecting local peaks of broader range, or even to the cases of higher dimension. We also propose 6.
(7) some array processors to extract peaks in parallel, column by column. And as the pipelined case, we have also extended our array processor design for parallel peak-detection, to detecting local peaks of broader range, and to the cases of higher dimension. The peak-detection array processors we have proposed in this paper are simple in architecture, with regularity, and suitable for VLSI implementation. ACKNOWLEDGMENT This research work was supported by the grant NSC-89-2215-E-194-010 from the National Science Council of the Republic of China. REFERENCES [1] R.O. Duda and P.E. Hart, “Use of Hough transformation to detect lines and curves in pictures,” Comm. ACM, Vol. 15, pp. 11-15, 1975. [2] D.H. Ballard, “Generalizing the Hough transform to detect arbitrary shapes,” Pattern Recognition, vol. 13, no. 2, pp. 111-122, 1981. [3] J. Illingworth, and J. Kittler, “A survey of the Hough transform,” Computer vision, Graphics and Image Processing, Vol. 44, pp. 87-116, 1988. [4] H.Y.H. Chuang, and C.C. Li, “A systolic array processor for straight line detection by modified Hough transform,” in Proc. IEEE Conf. computer Architecture for pattern Analysis and Image Database Management, pp. 300-304, 1985. [5] H.F. Li, D. Pao, and R. Jayakumar, “Improvements and systolic implementation of the Hough transformation for straight line detection,” Pattern Recognition, vol. 22, no. 6, pp. 697-706, 1989. [6] M.Y. Chern and C.M. Dai, “Design of VLSI Parallel Processors for Hough Transform-based Line Detection”, Journal of The Chinese Institute of Electrical Engineering, Vol.7, no.1, pp.41-52, 2000. [7] R. Chan and W.C. Siu, “New parallel Hough transform for circles,” IEE Proceedings-E, Vol. 138, pp. 335-344, 1991. [8] R.K.K. Yip, P.K.S. Tam, and D.N.K. Leung, “Modification of Hough transform for circles and ellipses detection using a 2-dimensional array,” Pattern Recognition, Vol. 25, pp. 1007-1022, 1992. [9] P. Kierkegaard, “A method for detection of circular arcs based on the Hough transform,” Machine Vision and Applications, Vol. 5, pp. 249-263, 1992. [10] S. Kumar, N. Ranganathan, and D. Goldgof, “Parallel algorithms for circle detection in images,” Pattern Recognition, Vol. 27, pp. 1019-1028, 1994. [11] C.M. Dai, “Design of VLSI Parallel Processors for Line and Circle Detection Hough Transform”, M.S. thesis, National Chung Cheng University, 1997. [12] M.Y. Chern and T.K. Tseng, “Real-time image template matching based on a versatile VLSI array processor,” Proc. National Computer Symposium, vol. 2, pp.501-509, 1993.. 7.
(8)
數據


+2

相關文件
When ready to eat a bite of your bread, place the spoon on the When ready to eat a bite of your bread, place the spoon on the under plate, then use the same hand to take the
The remaining positions contain //the rest of the original array elements //the rest of the original array elements.
Then, we tested the influence of θ for the rate of convergence of Algorithm 4.1, by using this algorithm with α = 15 and four different θ to solve a test ex- ample generated as
Numerical results are reported for some convex second-order cone programs (SOCPs) by solving the unconstrained minimization reformulation of the KKT optimality conditions,
Particularly, combining the numerical results of the two papers, we may obtain such a conclusion that the merit function method based on ϕ p has a better a global convergence and
By exploiting the Cartesian P -properties for a nonlinear transformation, we show that the class of regularized merit functions provides a global error bound for the solution of
incapable to extract any quantities from QCD, nor to tackle the most interesting physics, namely, the spontaneously chiral symmetry breaking and the color confinement..
If the best number of degrees of freedom for pure error can be specified, we might use some standard optimality criterion to obtain an optimal design for the given model, and
