Improving Dynamic Binary Optimization Through
Early-Exit Guided Code Region Formation
Chun-Chen Hsu
Pangfeng Liu
National Taiwan University {d95006,pangfeng}@csie.ntu.edu.tw
Jan-Jan Wu
Institute of Information Science,Academia Sinica wuj@iis.sinica.edu.tw
Pen-Chung Yew
University of Minnesota yew@cs.umn.eduDing-Yong Hong
Institute of Information Science,Academia Sinica dyhong@iis.sinica.edu.tw
Wei-Chung Hsu
National Chiao Tung Universityhsu@cs.nctu.edu.tw
Chien-Min Wang
Institute of Information Science,Academia Sinica cmwang@iis.sinica.edu.tw
Abstract
Most dynamic binary translators (DBT) and optimizers (DBO) tar-get binary traces, i.e. frequently executed paths, as code regions to be translated and optimized. Code region formation is the most im-portant first step in all DBTs and DBOs. The quality of the dynam-ically formed code regions determines the extent and the types of optimization opportunities that can be exposed to DBTs and DBOs, and thus, determines the ultimate quality of the final optimized code. The Next-Executing-Tail (NET) trace formation method used in HP Dynamo is an early example of such techniques. Many exist-ing trace formation schemes are variants of NET. They work very well for most binary traces, but they also suffer a major problem: the formed traces may contain a large number of early exits that could be branched out during the execution. If this happens fre-quently, the program execution will spend more time in the slow binary interpreter or in the unoptimized code regions than in the optimized traces in code cache. The benefit of the trace optimiza-tion is thus lost. Traces/regions with frequently taken early-exits are called delinquent traces/regions. Our empirical study shows that at least 8 of the 12 SPEC CPU2006 integer benchmarks have delin-quent traces.
In this paper, we propose a light-weight region formation tech-nique called Early-Exit Guided Region Formation (EEG) to im-prove the quality of the formed traces/regions. It iteratively iden-tifies and merges delinquent regions into larger code regions. We have implemented our EEG algorithm in two LLVM-based multi-threaded DBTs targeting ARM and IA32 instruction set architec-ture (ISA), respectively. Using SPEC CPU2006 benchmark suite with reference inputs, our results show that compared to an NET-variant currently used in QEMU, a state-of-the-art retargetable DBT, EEG can achieve a significant performance improvement of
Permission to make digital or hard copies of all or part of this work for personal or classroom use is granted without fee provided that copies are not made or distributed for profit or commercial advantage and that copies bear this notice and the full citation on the first page. To copy otherwise, to republish, to post on servers or to redistribute to lists, requires prior specific permission and/or a fee.
VEE’13, March 16–17, 2013, Houston, Texas, USA. Copyright c 2013 ACM 978-1-4503-1266-0/13/03. . . $15.00
up to 72% (27% on average), and to 49% (23% on average) for IA32 and ARM, respectively.
Categories and Subject Descriptors C.4 [Performance of Sys-tems]: Modeling techniques; D.3.4 [Processors]: Incremental Compilers; D.3.4 [Processors]: Optimization; D.3.4 [Proces-sors]: Run-time environments
General Terms Design, Performance
Keywords Dynamic Binary Translation, Trace-Based JIT Compi-lation, Virtual Machine, Hardware-based Performance Monitoring, Hot Region Formation
1.
Introduction
Dynamic binary translation and optimization are core technolo-gies in system virtualization [22]. Most dynamic binary transla-tors (DBTs) and optimizers (DBOs) target binary traces, i.e. fre-quently executed paths, as code regions to be translated and opti-mized. Code region formation is the most important first step in all DBTs and DBOs. The quality of the dynamically formed code regions determines the extent and the types of optimization oppor-tunities that can be exposed to DBTs and DBOs, and thus, deter-mines the ultimate quality of the final optimized code. As code re-gions are formed by traces, we will use the terms trace and region interchangeably for the rest of the paper.
Many DBT and DBO systems [6, 7] follow the well-known run-time trace formation algorithm, called Next-Executing-Tail (NET), developed in HP Dynamo [3].
Instead of profiling all execution traces at runtime to select the hottest trace, NET forms a trace by selecting the basic blocks1that
are most recently executed. The idea is that when a basic block becomes hot, it is likely that the following basic blocks are also hot.
As a hot trace is formed by cascading a sequence of hot basic blocks, there will be a conditional branch at the end of each member basic block, referred to as the early exit of the trace. DBTs needs to generate compensation code at each of such early exits to handle the case when the conditional branch is taken [22]. If early exits are frequent, then not only will such extra compensation code need
1A basic block is a sequence of instructions terminated by a control transfer
80522be 80522ce 80522e5 8052280 80522be 80522ce 80522e5 80522ce 8052280 early exit trace head early exit target
13% 9% 7%
81%
26% 20% 28% 52%
18% 98%
(b) Traces generated by NET
(a) CFG of the for−loop in 456.hmmer.
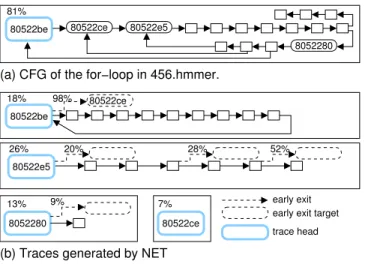
Figure 1. An example of delinquent traces of NET in 456.hmmer.
to be executed, but also program execution will spend more time in the slow binary interpreter or in unoptimized code regions. The benefit of trace optimization by the DBT is thus lost. Traces with frequently taken early-exits are called delinquent traces.
Since NET does not use edge profiling [3] information to se-lect next basic blocks, early exits may occur when program behav-ior changes in different execution phases. For example, the func-tion P7Viterbi in 456.hmmer (a SPEC 2006 CPU benchmark) contributes most of its execution time. P7Viterbi updates global variables according to different conditions in a performance critical for-loop as shown in Figure 1(a).
NET splits the for-loop into four traces as shown in Figure 1(b). Each large rectangle represents a trace. The execution time of each trace, shown as the percentage of total execution time, is noted on the left top corner of the trace. The probability of an early exit being taken is also noted on each exit edge. Figure 1(b) shows a trace for a loop starting at 0x80522be. The probability of taking an early exit during the loop execution is 98%. Such a high probability for an early exit will certainly diminish the performance benefit expected from the loop trace. Our proposed region formation technique (see Section 3) will merge those four traces into a large code region shown in Figure 1(a), which can improve its performance by 68%. To accomplish this, we propose a light-weight technique called Early-Exit Guided (EEG) region formationto detect and merge delinquent regions. There are two key issues in EEG: (1) which regions should be merged, and (2) when to merge those regions. A simple approach for the first issue is to instrument counters into all traces. However, this approach is prohibitively expensive. In-stead, we employ hardware-assisted dynamic profiling to select hot regions and to avoid monitoring and merging unimportant re-gions. To address the second issue, we monitor regions by instru-menting counters to detect early exits. When the counter exceeds a threshold, we merge this region with the region that begins at the branch target of the early exit. We also employ a heuristic to decide whether it is beneficial to merge the selected regions or not. We will not merge regions if it will cause too much register pressure; i.e. too many store/load operations to spill and fill values between registers and the stack (see Section 3.4).
We summarize the main contributions of this work as follows: 1. Our experimental results show that there is a substantial amount
of delinquent traces, and that more than 100 early exits are taken for every million executed instructions in 65% of SPEC CPU2006 integer benchmarks. We proposed an Early-Exit-Guided region formationalgorithm (EEG) that uses
hardware-Chunk 2 Chunk 3 Chunk 4 Chunk 1
Initialization
execution
dispatch TranslateBlock Translate Traces/Regions Optimization Threads EEG Region Formation NET* Trace Formation Feedback Profile Data miss Execution Threads hit
Shared Code Cache Collect Runtime Data
From Code Cache ProfilingThread
Task Queue
Figure 2. Control flow of execution threads and optimization threads
assisted dynamic profiling and instrumented software counters to detect and merge delinquent traces/regions into larger re-gions.
2. We implement the EEG scheme in two LLVM-based [1] multi-threaded DBTs targeting ARM and IA32 instruction set archi-tecture (ISAs), respectively. They off-load DBTs to other cores and allow more aggressive and sophisticated optimizations to be done on the larger code regions formed by EEG.
3. Using SPEC CPU2006 benchmark suite with reference inputs, our results show that compared to NET, EEG can achieve a significant performance improvement of up to 72% (27% on average) for IA32, and to 49% (23% on average) for ARM. The rest of the paper is organized as follows. Section 2 presents our region-based multi-threaded DBT. Section 3 describes our early exit detection technique and early-exit guided region formation scheme. Section 4 presents our experimental results. Section 5 describes related work, and Section 6 gives some concluding re-marks.
2.
Region-Based Multi-threaded Dynamic Binary
Translator
In this section, we describe the design of our region-based multi-threaded dynamic binary translator, called LnQ [14]. We have im-plemented the EEG scheme in LnQ. LnQ uses QEMU [2] as the front-end emulation engine, and uses LLVM [1] compilation infras-tructure to handle its back-end code optimization and target code generation. We implement our EEG scheme using this framework. Figure 2 shows the major components and the control flow of our region-based multi-threaded dynamic binary translator.
We use code segments to refer basic blocks and traces/regions, and use code fragment to refer a translated code segment by DBT. Therefore, there are basic block fragments and trace/region frag-ments. Each code fragment has a prologue to load the guest ar-chitecture states, such as the content of the guest registers, from the memory to the host registers before execution. Also, each code fragment has an epilogue to store modified machine states back to memory before leaving the code fragment. Each code fragment has its own register mapping decided by the LLVM register allocator.
LnQ uses execution threads and optimization threads. Execu-tion threadsare responsible for translating basic blocks and exe-cuting translated code fragments. That is, if an execution thread reaches a new guest basic block during execution, the execution thread generates a basic block fragment using LLVM. Optimization threadsgenerate optimized traces and regions fragments also using LLVM. Execution threads compile blocks with “O0” optimization
level to minimize compilation overhead. On the other hand, opti-mization threads compile traces and regions with “O2” to gener-ate optimized code. All execution threads share one software code cache. As shown in Figure 2, we partition the code cache into sec-tions, and each thread has its own section to store the translated code fragments so that threads can generate code concurrently.
The DBT system separates trace compilation from program ex-ecution. By running optimization threads concurrently on other cores, the execution threads are not disrupted. Execution threads may create region compilation tasks and send them to a Task Queue (see Figure 2) when traces or regions are formed as described in Section 3. We use a lock-free concurrent FIFO queue [19] to imple-ment the task queue so that execution threads can insert trace/region compilation tasks into the queue while the optimization threads take those tasks from the queue without locks.
When an optimization thread generates a new trace or region, it dispatch execution threads to the newly generated code fragment by atomically patching jump instructions in the code cache. To do this in IA32, we need to align the patched instructions to 4-byte alignment, and use the self-branch technique mentioned in [24] to patch jumps atomically.
3.
Early Exit Index and Early-Exit Guided
Region Selection
In this section, we first describe the NET algorithm used in our system. We then define an early exit index to quantify how often early exits are taken in a trace. Finally we describe our early exit guided region selection technique.
3.1 Trace Selection Algorithm
We adopt a modified NET algorithm called NET∗, which is similar to [6], to builds traces. The difference is that NET∗considers all basic blocks as potential trace head candidates, while NET only considers blocks which are targets of backward branches as trace headcandidates in that they may form potential loops.
The NET∗algorithm has two advantages. First, the NET algo-rithm [3] was designed for DBT systems in which a single DBT thread is responsible for both execution and trace building. To re-duce the overhead of building traces, NET needs to be very selec-tive in potential traces. In contrast, NET∗can take advantage of modern multi-core platforms to offload the overhead of building traces. Hence, it can afford to try all basic blocks as potential trace heads.
Second, NET may not identify all loops by only considering targets of backward branches. By considering all basic blocks as possible trace heads, NET∗ can discover more hot traces than NET can. As reported in Section 4.1.1, NET∗achieves 12% and 5% performance improvement on average over NET for SPEC CINT2006 and CFP2006 benchmarks, respectively.
Our NET∗algorithm works as follows. We instrument software counters to record the number of times each block is executed. A block becomes a trace head when the number of times the block has been executed exceeds a threshold value. NET∗forms a trace by appending blocks along the execution path until one of the following terminal conditions is met: (1) A branch to the trace head is taken, (2) The number of blocks exceeds a threshold, (3) The next block is the head of another trace, or (4) A guest system call instruction is encountered.
3.2 Early Exit Index
We first define an early exit of a trace. A trace can be a straight-line execution path or a cycle. If a trace is a straight-line path, then all exit edges along the path are early exits except the exit edge of the
last basic block in the trace. If a trace is a cycle, all exit edges are early exit.
We define an Early-Exit Index (EEI) to measure the frequency of early exits taken in traces. More specifically, EEI is the number of early exits being taken for every million instructions executed in traces. It can be formally defined as in the following equation.
EEI = P
i∈Γni× ρi
N
where Γ is the set of traces, niis the number of times early exits
being taken in trace i, ρiis the percentage of instructions executed
in trace i, and N is the number of million instructions executed. 3.3 Early-Exit Guided Region Selection
In this section, we describe our proposed Early-Exit Guided (EEG) region selection scheme. It detects and merges regions that have frequently taken early exits. The key issues in EEG are (1) how to efficiently detect delinquent regions; and (2) when to merge them at runtime. We address them as follows.
The simplest approach to address the first issue is to instrument counters in all traces and regions. However, this approach is in-efficient and may merge too many regions that are not frequently executed. Instead, we use a dynamic profiling approach with the help of on-chip hardware performance monitor (HPM) to select hot regions.
We create a profiling thread called profiler at the beginning of execution to perform dynamic profiling. The profiler collects program counters periodically for every million instructions retired. When a threshold number of samples are collected, the profiler accumulates the sample counts for each trace to determine the degree of hotness of each trace. The hotness of a trace is measured by the following equation.
HT = max{α, β}
Here, α is the percentage of instructions executed in the trace during the last sampling period, and β is the percentage of instruc-tions executed in the trace during the entire execution. Intuitively, α represents the hotness of the trace during the last period, and β represents the accumulated hotness during the entire execution. We choose the maximum of α and β as its hotness measure.
When the hotness of a trace exceeds a threshold, we start mon-itoring the trace by instrumenting counters to its early exits. Cur-rently, we only monitor the early exits of conditional branches. If a counter exceeds a pre-defined threshold, it means the control leaves the region through the corresponding early exit very frequently. Then, we merge the monitored region with the target region of the early exit. We translate and optimize the merged region with our LLVM-based DBT, and replace the monitored region with the merged region.
We argue that the overhead of the instrumentation is negligible because early exits should be rarely taken. A frequently taken early exit would have triggered region formation when the counter exceeded the threshold.
3.4 Spill Index of a Region
The benefits of EEG region formation come from eliminating the overhead caused by frequently taken early exits, and potential op-timization opportunities from a larger code region. Despite the fact that we can mostly eliminate the overhead of frequently taken early exits via region merging, we may not always have potential opti-mization opportunities from the merged region. In particular, if the quality of the translated code of a region is not good enough, it is not beneficial to merge such a region.
We define an index, called Spill Index, to assess the quality of the code generated by the LLVM compiler for a region formed
A C B D E F G (a) A D E G G C B F G A D B C E G F G (d) A B F C E G (c) (b) D
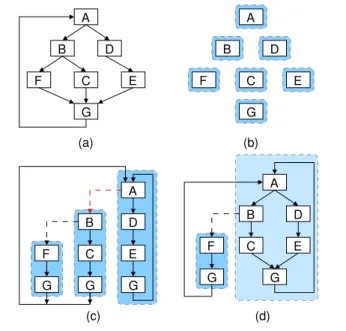
Figure 3. Illustration of region selection.
by the EEG technique. A spill instruction is an instruction for load/store operations between registers and stack. The Spill Index is the percentage of spill instructions in the translated code fragment. When the Spill Index of a code fragment exceeds a threshold, that region should not be further merged because a high percentage of spill instructions often forestalls good performance due to improper register allocation of the LLVM compiler.
3.5 Region Versus Trace
By creating larger regions, we reduce the amount of specialization that the compiler can do for traces. As we know, the benefit of traces comes from the instruction scheduling within traces [15].
However, we need to limit the instruction scheduling optimiza-tions when we compile traces in dynamic binary translation, be-cause we have to rematerialize full guest state in case a hardware exception or a signal was raised.
The main advantage of EEG region formation is that it can im-prove DBT performance by removing transition overhead among traces, such as removing redundant loads/stores of guest state among traces.
We use Figure 3 as an example to illustrate our region formation strategy. Figure 3(a) is the control flow graph (CFG) of a hot region in a guest application. During execution, each block is first translated as shown in Figure 3(b). Then NET∗forms three traces as in Figure 3(c). Trace A would be the first selected for early exit detection (see Figure 3(c)) since a loop is likely to become hot. Thus the early exit of A, marked by a dashed arrow from the trace started with A (enclosed by the dotted rectangular) to the trace started with B, is monitored with an instrumented software counter. We merge Trace A and Trace B to form a code region when the early exit is taken frequently. A code region, called Region A and is enclosed in the dotted rectangular in Figure 3(d), that consists of traces A and B is formed. After the code fragment of Region A is formed, we replace Trace A and Trace B with Region A so that Trace F now branches to Region A rather than to Trace A. Note that Region A will not be monitored because the spill index of Region A exceeds the threshold.
4.
Experiments
In this section, we evaluate the performance of Early-Exit-Guided region selection algorithm in our LLVM-based parallel DBT sys-tems. We start by describing our measurement methodology.
We evaluate the performance with SPEC CPU 2006 benchmarks on a 3.3GHz quad-core Intel Core i7 machine. The machine has 12 GB main memory and the operating system is 64-bit Gentoo Linux with kernel version 2.6.30. We use the LnQ [14] dynamic binary translation framework to build two translators which trans-late IA32 and ARM guest ISAs to x86 64 host ISA. For CFP2006 benchmarks, we only compile them into IA32 binaries because most CFP2006 benchmarks are written in Fortran and the ARM tool chain we use does not provide cross-compilation for For-tran. The result of ARM 464.h264ref is not reported because the SPEC runspec tool reports a mis-match error even when it runs 464.h264ref in a native ARM machine.
The benchmarks are compiled with GCC 4.3.4 for IA32 binaries and GCC 4.4.1 for ARM binaries. For all benchmarks, “-O2” flag is used. For IA32 benchmarks, we use “-m32” to generate IA32 binaries. For CFP2006, we use “-msse2 -mfpmath=sse” extra flags to generate SSE vector instructions. We use runspec script provided by SPEC to run benchmarks and report the median of 5 runs for all performance metrics.
We compare three region selection strategies in our experi-ments, which are NET, NET∗and EEG as described in Section 3. In EEG strategy, we first use NET∗to select traces, and use EEG to merge traces into regions. We set block count threshold to 50 and allow at most 16 blocks in a trace. For EEG strategy, the threshold of spill index is set to 15%, i.e. regions cannot be further merged when the percentage of spill instructions in the translated fragment exceeds 15%.
We use Perfmon2 [21] for hardware-assisted dynamic profiling to collect runtime information for every one million retired instruc-tions. The early exit threshold is set to 1000 and we use two opti-mization threads to compile traces and regions in all experiments.
4.1 Performance Results of SPEC CPU2006
The performance results of SPEC CPU2006 are shown in Figure 4 and Figure 5. For clearness of presentation, the benchmarks in both figures are sorted in decreasing order of speedup ratio so that it is easier to see the maximum, the minimum, and the geometric average of the results. We explain the results in the following sections.
4.1.1 Performance of NET∗
The performance of NET∗algorithm compared to NET in SPEC CINT2006 benchmarks is shown as red bars in Figure 4. For CINT2006 benchmarks, NET∗achieves an average improvement of 12% and 10% for the IA32 and ARM benchmarks, respec-tively, with up to 53% and 46% for IA32 456.hmmer and ARM 471.omnetpp. The results show that NET∗ discovers more hot traces than NET does by considering all blocks as possible trace heads, and our DBTs do not incur significant overhead because the compilation overhead is offloaded to optimization threads.
We notice that only ARM 462.libquantum has 8% slowdown. We compare traces generated by the two algorithms and show the difference, in Figure 6, among traces generated by NET and NET∗ for a hot loop in function quantum toffoli of 462.libquantum. As shown in Figure 6 (a) and 6 (b), both NET and NET∗have the same trace T-d10c, but NET∗ splits trace T-d094 of NET into T-d094 and T-d0b4 because NET∗generates T-d0b4 before T-d094. The transition between traces T-d094 and T-d0b4 in NET∗results in 8% slowdown compared to NET.
However, both NET and NET∗ have the delinquent trace T-d10c with frequently taken early exit to T-d094 due to an
unbi-80% 100% 120% 140% 160% 180%
462.libquantum456.hmmer458.sjeng445.gobmk483.xalancbmk400.perlbench473.astar401.bzip2403.gcc464.h264ref429.mcf471.omnetppGeoMean 471.omnetpp462.libquantum458.sjeng400.perlbench483.xalancbmk429.mcf445.gobmk401.bzip2473.astar403.gcc456.hmmerGeoMean
Speedup Ratio
127%
123%
172%
149%
EEGNET*NET
SPEC CINT2006- IA32
SPEC CINT2006 - ARM
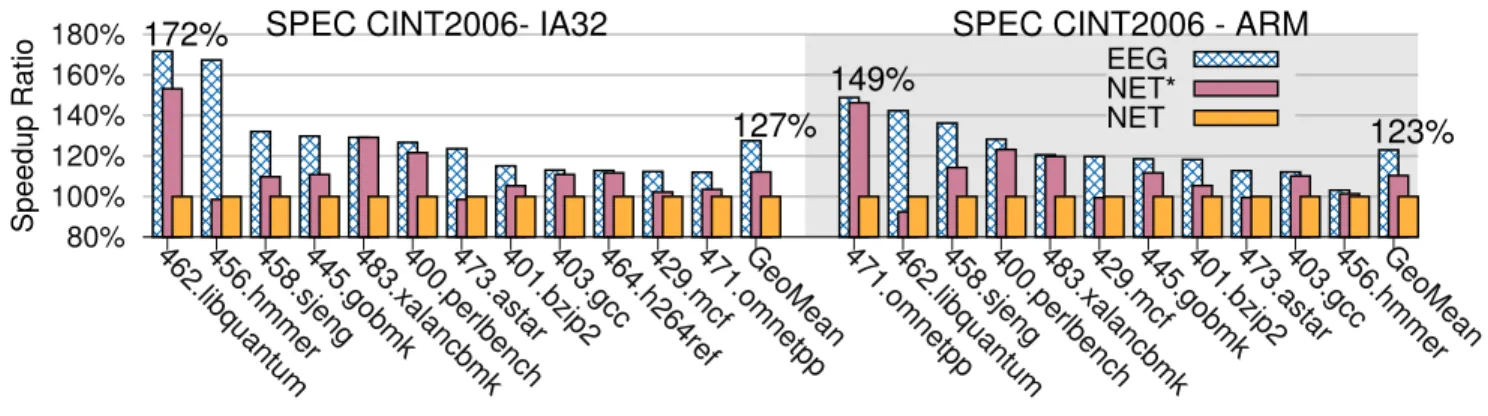
Figure 4. Performance results of NET∗and EEG compared to NET in IA32 and ARM SPEC CINT2006.
80% 90% 100% 110% 120% 130%
447.dealII454.calculix453.povray416.gamess450.soplex444.namd465.tonto482.sphinx3435.gromacs434.zeusmp433.milc481.wrf436.cactusADM410.bwaves470.lbm437.leslie3d459.GemsFDTDGeoMean
Speedup Ratio EEG NET* NET
145%
131%
107%
SPEC CFP2006- IA32
Figure 5. Performance results of NET∗and EEG compared to NET in SPEC CFP2006.
ased branch in block d10c. In the next section, we show that EEG can merge the delinquent trace T-d10c into one region as shown in Figure 6(c) and improves the performance of NET∗by 54%.
Figure 5 shows the speedup ratio of NET∗ algorithm with NET as baseline performance for the SPEC CFP 2006 bench-marks. NET∗achieves significant improvement only in 447.dealII, 453.povray, and 454.calculix (31%, 18% and 12% respectively), and it gains 4.9% improvement on average in CFP2006 bench-marks. Most CFP2006 benchmarks spend their time in small num-ber of hot loops, which can all be identified by NET and NET∗. Thus, there is little difference between traces of NET and NET∗in these benchmarks.
4.1.2 Performance of EEG Region Selection
The performance of EEG compared to NET in SPEC CINT2006 benchmarks is shown in Figure 4. For CINT 2006 benchmarks, EEG achieves an average improvement of 27.5% and 23% for the IA32 and ARM benchmarks, respectively, with up to 71.7% and 49% for IA32 456.hmmer and ARM 471.omnetpp. Merging traces can reduce the prologue and epilogue code executed hence the transition overhead among different traces/regions are reduced. As we will see in Section 4.3, the execution with EEG has less memory and branch operations compared to NET.
We now take a closer look at IA32 456.hmmer and ARM 462.libquantum to give more insight of the benefit of EEG. In 456.hmmer, the hottest function is P7Viterbi, which updates global variables according to different conditions in a performance critical for-loop. NET∗splits this loop into four traces as shown in Figure 1(a).
Consequently, the transition among four traces results in sig-nificant overhead. Through early exit detection, EEG merges four traces into one region containing the loop as shown in Figure 1(b).
The merged region achieves 70% performance improvement be-cause of the elimination of the transition overhead among traces.
For 462.libquantum, NET∗ splits a for-loop of function quantum toffoli into three traces as shown in Figure 6(b). As described in the previous section, trace T-d10c is a delinquent trace with a frequently taken early exit to trace T-d094 due to an unbiased branch in block d10c. EEG improves performance by 54% by merging the two traces into one region as shown in Fig-ure 6(c).
As shown in Figure 5, EEG improves NET∗by 4.8% to 7% on CFP2006. The improvement is minor because there are few early exits in these floating point benchmarks. In the next section, we measure the early exit index and show the relation between the number of early exits and the performance improvement.
We also observe that EEG loses 2.7% and 2.9% performance compared to NET in 437.leslie3d, and 459.GemsFDTD respec-tively. In 437.leslie3d, the time is spent in a small number of nested loops in the procedure EXTRAPI of file tml.f. The regions gener-ated by EEG contain nested loops while each trace genergener-ated by NET contains only the innermost loop. Therefore, in 437.leslie3d and 459.GemsFDTD, the translated code for traces is better than translated code for regions. As a result, EEG loses about 2.7% per-formance compared to NET.
4.2 Early Exit Index
In this section, we measure the Early Exit Index (EEI) of bench-marks with the NET∗strategy. We insert counters at each side exit to collect the number of early exits taken in each trace, and we measure the execution frequency of traces by sampling program counters per one million retired instructions. We calculate EEI with the collected numbers as described in Section 3.2. The results are shown in Figure 7. The Y-axis on the left side shows the measured
0 200 400 600 800 1000 1200 1400 1600 1800 2000
456.hmmer462.libquantum473.astar429.mcf471.omnetpp401.bzip2400.perlbench458.sjeng464.h264ref403.gcc445.gobmk483.xalancbmk462.libquantum429.mcf473.astar401.bzip2400.perlbench458.sjeng483.xalancbmk456.hmmer403.gcc471.omnetpp445.gobmk 454.calculix447.dealII470.lbm450.soplex410.bwaves433.milc416.gamess435.gromacs453.povray444.namd482.sphinx3465.tonto481.wrf434.zeusmp459.GemsFDTD437.leslie3d436.cactusADM0%
8% 16% 24% 32% 40% 48% 56% 64% 72% 80%
Early Exit Index
Improved Performance
SPEC CINT2006- IA32 SPEC CINT2006 - ARM SPEC CFP2006 - IA32
EEI Improved Performance
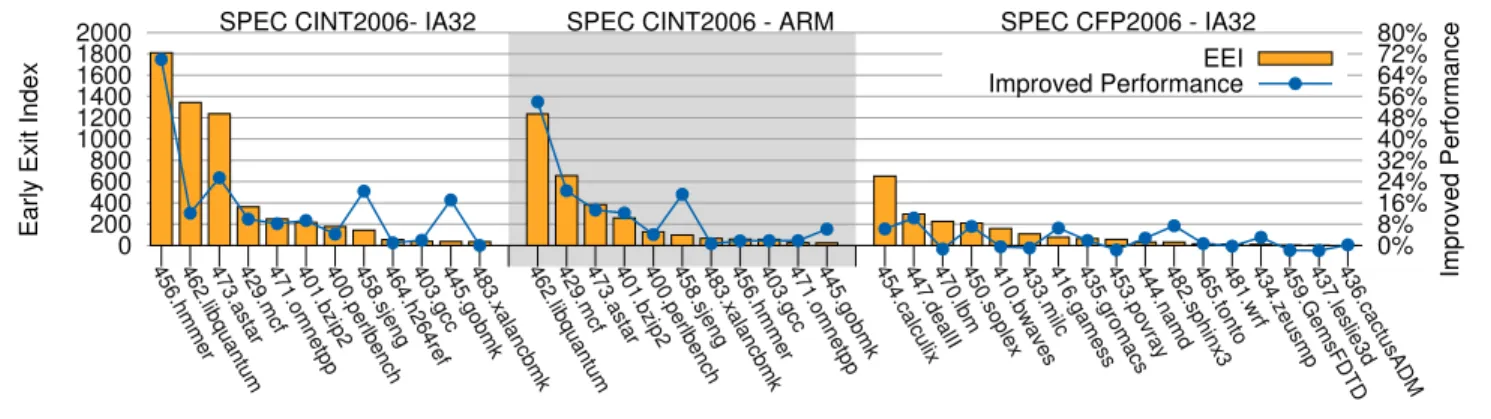
Figure 7. Measured Early Exit Index in NET∗and the performance improvement of EEG.
IA32 CINT2006
Improved Reduced Instructions or Misses
Ratio MemInst BrInst L1 ICache
Misses 456.hmmer 69.9% 52.8% 36.9% 31.0% 473.astar 25.5% 35.4% 20.4% 3.3% 458.sjeng 20.4% 29.9% 17.0% 43.7% 445.gobmk 17.1% 18.2% 7.6% 29.2% 462.libquantum 12.1% 33.6% 9.3% 0.7% 429.mcf 9.9% 33.9% 14.7% 18.2% 401.bzip2 9.3% 18.8% 11.8% 19.0% 471.omnetpp 8.2% 17.2% 7.1% 46.2% 400.perlbench 4.2% 9.5% 4.1% 15.1% 403.gcc 1.9% 5.6% 1.8% 9.8% 464.h264ref 1.0% 1.3% 2.5% 18.6% 483.xalancbmk 0.0% 6.8% -3.5% 3.0% ARM CINT2006
Improved Reduced Instructions or Misses
Ratio MemInst BrInst L1 ICache
Misses 462.libquantum 54.0% 69.0% 15.8% -1.3% 429.mcf 20.5% 45.5% 17.3% 59.4% 458.sjeng 19.2% 17.9% 11.5% 35.5% 473.astar 13.3% 21.1% 10.7% 3.7% 401.bzip2 12.2% 26.8% 13.9% 20.4% 445.gobmk 6.1% 6.5% 5.3% 17.6% 400.perlbench 4.1% 3.3% 6.3% 13.2% 471.omnetpp 1.8% -0.8% 1.6% 7.8% 456.hmmer 1.7% 0.2% 0.7% 59.7% 483.xalancbmk 0.7% 1.5% 7.2% 2.9% 403.gcc -0.6% 0.1% 2.4% 4.7%
Table 1. Reduced memory/branch instructions and cache misses of EEG for CINT2006 benchmarks.
early exit indices; the Y-axis on the right side shows the perfor-mance improvement of EEG compared to NET∗.
In Figure 7, we observe that integer benchmarks are likely to have high EEI values. For example, 65% of CINT2006 benchmarks have EEI values larger than 100, which means there are over 100 early exits per million instructions in those benchmarks in NET∗. CINT 2006 benchmarks also show positive correlation between early exit index and performance improvement. The correlation coefficient of IA32 CINT2006 and ARM CINT2006 are 0.78 and 0.93.
For CFP2006 benchmarks, all the EEI values are relatively small compared to those in integer benchmarks. Only 35% of the benchmarks have EEI values larger than 100. The correlation coefficient of early exit index is 0.43 in CFP2006. Small EEI values are due to the fact that floating point benchmarks usually spend most of their time in simple loops with fewer early exits. We also notice that some benchmarks with small EEI values achieve good performance improvements, such as 445.sjeng and 445.gobmk, which improve 20% and 17%, with EEI values as low as 143 and 36 respectively. In the next section, we collect performance profiles to further analyze the sources of improvement.
4.3 Performance Profiles of EEG
In this section, we collect the number of memory, branch in-structions and the L1 instruction cache misses of NET∗and EEG through hardware performance monitoring. We calculate the per-centage of reduced memory/branch operations and cache misses in EEG compared to NET∗. We focus on the profiles of CINT2006, which are shown in Table 1.
As shown in Table 1, benchmarks with large improvement tend to have high percentage of reduced operations or L1 instruc-tion cache misses. For example, IA32 456.hmmer reduces 52.8%, 36.9% and 31% of memory, branch instructions and L1 i-cache misses, and achieves 70% improvement over NET∗. There are also significant percentage of reduced instructions and misses in 458.sjeng and 445.gobmk, which contributes to the improve-ment of these two benchmarks. The profiling data show that EEG can not only reduce the memory and branch instructions but also reduces L1 instruction cache misses by merging delinquent traces into regions.
4.4 Effect of The Threshold of Spill Index
In this section, we study the effect of the threshold of spill index, described in Section 3.4, on the performance of EEG. As shown in Figure 8(a), the performance of EEG is less sensitive to the thresh-old of spill index for IA32 benchmarks except 471.omnetpp. The results show that the register pressure is not a problem in the region fragments of IA32 benchmarks because the IA32 guest architecture has only 8 general purpose registers while there are 16 registers on x86 64 host architecture.
For 471.omnetpp, the performance degrades by 13.5% when the threshold changes from 15% to 20%. The reason is that when threshold changes from 15% to 20%, the spill index of the hottest fragment changes from 18% to 36% because that fragment merges one more region and its CFG becomes complex when threshold is set to 20%. As a result, the extra spill instructions degrade the performance of 471.omnetpp.
-8% 0% 8% 400.perlbench 401.bzip2 403.gcc -8% 0% 8% 429.mcf 445.gobmk 456.hmmer -8% 0%
8% 458.sjeng 462.libquantum 464.h264ref
-8% 0% 8% 5% 10% 15% 20% 25% 471.omnetpp 5% 10% 15% 20% 25% 473.astar 5% 10% 15% 20% 25% 483.xalancbmk
(a) Results of IA32 CINT2006.
-8% 0% 8% 400.perlbench 401.bzip2 403.gcc -8% 0% 8% 429.mcf 445.gobmk 456.hmmer -8% 0% 8% 458.sjeng 10% 30% 50% 462.libquantum -8% 0% 8% 471.omnetpp -8% 0% 8% 5% 10% 15% 20% 25% 473.astar 5% 10% 15% 20% 25% 483.xalancbmk 5% 10% 15% 20% 25% 464.h264ref(N/A)
(b) Results of ARM CINT2006.
Figure 8. Effect of spill index. The X-axis of each plot is the improvement ratio using the performance of 5% threshold as the baseline, and the Y-axis is the threshold of spill indices ranged from 5% to 25%.
d12c d084 d170 d0b4 d0fc d148 d0d8 d15c
(c) Region merged by EEG.
d12c d084 d170 d15c d0d8 d148 d15c d0d8 d148 d0fc d12c d170 d0fc d148 d0d8 d15c(a) Traces generated by NET.
(b) Traces generated by NET*.
d084 d0fc d10c d094 d0b4 d10c d170 d0b4 d0d8 d148 d0fc d094 d10c d0b4 d0b4 d094Figure 6. Traces/regions generated by NET, NET∗and EEG for a loop in function quantum toffoli of ARM 462.libquantum.
For ARM benchmarks, the performance of EEG is more sensi-tive to the threshold of spill index as shown in Figure 8(b). This is because there are 16 general purpose registers in ARM guest archi-tecture, and register pressure becomes a problem when translating ARM instructions to x86 64 instructions. Consequently, if we al-low regions with high spill indices, i.e., high percentage of spill code in the translated code, to be merged, the performance tends to degrade. For example, in ARM 456.hmmer, a 12% degradation is observed when the threshold of spill index increases from 15% to 20%.
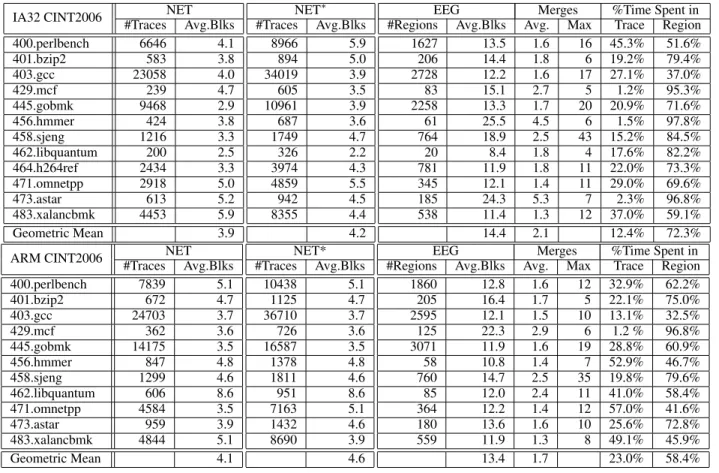
4.5 Statistics of Selected Traces and Regions
Table 2 shows the statistics of selected regions in NET, NET∗and EEG for CINT2006. First, the number of traces in NET∗increase by 54% and 59% on average compared to NET for IA32 and ARM
benchmarks respectively. The average numbers of blocks per trace are similar in NET and NET∗.
13.6% and 11.5% of traces in NET∗ are merged into regions by EEG for the IA32 and ARM benchmarks respectively, which indicates that our HPM-based region selection approach described in Section 3.3 can effectively select hot traces to be merged. The average numbers of blocks per region are 14.4 and 13.4 for the IA32 and ARM benchmarks respectively, which are 3.4X and 2.9X larger than the traces generated by NET∗.
We also compute the number of merges in EEG. There are 2.1 and 1.7 merges per region on average in IA32 and ARM bench-marks, which indicates that most regions become stable after few number of merges. The last two columns of Table 2 are percent-age of execution time spent in traces and regions. On averpercent-age, our DBTs spend 72.3% and 58.4% execution time in regions for the IA32 and ARM benchmarks respectively.
5.
Related Works
The choice of optimization unit is critical to achieving good per-formance for Just-In-Time compilation systems. In this section, we categorize the related works of finding hot code region into dy-namic binary translation systems, dydy-namic binary optimization sys-tems, and language virtual machines.
5.1 Dynamic Binary Translation Systems
Dynamic binary translation (DBT) is widely used to support legacy binary code to run on a new architecture such as IA-32EL [4], DAISY [9], and Transmeta [8]. IA32-EL is a process virtual ma-chine that enables IA32 applications to run on Intel Itanium. IA32-EL uses hyper-blocks as its unit of optimization in the hot code translation phase. A hyper block is a set of predicated basic blocks with a single entry and multiple exits. IA32-EL forms hyper blocks based on the execution counts of basic blocks and edge counters collected collected during the cold code execution.
DAISY and Transmeta are system virtual machines, where DAISY supports IBM PowerPC applications to run on VLIW pro-cessors and Transmeta supports IA-32 applications to run on a proprietary VLIW processor. Transmeta did not revealed details about how to find hot code regions. IBM DAISY uses tree groups as the translation unit. Tree groups have a single entry point and multiple exit points. No control flow joins are allowed within a tree group. Control flow joins can only occur on group transitions. Like IA32-EL, DAISY also uses profiling information collected dur-ing interpretation for tree group formation. Both hyper-blocks and tree groups have little advantage to non-VLIW machines, such as
IA32 CINT2006 NET #Traces Avg.Blks 400.perlbench 6646 4.1 401.bzip2 583 3.8 403.gcc 23058 4.0 429.mcf 239 4.7 445.gobmk 9468 2.9 456.hmmer 424 3.8 458.sjeng 1216 3.3 462.libquantum 200 2.5 464.h264ref 2434 3.3 471.omnetpp 2918 5.0 473.astar 613 5.2 483.xalancbmk 4453 5.9 Geometric Mean 3.9 NET∗ #Traces Avg.Blks 8966 5.9 894 5.0 34019 3.9 605 3.5 10961 3.9 687 3.6 1749 4.7 326 2.2 3974 4.3 4859 5.5 942 4.5 8355 4.4 4.2
EEG Merges %Time Spent in
#Regions Avg.Blks Avg. Max Trace Region
1627 13.5 1.6 16 45.3% 51.6% 206 14.4 1.8 6 19.2% 79.4% 2728 12.2 1.6 17 27.1% 37.0% 83 15.1 2.7 5 1.2% 95.3% 2258 13.3 1.7 20 20.9% 71.6% 61 25.5 4.5 6 1.5% 97.8% 764 18.9 2.5 43 15.2% 84.5% 20 8.4 1.8 4 17.6% 82.2% 781 11.9 1.8 11 22.0% 73.3% 345 12.1 1.4 11 29.0% 69.6% 185 24.3 5.3 7 2.3% 96.8% 538 11.4 1.3 12 37.0% 59.1% 14.4 2.1 12.4% 72.3%
ARM CINT2006 NET
#Traces Avg.Blks 400.perlbench 7839 5.1 401.bzip2 672 4.7 403.gcc 24703 3.7 429.mcf 362 3.6 445.gobmk 14175 3.5 456.hmmer 847 4.8 458.sjeng 1299 4.6 462.libquantum 606 8.6 471.omnetpp 4584 3.5 473.astar 959 3.9 483.xalancbmk 4844 5.1 Geometric Mean 4.1 NET* #Traces Avg.Blks 10438 5.1 1125 4.7 36710 3.7 726 3.6 16587 3.5 1378 4.8 1811 4.6 951 8.6 7163 5.1 1432 4.6 8690 3.9 4.6
EEG Merges %Time Spent in
#Regions Avg.Blks Avg. Max Trace Region
1860 12.8 1.6 12 32.9% 62.2% 205 16.4 1.7 5 22.1% 75.0% 2595 12.1 1.5 10 13.1% 32.5% 125 22.3 2.9 6 1.2 % 96.8% 3071 11.9 1.6 19 28.8% 60.9% 58 10.8 1.4 7 52.9% 46.7% 760 14.7 2.5 35 19.8% 79.6% 85 12.0 2.4 11 41.0% 58.4% 364 12.2 1.4 12 57.0% 41.6% 180 13.6 1.6 10 25.6% 72.8% 559 11.9 1.3 8 49.1% 45.9% 13.4 1.7 23.0% 58.4%
Table 2. Statistics of Traces/Regions in NET∗and EEG.
x86 64, since they are primarily designed to maximize instruction-level parallelism in VLIW architectures. Therefore we do not apply their approach in our system.
Moreover, DAISY, Transmeta, and IA32-EL handle early exits with chaining, i.e. the execution directly transfers to another code region. The transition overhead in those systems is not as high as in LnQ because most guest architecture states are mapped to the host architecture in these systems. For example, IA32-EL maps the state of IA-32 guest registers directly to Itanium registers. On the other hand LnQ, a retargetable dynamic binary translator, does not make any assumption about the guest and host ISAs. Consequently LnQ has to load guest states in the prologue of code fragments, and save them back to memory in the exit stubs, which incurs transition overheads.
5.2 Dynamic Optimization Systems
ADORE [18] and Dynamo [3] are same-ISA dynamic binary opti-mizers, which means the input and the output instructions are from the same instruction set architecture. Both ADORE and Dynamo use traces, i.e. super-blocks, as the unit of optimization.
ADORE uses Hardware Performance Monitor (HPM) sampling approach to collect path profiles from the Branch Target Buffer (BTB) hardware performance counters in Itanium. It forms traces based on the collected path profiles. Dynamo was the first trace-based dynamic optimizing compiler that used the Next-Executing-Tail (NET) algorithm. Dynamo pioneered many early concepts of trace formation and trace runtime management. Many DBT systems [6, 7, 13, 25] and just-in-time compilers [10, 16, 26] use NET or its variants to form traces.
StarDBT [25] uses MRET2 [27], which improves NET by in-creasing the completion rate of traces. MRET2 first uses NET to select a potential trace, then it clears block execution counters and restarts NET to select another potential trace. Both potential traces share the same starting address but may have different tails. MRET2 then improves the completion rate by selecting the com-mon path of both potential traces as a hot trace. Hiniker et al. [12] proposed Last-Executed Iteration (LEI) and a trace combination algorithm, which needs to interpret each taken branches to form traces.
The main difference between the proposed EEG and previous works is that EEG expands the existing regions and re-optimizes them during execution. The process of region expansion in EEG can be divided into three stages. The first stage is to decide how to form the initial region. The second stage is to decide when to expand the region. The third stage is to decide which blocks are to be merged. Previous trace formation algorithms, such as LEI and MRET2, could be used in the first stage of EEG to build the initial regions. Therefore, the proposed EEG can be used effectively in most trace-based dynamic binary translators.
5.3 Language Virtual Machines
5.3.1 Method-Based Language Virtual Machines
Region expansion is widely used in method-based JIT systems, e.g., HotSpot Java VM [20]. These JIT systems compile methods as follows. When a method-based JIT system compiles a method for the first time, it only compiles those basic blocks whose execution counts exceed a threshold during interpretation. If the execution frequently leaves a region from side exits, the JIT system expands
this region to include those basic blocks that are the destinations of these side exits.
Our EEG and method-based JIT systems use similar heuristics to decide when to expand regions during the second stage of region expansion, but they are very different in the first stage and the third stage of region expansion in terms of motivation and the type of blocks they merge.
The major difference between EEG and those systems in the first stage is the motivation in forming the initial regions. EEG uses traces as initial regions for two reasons. First, traces represent those frequently executed paths that may span across several methods. Second, it takes less time to optimize traces because of their simple control flow graph and small numbers of basic blocks. For exam-ple, we found only 4.2 blocks per trace in EEG. On the other hand, method-based JIT systems build initial regions by selecting blocks from hot methods, and excluding those blocks that are rarely exe-cuted. For example, HotSpot JVM excludes blocks that are never executed during interpretation.
The major difference between EEG and method-based JIT sys-tems in the third stage is the type of blocks they merge. In the third stage EEG merges traces that contains frequently executed paths. However, in the third stage method-based JIT systems will only merge blocks that are rarely executed in the first stage, since those frequently executed blocks in the first stage have already been merged.
Suganuma et al. [23] investigate how to use region-based com-pilation to improve the performance of method-based Java Just-In-Time compilation. They use region-based compilation to partially inline procedures, instead of using traditional method inlining tech-niques. They collect execution counts of basic blocks in order to understand program runtime behavior, and they apply static code analysis on the Java bytecode to identify those rarely executed code blocks, such as those handle exception. They use these informa-tion to identify and optimize those often executed code blocks only, without optimizing the entire method.
In our case it is difficult to identify those rarely executed regions by a static code analysis, as they did for Java bytecode. Therefore we cannot apply their approach in our system.
5.3.2 Trace-Based Language Virtual Machines
Recently, trace-based compilation has gained popularity in dy-namic scripting languages [5, 10] and high level language virtual machines [11, 16, 17, 26]. Wu et al. [26] and Inoue et al. [16, 17] investigate the performance of several variations of NET on trace-based Java virtual machines.
Gal et al. [10] propose merging loop traces into a trace-tree. Their approach requires adding annotation while compiling JavaScript into bytecode, and thus cannot be applied in our case.
In contrast, our EEG merges delinquent traces/regions, which are not necessarily loop traces. EEG uses hardware monitoring to identify often executed code traces, then determines whether they have many side exits, and finally merges those often executed code regions that have many side exits to avoid early exits from a region, EEG also uses spill index to prevent generating regions which may degrade performance.
6.
Conclusion
We have identified and quantified the delinquent trace problem in the popular Next-Executing-Tail (NET) trace selection algorithm. Delinquent traces contain frequently taken early exits which cause significant overhead. Motivated by this problem, we develop a light-weight region formation strategy called Early-Exit Guided re-gion selection (EEG) to improve the performance of NET by merg-ing delinquent traces into larger code regions. The EEG algorithm
is implemented in two LLVM-based parallel dynamic binary trans-lators (DBT), the IA32-to-x86 64 and ARM-to-x86 64 DBTs.
Experiment results show that EEG achieves performance im-provement of up to 72% (27% on average), and up to 49% (23% on average) in IA32 and ARM SPEC CINT2006 benchmarks respec-tively. The profiling results show that EEG can reduce memory and branches instructions by up to 53% and 37% respectively because the transition overhead among traces is eliminated by merging delinquent traces. It also reduces the L1 instruction cache misses by up to 43.7% in CINT2006 benchmarks.
Acknowledgments
The authors would like to thank Dr. Filip Pizlo at Apple Inc. and the anonymous reviewers for their valuable comments and suggestions to improve the quality of this paper. This work is supported by the National Science Council of Taiwan under grant number NSC99-2221-E-001-003-MY3, NSC99-2221-E-001-004-MY3, and by NSF grant CNS-0834599.
References
[1] Low Level Virtual Machine (LLVM). http://llvm.org. [2] QEMU. http://qemu.org.
[3] V. Bala, E. Duesterwald, and S. Banerjia. Dynamo: a transparent
dynamic optimization system. In PLDI ’00, pages 1–12. ACM, 2000. [4] L. Baraz, T. Devor, O. Etzion, S. Goldenberg, A. Skaletsky, Y. Wang, and Y. Zemach. Ia-32 execution layer: a two-phase dynamic translator designed to support ia-32 applications on itanium-based systems. In MICRO-36, pages 191–201, Dec. 2003.
[5] M. Bebenita, F. Brandner, M. Fahndrich, F. Logozzo, W. Schulte, N. Tillmann, and H. Venter. Spur: a trace-based jit compiler for cil. SIGPLAN Not., 45:708–725, October 2010.
[6] I. Bohm, T. E. von Koch, S. Kyle, B. Franke, and N. Topham. Gen-eralized just-in-time trace compilation using a parallel task farm in a dynamic binary translator. In Proc. PLDI, 2011.
[7] D. Bruening. Efficient, Transparent, and Comprehensive Runtime
Code Manipulation. Ph.d. thesis, Massachusetts Institute of Technol-ogy, Cambridge, MA, Sep 2004.
[8] J. C. Dehnert, B. K. Grant, J. P. Banning, R. Johnson, T. Kistler,
A. Klaiber, and J. Mattson. The transmeta code morphingTMsoftware:
using speculation, recovery, and adaptive retranslation to address real-life challenges. In CGO ’03: Proceedings of the international sympo-sium on Code generation and optimization, pages 15–24, Washington, DC, USA, 2003. IEEE Computer Society.
[9] K. Ebcioglu, E. Altman, M. Gschwind, and S. Sathaye. Dynamic binary translation and optimization. IEEE Trans. Comput., 50(6):529– 548, 2001.
[10] A. Gal, B. Eich, M. Shaver, D. Anderson, D. Mandelin, M. R. Haghighat, B. Kaplan, G. Hoare, B. Zbarsky, J. Orendorff, J. Ru-derman, E. W. Smith, R. Reitmaier, M. Bebenita, M. Chang, and M. Franz. Trace-based just-in-time type specialization for dynamic languages. In PLDI, pages 465–478, 2009.
[11] H. Hayashizaki, P. Wu, H. Inoue, M. J. Serrano, and T. Nakatani. Im-proving the performance of trace-based systems by false loop filtering. In ASPLOS, pages 405–418, 2011.
[12] D. Hiniker, K. Hazelwood, and M. D. Smith. Improving region
selection in dynamic optimization systems. In MICRO 38, pages 141– 154, Washington, DC, USA, 2005. IEEE Computer Society. [13] D.-Y. Hong, C.-C. Hsu, P. Liu, C.-M. Wang, J.-J. Wu, , P.-C. Yew,
and W.-C. Hsu. Hqemu: A multi-threaded and retargetable dynamic binary translator on multicores. In CGO ’12: Proceedings of the 10th annual IEEE/ACM international symposium on Code generation and optimization, 2012.
[14] C.-C. Hsu, P. Liu, C.-M. Wang, J.-J. Wu, D.-Y. Hong, P.-C. Yew,
translators with existing compiler backends. In ICPP, pages 226–234, 2011.
[15] W.-M. W. Hwu, S. A. Mahlke, W. Y. Chen, P. P. Chang, N. J. Warter, R. A. Bringmann, R. G. Ouellette, R. E. Hank, T. Kiyohara, G. E. Haab, J. G. Holm, and D. M. Lavery. The superblock: an effective technique for vliw and superscalar compilation. J. Supercomput., 7(1-2):229–248, May 1993.
[16] H. Inoue, H. Hayashizaki, P. Wu, and T. Nakatani. A trace-based java jit compiler retrofitted from a method-based compiler. In CGO’11, pages 246–256, 2011.
[17] H. Inoue, H. Hayashizaki, P. Wu, and T. Nakatani. Adaptive multi-level compilation in a trace-based java jit compiler. In Proceedings of the ACM international conference on Object oriented programming systems languages and applications, OOPSLA ’12, pages 179–194, New York, NY, USA, 2012. ACM.
[18] J. Lu, H. Chen, P.-C. Yew, and W. chung Hsu. Design and imple-mentation of a lightweight dynamic optimization system. Journal of Instruction-Level Parallelism, 6:2004, 2004.
[19] M. M. Michael and M. L. Scott. Simple, fast, and practical
non-blocking and non-blocking concurrent queue algorithms. In 15th Annual ACM Symposium on Principles of Distributed Computing, 1996. [20] M. Paleczny, C. Vick, and C. Click. The java hotspot(tm) server
com-piler. In In USENIX Java Virtual Machine Research and Technology Symposium, pages 1–12, 2001.
[21] perfmon2. http://perfmon2.sourceforge.net.
[22] J. E. Smith and R. Nair. Virtual Machines: Versatile Platforms for Systems and Processes. Morgan Kaufman, 2005.
[23] T. Suganuma, T. Yasue, and T. Nakatani. A region-based compilation technique for a java just-in-time compiler. In PLDI ’03, pages 312– 323. ACM, 2003.
[24] V. Sundaresan, D. Maier, P. Ramarao, and M. Stoodley. Experiences with multi-threading and dynamic class loading in a java just-in-time compiler. In CGO ’06, pages 87–97, Washington, DC, USA, 2006. IEEE Computer Society.
[25] C. Wang, S. Hu, H.-S. Kim, S. R. Nair, M. B. Jr., Z. Ying, and Y. Wu. Stardbt: An efficient multi-platform dynamic binary translation system. In ACSAC’07, pages 4–15, 2007.
[26] P. Wu, H. Hayashizaki, H. Inoue, and T. Nakatani. Reducing trace se-lection footprint for large-scale java applications without performance loss. In OOPSLA ’11, pages 789–804, New York, NY, USA, 2011. ACM.
[27] C. Zhao, Y. Wu, J. G. Steffan, and C. Amza. Lengthening traces
to improve opportunities for dynamic optimization. In Proceedings of the Workshop on Interaction between Compilers and Computer Architectures, 2008.