The evolution of the coding exome of the Arabidopsis species - the
influences of DNA methylation, relative exon position, and exon length
Feng-Chi Chen1,2,3*, Trees-Juen Chuang4*, Hsuan-Yu Lin1, and Min-Kung Hsu1,2 1Institute of Population Health Sciences, National Health Research Institutes, Taiwan 2Department of Biological Science and Technology, National Chiao-Tung University, Taiwan
3Department of Dentistry, China Medical University, Taiwan 4Genomics Research Center, Academia Sinica, Taiwan *Corresponding authors
Feng-Chi Chen: [email protected]
Trees-Juen Chuang: [email protected] Hsuan-Yu Lin: [email protected]
Min-Kung Hsu: [email protected]
Key words: DNA methylation; exon evolution; evolutionary rate; relative exon
position; exon length
Summary: In the coding sequence of Arabidopsis species, the mutagenic effect of
DNA methylation depends on the relative position and length of the exon. 1 2 3 4 5 6 7 8 9 10 11 12 13 14 15 16 17 18 19 20 21 22 23
Abstract Background
The evolution of the coding exome is a major driving force of functional divergence both between species and between protein isoforms. Exons at different positions in the transcript or in different transcript isoforms may (1) mutate at different rates due to variations in DNA methylation level; and (2) serve distinct biological roles, and thus be differentially targeted by natural selection. Furthermore, intrinsic exonic features, such as exon length, may also affect the evolution of individual exons. Importantly, the evolutionary effects of these intrinsic/extrinsic features may differ significantly between animals and plants. Such inter-lineage differences, however, have not been systematically examined.
Results
Here we examine how DNA methylation at CpG dinucleotides (CpG methylation), in the context of intrinsic exonic features (exon length and relative exon position in the transcript), influences the evolution of coding exons of Arabidopsis thaliana. We observed fairly different evolutionary patterns in A. thaliana as compared with those reported for animals. Firstly, the mutagenic effect of CpG methylation is the strongest for internal exons and the weakest for first exons despite the stringent selective constraints on the former group. Secondly, the mutagenic effect of CpG methylation increases significantly with length in first exons but not in the other two exon groups. Thirdly, CpG methylation level is correlated with evolutionary rates (dS, dN, and the
dN/dS ratio) with markedly different patterns among the three exon groups. The correlations are generally positive, negative, and mixed for first, last, and internal exons, respectively. Fourthly, exon length is a CpG methylation-independent indicator of evolutionary rates, particularly for dN and the dN/dS ratio in last and internal exons.
2 24 25 26 27 28 29 30 31 32 33 34 35 36 37 38 39 40 41 42 43 44 45 46 47 48 49 3
Finally, the evolutionary patterns of coding exons with regard to CpG methylation differ significantly between Arabidopsis species and mammals.
Conclusions
Our results suggest that intrinsic features, including relative exonic position in the transcript and exon length, play an important role in the evolution of A. thaliana coding exons. Furthermore, CpG methylation is correlated with exonic evolutionary rates differentially between A. thaliana and animals, and may have served different biological roles in the two lineages.
50 51 52 53 54 55 56 57 58 59 60
Introduction
The evolution of the coding exome is a major driving force of functional divergence. In the past, a coding gene was considered as a basic unit for biological regulations and molecular functions. As such, in the majority of evolutionary studies, the “functional unit” targeted by natural selection is presumed to be a gene. However, with the advances in molecular biology and high-throughput sequencing technologies, it has gradually become clear that alternative transcript isoforms of the same gene (and the corresponding protein products) can be spatio-temporally regulated, and convey fairly divergent biological functions [1-5]. In other words, in many cases, a “transcript” rather than a “gene” is the biologically functional unit. The importance of transcript isoforms is particularly significant in complex organisms because they have highly developed networks of transcript/protein isoforms [5].
Transcript isoforms of the same gene differ from each other by alternatively spliced exonic regions. In cases where transcript isoforms convey distinct biological functions, the alternatively spliced exonic regions are crucial for the between-isoform functional divergences. These exonic regions should be accordingly targeted by natural selection. Therefore, the biological functions of alternative (and
non-alternative) exonic sequences and the selection pressure thereon can be revealed by examining the evolutionary patterns of these sequences [6-11].
We previously examined the determinants of exonic evolutionary rates in mammals and Arabidopsis species. The biological factors that affect exonic
evolutionary rates were found to differ between these two lineages [6, 7]. In addition, we discovered that in mammals, the position of an exon (first, last, or internal exon) in the transcript is significantly associated with the evolution of the exonic sequence in
4 61 62 63 64 65 66 67 68 69 70 71 72 73 74 75 76 77 78 79 80 81 82 83 84 85 86 7
accordance with the level of DNA methylation at CpG dinucleotides (“CpG
methylation” in short) [12]. This is probably because the position of an exon is related to its biological function (or lack of function), thus making the exon selectively constrained for the function mediated by CpG methylation, or prone to the
mutagenesis effect of CpG methylation [12]. However, whether this proposition is also true for Arabidopsis remains unexplored.
Plant coding exons differ from their mammalian counterparts in several aspects. Firstly, alternative RNA splicing is less well developed, and plays a less important role in exon evolution in plants than in mammals [5, 7]. Secondly, on average, a plant gene includes fewer but longer exons than a mammalian gene [13-15]. Thirdly, the effective population sizes of plants (Arabidopsis thaliana as an example) are
considerably larger than those of mammals (e.g. human and mouse) [16], giving rise to a higher efficiency of natural selection on plant exonic sequences. Given these differences, we expect the evolutionary patterns of Arabidopsis exons at different positions to diverge from those of their mammalian counterparts.
In this study, we systematically examined the mutational effects and of CpG methylation and its correlations with exonic evolutionary rates for A. thaliana coding exons at different positions. Our results indicate that first, last, and internal coding exons of A. thaliana have fairly different evolutionary patterns in this regard. The three exon groups diverge significantly in their liability to CpG methylation-related mutagenesis. Furthermore, the CpG methylation-evolutionary rate correlations differ significantly among the three exon groups. These correlations also differ significantly between Arabidopsis species and mammals. In addition, we found exon length to be a 87 88 89 90 91 92 93 94 95 96 97 98 99 100 101 102 103 104 105 106 107 108 109 110 111
CpG methylation-independent indicator of exonic evolutionary rates in Arabidopsis species. Our results suggest that intrinsic exonic features (relative position and length) may be important determinants for the evolution of A. thaliana coding exons, and that CpG methylation may play different biological roles in the coding exons of mammals and Arabidopsis species.
Results
The mutagenic effect of CpG methylation for exons at different positions
To examine the mutagenic effect of CpG methylation on A. thaliana coding exons, we calculated the Pearson’s coefficient of correlation between the level of CpG methylation (represented by “mCG density”; see Methods) and the CpG O/E ratio (observed-to-expected ratio of the number of CpG dinucleotides, see Methods). Of note, here we do not include methylation at CHG or CHH sites (where “H” indicates A, C, or T) because these two types of methylation account for a minority of the plant methylome [17], and may have minor effects on the evolution of Arabidopsis exons. CpG methylation can significantly increase the rate of cytosine-to-thymine (C-to-T) transitions, leading to a decreased number of CpG dinucleotides. Therefore, mCG density is expected to be negatively correlated with the CpG O/E ratio. Furthermore, a larger absolute value of the coefficient of correlation (r) indicates a stronger
mutagenic effect of DNA methylation [12]. Here the Pearson’s (rather than the Spearman’s) correlation is employed to show this quantitative relationship. Of note, when dealing with the methylome data, we applied a set of filtering criteria to ensure data quality and to reduce variations in the estimation of mCG density (Methods). These filtering criteria lead to differences in the number of analyzable exons among the four methylome datasets (S1~S4 in Table 1). Interestingly, as shown in Figure 1A,
6 112 113 114 115 116 117 118 119 120 121 122 123 124 125 126 127 128 129 130 131 132 133 134 135 136 11
despite the variations in the number of analyzable exons and the level of CpG methylation, mCG density is consistently negatively correlated with the CpG O/E ratio across datasets. And the r value falls within a relatively narrow range (-0.5 ~ -0.4). This observation confirms the mutagenic effect of CpG methylation on A.
thaliana coding exons.
The next question to ask is whether the mutagenic effect of CpG methylation differs for first, last, and internal exons. To address this issue, we evaluated the Pearson’s correlations as described above separately for each of the three exon groups. Unexpectedly, as shown in Figure 1B, although the mCG-CpG O/E correlations remain negative across the three exon groups, the strongest and the weakest mutagenic effect occur, respectively, in internal and first exons. This is to the contrary of what was previously observed for mammals, where the strongest
mutagenic effect of CpG methylation occurs in first exons, while the weakest in internal exons [12].
We then ask how the variation in mCG-related mutagenic effect may have affected the evolutionary rates of the three exon groups. To this end, we first examined the evolutionary rates (dN, dS, and the dN/dS ratio) separately for the three exon groups between A. thaliana and A. lyrata based on datasets S1~S4 (Table 1). The four sperm methylome datasets used here are appropriate for this evolutionary analysis because only the mutations that occur in germ line cells can be propagated over generations, thus leaving observable changes in the inter-species comparison. Figure 2 shows that among the three exon groups, first exons have the largest median
dN and dN/dS ratio, followed by last exons, and finally by internal exons (although the 137 138 139 140 141 142 143 144 145 146 147 148 149 150 151 152 153 154 155 156 157 158 159 160 161
last-internal differences in dN/dS are statistically insignificant in S1 and S3). For dS, internal exons have the lowest median value, and first and last exons have similar values.
The evolutionary rate profiles apparently are inconsistent with the mCG-related mutagenic effect profiles in first, last, and internal exons. Specifically, in internal exons, we observe the co-occurrence of a high median mCG density (Additional File 1), a strong mutagenic effect of CpG methylation (Figure 1B), and low evolutionary rates as compared with the other two exon groups (Figure 2). One possible
explanation is that the strong selection pressure imposed on internal exons has significantly constrained the mCG-related mutations from occurring in this exon group. This appears to be true judging from the low dN/dS ratio in internal exons as compared with the other two exon groups (Figure 2). Interestingly, the median dS is also the lowest in internal exons, suggesting that synonymous substitutions are subject to strong purifying selection in this exon group.
The correlations between CpG methylation and exonic evolutionary rates
To investigate in more details the correlations between CpG methylation and exonic evolutionary rates, we evaluated Spearman’s correlations between mCG density and each of the three evolutionary measurements (dN, dS and the dN/dS ratio) separately for the four sperm methylome datasets. Figure 3 shows that for first exons, mCG density has weak positive correlations with dN, dS and the dN/dS ratio. This observation suggests that the mutagenic effect of CpG methylation influences both synonymous and nonsynonymous sites in first exons, but the effects may be relatively small. For last exons, the Spearman’s coefficients of correlation (ρ) are consistently negative between mCG density and each of dN, dS, and the dN/dS ratio across datasets.
8 162 163 164 165 166 167 168 169 170 171 172 173 174 175 176 177 178 179 180 181 182 183 184 185 186 187 15
This observation is somewhat surprising because a negative mCG density-dN (or mCG density-dS) correlation indicates that a higher level of CpG methylation is
accompanied with a reduced rate of sequence evolution. In mammals, by comparison, the mCG density-dS correlation is positive, while the mCG density-dN and mCG density-dN/dS correlations are negative in last exons [12]. Meanwhile, for internal exons, the mCG density-dS correlations are consistently negative across datasets. However, the mCG density-dN correlations are weakly negative in this exon group. Unexpectedly, the mCG density-dN/dS ratio correlations are positive in internal exons. These observations appear to suggest that the synonymous sites in internal exons are subject to certain mCG-associated selective constraints, thus heavily methylated exons tend to have lower dS values. However, such selective constraints may be weaker for the nonsynonymous sites in the same exonic regions. The decrease in dS and the relative stasis in dN lead to the increase in the dN/dS ratio as mCG density increases in internal exons (Figure 3). These results also differ from what were reported for mammals, where the mCG density-dS correlation is positive, and the mCG- dN and mCG density-dN/dS ratio correlations are both negative in internal exons [12]. The differences in the mCG density-evolutionary rate correlations between A.
thaliana and mammals suggest that the biological roles of CpG methylation may have
diverged between the two lineages. We also conducted the same analyses while controlling for four potential confounding factors (CpG density, G+C content, exon length, constitutive (CSE) or alternative exon (ASE) type) [12]. The results remain virtually the same (Additional File 2).
The associations between exon length and exonic sequence evolution
We have shown that the mCG density-CpG O/E correlation is the most marked 188 189 190 191 192 193 194 195 196 197 198 199 200 201 202 203 204 205 206 207 208 209 210 211 212
in internal exons. One important question is whether this observation has actually resulted from certain sampling biases. We noticed that our filtering criteria for dealing with the methylome data (e.g. the exon must contain >= 10 sampled CpGs; see Methods) tend to retain longer exons in the datasets. The average lengths of the selected exons in S1~S4 range from 615.8 to 783.5 base pairs (bp), which are considerably longer than the previously reported exome-wide average of ~250 bp in
A. thaliana [15] and the background value (282.9 bp) in this study (Table 1). To
investigate whether exon length has affected our results, we divided each of the methylome datasets (S1~S4) further into five subgroups of approximately equal sizes according to exon length, and evaluated the mCG density-CpG O/E correlations separately for first, last, and internal exons for each length subgroup. Surprisingly, as shown in Figure 4, first exons show a clear length-dependent decrease in the r value between mCG density and the CpG O/E ratio, indicating stronger mutagenic effects of CpG methylation on longer first exons. By comparison, internal and last exons do not show similarly clear trends.
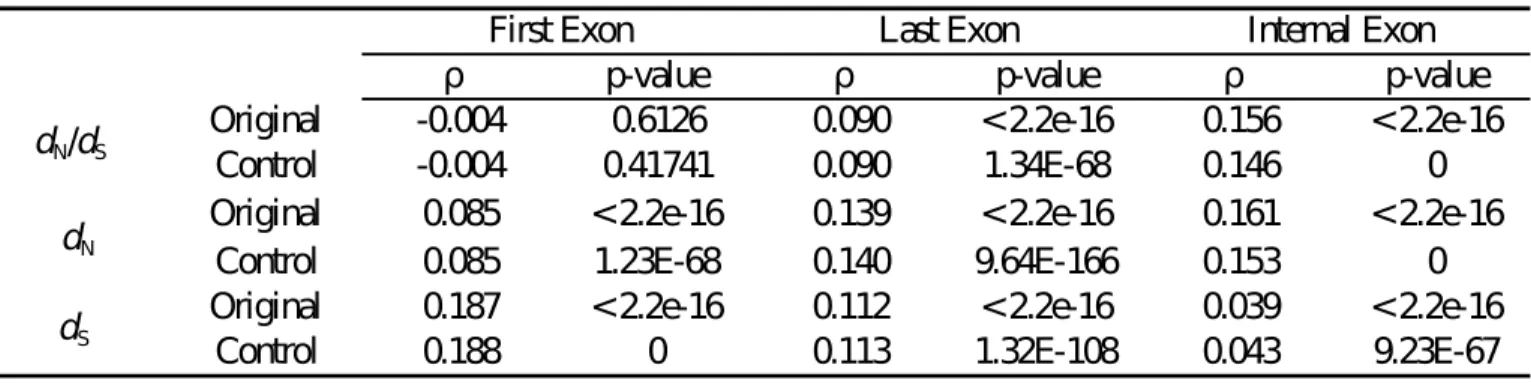
Since exon length is related to the mutagenic effect of CpG methylation, we then ask whether exon length is correlated with the evolutionary rates of first, last, and internal exons. Accordingly, we evaluated Spearman’s correlations between exon length and dN, dS, and the dN/dS ratio separately for the three exon groups. Of note, here we take the background dataset (Table 1) instead of the methylome datasets to avoid potential sampling biases. Interestingly, Table 2 (“Original”) shows that for first exons, exon length is significantly correlated with both dN and dS, although the ρ value is smaller in the exon length-dN correlation. Meanwhile, the exon length-dN/dS ratio correlation is statistically insignificant for this exon group. This observation seems to
10 213 214 215 216 217 218 219 220 221 222 223 224 225 226 227 228 229 230 231 232 233 234 235 236 237 19
suggest that the increased mutagenic effect of CpG methylation (Figure 4) in longer exons has led to increases in both dN and dS in this exon group. This conjecture, however, is only partly true, as will be shown later. Meanwhile, for last and internal exons, the correlations between exon length and the three evolutionary measurements are all statistically significant. Yet a noteworthy difference between last and internal exons is that the ρ value of the exon length-dN correlation is about four times larger than that of the exon length-dS correlation for internal exons. This difference in ρ value is smaller in last exons.
The above observations may be confounded by other biological factors. For example, ASEs are known to have increased dN and the dN/dS ratios as compared with CSEs [8, 10, 18, 19]. Therefore, the increase in dN and the dN/dS ratio in longer exons might have resulted from an increase in the proportion of ASEs. Meanwhile, the proportion of repetitive elements (in terms of length) is also correlated with
evolutionary rates because these elements are subject to relaxed selective constraints [20]. Similar comments also apply to intrinsically disordered protein regions [21-23]. The next factor to consider is exonic expression level, which has been shown to be an important determinant of dN and the dN/dS ratio [6, 7]. We thus conducted partial Spearman’s correlation analyses while simultaneously controlling all of these four factors (the ASE/CSE exon type, proportion of repetitive elements/disordered regions, and exonic expression level). As shown in Table 2 (“Control”), the results remain virtually the same.
The last but a critical factor to control is the level of CpG methylation. To evaluate the influence of CpG methylation, we have to employ the sperm methylome 238 239 240 241 242 243 244 245 246 247 248 249 250 251 252 253 254 255 256 257 258 259 260 261 262
datasets (S1~S4), which include considerably fewer but longer exons as compared with the background dataset (Table 1). Using the four sperm methylome datasets, we again conducted partial Spearman’s correlation analysis between exon length and evolutionary rates while simultaneously controlling for mCG density, ASE/CSE exon type, proportion of repetitive elements/disordered region, and exonic expression level. As shown in Additional File 3, for first exons, the results are similar but the ρ values are decreased. This observation indicates that the length dependence of mCG-related mutagenic effect in first exons (Figure 4) accounts for part but not all of the length dependence of dN and dS in this exon group. Meanwhile, for last exons, the exon length-dS correlation becomes statistically insignificant in S2 and S4, whereas the exon length-dN and the exon length-dN/dS correlations remain statistically significant with decreased ρ values. These results imply that mCG-related mutations may account for part of the length dependence of dS, dN, and the dN/dS ratio in last exons. However, the decreases in ρ value and the level of statistical significance may also be ascribable to the decrease in sample size and the bias in exon length. By comparison, for internal exons, all of the correlations remain statistically significant with two notable changes as compared with the results in Table 2: (1) the ρ values of the exon length-dN and the exon length-dN/dS correlations are increased; and (2) the ρ values of the exon length-dS correlations turn negative. Therefore, for internal exons, mCG-related mutations appear to be an important factor affecting dS. Nevertheless, mCG-related mutations cannot explain the length dependence of dN and the dN/dS ratio in this exon groups.
Taken together, our results indicate that the correlations between exon length and the evolutionary measurements (dN, dS and the dN/dS ratio) are unaffected by the ASE/CSE exon type, proportion of repetitive elements/disordered region, and exonic
12 263 264 265 266 267 268 269 270 271 272 273 274 275 276 277 278 279 280 281 282 283 284 285 286 287 23
expression level in any of the three exon groups. However, the level of CpG methylation may account for part of the exon length-evolutionary rate correlations differentially for first, last, and internal exons. In summary, exon length appears to be a CpG methylation-independent indicator for dN in all of the three exon groups, and for the dN/dS ratio in last and internal exons of A. thaliana.
Discussion
We have shown that for the coding sequences of A. thaliana, the mutagenic effects of CpG methylation differ between exons at different relative positions. Among the three compared exon groups (first, last, and internal), the highest CpG methylation level and the strongest mutagenic effect of CpG methylation both occur in internal coding exons (Figure 1 and Additional File 1) despite the most stringent selective constraint (lowest dN/dS ratio) on this exon group (Figure 2). First coding exons, quite to the opposite, have the lowest level of CpG methylation and suffer the weakest mutagenic effect of CpG methylation, yet evolve the most rapidly.
Interestingly, we show that mCG density is (weakly) positively correlated with dS, dN, and dN/dS ratio in first exons, yet the same correlations are significantly negative for last exons. For internal exons, the correlations are negative, weakly negative, and positive for dS, dN, and dN/dS ratio, respectively (Figure 4 and Additional File 2). The mutagenic effect of CpG methylation cannot fully explain these observations. Apparently, selection pressure has played a major role here. We have previously reported that in mammals, CpG methylation may have different biological roles in first, last, and internal coding exons [12]. Similar comments may also apply to
Arabidopsis species – that first exons are more liable to the mutagenic effects, yet the
other two exon groups are more affected by the regulatory functions of CpG 288 289 290 291 292 293 294 295 296 297 298 299 300 301 302 303 304 305 306 307 308 309 310 311 312
methylation. Noticeably, however, the correlations between mCG density and evolutionary rates actually diverge significantly between Arabidopsis species and mammals [12]. One riveting difference is that for internal exons, the mCG density-dS and mCG density-dN/dS correlations are quite to the opposite between the two
lineages. Such divergences appear to suggest that the biological roles of CpG methylation in coding exons have diverged significantly between the two lineages.
We also report here that exon length is an indicator of evolutionary rates of coding exons in Arabidopsis species. And this is not confounded by the ASE/CSE exon type, the proportion of repetitive elements, the proportion of intrinsically disordered regions, or exonic expression level. One may suspect that this observation has resulted from alignment errors, leading to increased dN and dN/dS ratios in longer exons. However, this is unlikely to be the case for two reasons. Firstly, the compared species - A. thaliana and A. lyrata - are very closely related. The median dN value of first exons (which evolve the most rapidly among the three groups) is smaller than 0.03 (Figure 2). Alignment errors may be a minor issue for sequence pairs with such a high level of similarity. Secondly, the length dependence of dN and dN/dS ratio is unlikely to result from the alignment between paralogous exonic sequences. This is because to observe such length dependence, we should have systematically aligned orthologous sequences for shorter exons but paralogous sequences for longer exons. We perceive no possible reasons why this may happen. Another possible explanation for the length dependence of dN and dN/dS ratio is annotation error. However, this may not be a major problem judging from the small evolutionary rates as shown in Figure 2. 14 313 314 315 316 317 318 319 320 321 322 323 324 325 326 327 328 329 330 331 332 333 334 335 336 337 27
The coding exons of animal and plant genes differ from each other in a number of biological features. One example is microRNA (miRNA) targeting sites. Previous studies have reported that genes targeted by more miRNAs tend to be under stronger selective constraints [24-26]. A recent study indicated that in mammals,
approximately 2% of the synonymous sites were selectively constrained for such regulatory sequences as splicing motifs, enhancers, and miRNA target sites [27]. For
A. thaliana, it was predicted that ~75% of miRNA target sites were located in CDS
[28]. In comparison, only 53.4% and 56.5% of miRNA targets were predicted to reside in CDS in human and mouse, respectively [29]. One important question is whether differential miRNA targeting is the true reason for the differences in the mCG density-evolutionary rate correlations between Arabidopsis species and mammals (Figure 3, [12]). Recall that the differences between the two lineages lie mainly in the mCG density-dS correlations in internal and last exons. These
correlations are significantly positive in mammals but negative in Arabidopsis. This divergence implies that for internal and last exons in mammals, the principal
biological role of mCG is mutagenesis. In Arabidopsis, however, mCG density may be associated with other selection-constrained biological functions. If the divergence in mCG density-dS correlations is to be ascribed to the higher proportion of miRNA target sites in the CDS of Arabidopsis, three prerequisites should be fulfilled: (1) in the internal and last exons of Arabidopsis, mCG density must be positively correlated with the probability of miRNA targeting; (2) miRNA targeting must be significantly constrained by selection in the two exon groups of Arabidopsis; and (3) this miRNA targeting-related selection affects only synonymous sites in internal and last exons of
Arabidopsis. An example of miRNA-mediated DNA methylation has been reported
for rice [30]. The authors discovered that a specific group of 24-nucleotide (nt) 338 339 340 341 342 343 344 345 346 347 348 349 350 351 352 353 354 355 356 357 358 359 360 361 362
miRNAs could mediate DNA methylation within a ~80-nt region around the target sites. However, only five such targets were identified. And most of the methylation occurred in the CHH or CHG context [30]. A follow-up study published lately showed that 65 of 24-nt miRNAs exhibited elevated CHH methylation (but not CpG methylation) around their target sites [31]. These studies imply that miRNA targeting may lead to an increased level of DNA methylation in the gene body of plants (which, in fact, was also observed in human [32]). Of note, nevertheless, each miRNA was predicted to have only one target site in the target gene. Furthermore, only 13 of the 65 target sites were located in CDS [31]. Meanwhile, a recent study suggested that the miRNA target sites in CDS were subject to negative selection [33]. These
observations seem to suggest a connection between miRNA targeting and the mCG density-dS correlations in plants. However, we speculate that the influences of miRNA targeting might be insubstantial for three reasons. First, only a relatively small number (tens) of miRNAs have been reported to cause DNA methylation at the target sites. And most of them occur outside of CDS. miRNA-mediated methylation in CDS thus may be uncommon. Second, the sequences that are subject to miRNA-mediated methylation account for a minority (~80 nt [30] or ~200 nt [31]) in light of the
average CDS length of ~1300 bp in the A. thaliana genome [15]. Certainly, we cannot exclude the possibility that a methylation-inducing miRNA has multiple target sites in one gene, or that a gene is targeted by multiple methylation-inducing miRNAs. In such cases, the effects of miRNA targeting will undoubtedly be non-negligible. Nevertheless, these scenarios were not observed in the recent studies [30, 31]. The overall influences of miRNA targeting on CDS methylation thus might be immaterial. Third, the identified miRNA-mediated DNA methylation occurred mostly in the CHH or CHG contexts [30, 31]. Since we focus on methylation at CpG dinucleotides, the
16 363 364 365 366 367 368 369 370 371 372 373 374 375 376 377 378 379 380 381 382 383 384 385 386 387 31
influences of miRNA-mediated methylation on our analysis should be fairly limited.
Another potential confounding factor in the mCG density-evolutionary rate analysis is the level of protein phosphorylation. Phosphorylated amino acid residues have been known to evolve more slowly than those unphosphorylated [34-37]. Since the motifs for phosphorylation differ between Arabidopsis and mammals [38, 39], the evolutionary rates of coding exons in the two lineages may be differentially affected by phosphorylation-related constraints. However, phosphorylation occurs at amino acid residues. The selective constraints at the amino acid level influence dN but not dS. Note that the mCG density-dN correlations are generally similar between mammals and Arabidopsis (Figure 3, [12]). Therefore, phosphorylation appears to have no significant effects on the differences in the mCG density-dN correlations between the two lineages.
One may suspect that the correlations between exon length and dN and dN/dS ratio have resulted from functional biases. This is because exons of different lengths may belong to genes of different functional categories. To examine this possibility, we divided the background dataset (Table 1) into five length subgroups and conducted an all-to-all pairwise comparison of gene ontology functional categories between the five subgroups of internal exons using FatiGO [40]. As shown in Additional File 4, although the five length subgroups of internal exons differ from one another in view of gene ontology annotations, we do not observe any particular trend that may cause the length dependence of dN and dN/dS ratio. We also examined whether the
correlations between mCG density and evolutionary rate could differ between different functional categories. We classified the analyzed genes according to the 388 389 390 391 392 393 394 395 396 397 398 399 400 401 402 403 404 405 406 407 408 409 410 411 412
third level of “Molecular Function” of Gene Ontology, and calculated the
correlations for nine functional groups that included ≥ 1000 genes. Note that one gene can be assigned to multiple functional groups. The sum of genes in all of the functional groups thus outnumbers the analyzed genes. The mCG
density-evolutionary rate correlations in individual functional groups are similar to what we observed in Figure 3 (Additional File 5). Therefore, functional bias may not be a major concern in our analysis.
The correlations between exon length and evolutionary rates in Arabidopsis species have been previously observed [7]. However, the underlying mechanism remains unclear. Here we show that first, last, and internal coding exons diverge from each other in terms of the exon length-dN/dS ratio correlation – the correlation is stronger in internal exons than in last exons, and is statistically insignificant in first exons. The length dependence of dN/dS ratio in last and internal exons remains statistically significant after controlling for potential confounding factors (the ASE/CSE exon type, the content of repetitive elements/disordered region, exonic expression level, and the level of CpG methylation). Of note, for last and internal exons, this length dependence occurs because longer exons have a larger increase in
dN than in dS when compared with shorter exons. This increase in dN is probably unrelated to structural-functional reasons, for the proportion of disordered protein region (which is an indicator of protein structural flexibility and is strongly
associated with the content of protein domains) does not significantly affect the exon length-dN/dS ratio correlations. It will be interesting to test the evolutionary neutrality of exons of different lengths when adequate polymorphism data become available.
18 413 414 415 416 417 418 419 420 421 422 423 424 425 426 427 428 429 430 431 432 433 434 435 436 437 35
Meanwhile, it has been recently reported that in human, transcription factor binding sites (TFBS) frequently reside in coding exons, and may significantly affect the evolution of these exonic sequences [41]. The same comment may also apply to
A. thaliana. However, currently no base-resolution TFBS datasets are available for A. thaliana. We may revisit this issue and investigate whether the density of TFBS is
associated with the observed length dependence of dN and dN/dS ratio when such datasets are accessible.
One important issue is that we analyzed only one plant species in this study. Whether the observations in A. thaliana can be applied to other plant species remains unknown. To address this issue, we retrieved three genome-scale methylome datasets of rice (Oryza sativa L. ssp. japonica). Two of the datasets were derived from young panicles [42], and the other was derived from leaves [43] (Additional File 6). Our analysis confirmed the mutagenic effect of mCG on coding exons and the stronger mutagenic effect on non-first exons than on first exons in rice (Addition File 7). The evolutionary rates of first, last, and internal exons were similar to what we observed in
A. thaliana (Additional File 8). Intriguingly, however, the correlations between mCG
density and evolutionary rates were fairly different between rice (Additional File 9) and A. thaliana (Figure 3). Particularly, in view of the mCG density-dS correlations in last and internal exons, rice was similar to mammals [12] but not to A. thaliana. Of note, the rice methylome data were derived from panicles and leaves but not gamete cells. Whether the identified mCGs and the associated substitutions are heritable is therefore questionable. To be sure, we cannot rule out the possibility that the differences in mCG density-dS correlations between A. thaliana and rice represent genuine divergences in the biological roles of mCG. Adding to the complexity of this 438 439 440 441 442 443 444 445 446 447 448 449 450 451 452 453 454 455 456 457 458 459 460 461 462
issue is that the domesticated rice (O. japonica) has been artificially selected. It will be interesting to re-examine this topic when the gamete methylome datasets of both cultivated and wild rice are available.
Conclusions
The mammal-Arabidopsis divergence in the association between DNA
methylation and coding exon evolution is unexpected. DNA methylation is a major source of genomic sequence mutation on one hand, and an important
transcriptional/splicing regulator on the other hand. Our results imply that this balance between biological roles of DNA methylation in coding exons may have differed significant between Arabidopsis and mammals in a length- and position-dependent manner. The detailed evolutionary mechanisms and functional outcomes are worth further explorations.
Methods
Measurement of CpG methylationlevel and the CpG O/E
The genome-scale, single base-resolution DNA methylation datasets of A.
thaliana sperm were retrieved from a recent study [44] under accession number
SRX156133 (Table 1). The bisulfite sequence reads were mapped to the genome of A.
thaliana (TAIR10), and the methylated CpGs being identified by BS-Seeker [45] with
default parameters. To ensure data quality, only the CpG dinucleotides that are covered by 5 bisulfite reads were retained (such CpG dinucleotides are designated as “sampled CpGs”). The methylation status of a CpG was represented as the percentage of reads that support the methylation of this CpG site. Only the CpGs with a
methylation frequency of 80% were regarded as methylated [46, 47], and designated as “mCGs”. Since the accuracy of evolutionary rate estimates may be compromised in
20 463 464 465 466 467 468 469 470 471 472 473 474 475 476 477 478 479 480 481 482 483 484 485 486 487 488 39
the case of short exons (e.g., <50 bp) [18, 21, 48], we only considered the CDSs that are longer than 80 bp and contain 10 sampled CpGs to ensure that the CDSs contain sufficient information.Here we focus on CpG methylation because the other types (CHG and CHH) of methylation are relatively rare [17], and may have only minor effects on the evolution of Arabidopsis exons.
The level of CpG methylation of a particular exonic region was represented by the “mCG density”, which was measured by calculating the number of mCGs per 100 CpG dinucleotides, and was defined as
mCG density =
number of mCGs×100
number of all CpGs sampled
.The CpG O/E was defined as
CpG O/E = ¿ PCpG
PC×PG=
number of observed CpG×exon length
number of C×number of G , where PCpG, PC,
and PG represent the frequency of CpG dinucleotides, C nucleotides, and G nucleotides, respectively.
Classification of coding exons
The A. thaliana gene annotations and the corresponding coding sequences were downloaded from the Ensembl genome browser at http://www.ensembl.org/. The CDSs that overlap with non-coding RNAs or pseudogenes were excluded. Single-exon genes were also excluded. According to the relative positions of Single-exons in the Ensembl-annotated genes, the retrieved coding exonic regions were divided into three groups: first, internal, and last exons.Briefly, all of the transcript isoforms of a gene 489 490 491 492 493 494 495 496 497 498 499 500 501 502 503 504 505 506 507 508 509 510 511 512
were collated (except for those that overlapped non-coding RNAs or pseudogenes), and the coordinates of the exons were compared. The coding exon that was closest to the most downstream 5’UTR and the most upstream 3’UTR was classified as the first and last coding exon, respectively. However, in the case where a stand-alone 5’UTR exon was followed by a second 5’UTR juxtaposed to a coding exon, this coding exon was excluded. This is because in this case, the first coding exon is not part of the most upstream exonic region. The same comment also applied to the last exon. The
remaining exons that were neither first nor last coding exons were considered as internal exons. The retrieved exons were also classified into constitutively and alternatively spliced exons (CSEs and ASEs, respectively) according to whether they were always present in different transcript isoforms of a gene.
Measurement of exonic expression level
The transcriptome data for A. thaliana pollen derived from a recent study [49] were retrieved from the Gene Expression Omnibus database under accession number SRP022162. The sequencing reads were mapped to the A. thaliana genome by using TopHat 2 [50], and then analyzed by using eXpress [51] to obtain exonic expression levels.
Predictions of intrinsically disordered regions and repetitive elements
The genomic and peptide sequences of A. thaliana retrieved from the ENSEMBL Plants website were submitted to RepeatMasker [52] and Disopred [53], respectively, for predictions of repetitive elements and intrinsically disordered regions. The
prediction tools were applied with default parameters. The proportions of exonic regions that overlapped repetitive elements and disordered regions were then calculated separately. 22 513 514 515 516 517 518 519 520 521 522 523 524 525 526 527 528 529 530 531 532 533 534 535 536 537 538 43
Calculation of evolutionary rates
The one-to-one gene orthology between A. thaliana and A. lyrata was retrieved from ENSEMBL Plants (Version 18). The protein sequences of the orthologous genes were aligned using MUSCLE [54] and then back-translated to nucleotide sequences. The aligned sequences were then separated exon-wise according to the annotations of ENSEMBL. The exonic sequence alignments were checked for the correctness of reading frame before being submitted to the CodeML program of PAML4 [55] for the calculations of dN, dS and the dN/dS ratio.
List of abbreviations
ASE: alternative exon CDS: coding sequence
CpG methylation: the level of DNA methylation at CpG dinucleotides
CpG O/E ratio: the observed-to-expected ratio of the number of CpG dinucleotides CSE: constitutive exon
dN: nonsynonymous substitution rate
dS: synonymous substitution rate mCG: methylated CpG dinucleotide TFBS: transcription factor binding site UTR: untranslated region
Competing interests
The authors declare that they have no competing interests.
Author contributions 539 540 541 542 543 544 545 546 547 548 549 550 551 552 553 554 555 556 557 558 559 560 561 562 563 564
Conceived the study: FCC; designed the research: FCC; conducted data collection and analysis: HYL and MKH; data interpretation: FCC and TJC; wrote the manuscript: FCC and TJC.
Acknowledgements
We thank Dr. Pao-Yang Chen and Mr. Wen-Wei Liao at Academia Sinica, and Dr. Wen Wang and Xin Li at the Kunming Institute of Zoology for technical assistance in processing the methylome data. We are also grateful for Dr. Ben-Yang Liao for constructive comments. This study was supported by the Ministry of Science and Technology under contract number 102-2311-B-400-003 (to FCC) and NSC-102-2621-B-001-003 (to TJC). 24 565 566 567 568 569 570 571 572 573 574 575 576 577 578 47
References
1. Kelemen O, Convertini P, Zhang Z, Wen Y, Shen M, Falaleeva M, Stamm S:
Function of alternative splicing. Gene 2013, 514(1):1-30.
2. Singh RK, Cooper TA: Pre-mRNA splicing in disease and therapeutics. Trends
in molecular medicine 2012, 18(8):472-482.
3. Carvalho RF, Feijao CV, Duque P: On the physiological significance of
alternative splicing events in higher plants. Protoplasma 2012, [Epub ahead of print].
4. Kalsotra A, Cooper TA: Functional consequences of developmentally
regulated alternative splicing. Nature reviews Genetics 2011, 12(10):715-729.
5. Keren H, Lev-Maor G, Ast G: Alternative splicing and evolution:
diversification, exon definition and function. Nature reviews Genetics 2010, 11(5):345-355.
6. Chen FC, Liao BY, Pan CL, Lin HY, Chang AY: Assessing determinants of exonic
evolutionary rates in mammals. Molecular biology and evolution 2012, 29(10):3121-3129.
7. Wu GC, Chen FC: Determinants of exon-level evolutionary rates in
Arabidopsis species. Evolutionary bioinformatics online 2012, 8:389-415.
8. Chen FC, Chaw SM, Tzeng YH, Wang SS, Chuang TJ: Opposite evolutionary
effects between different alternative splicing patterns. Molecular biology
and evolution 2007, 24(7):1443-1446.
9. Chen FC, Chen CJ, Ho JY, Chuang TJ: Identification and evolutionary analysis
of novel exons and alternative splicing events using cross-species EST-to-genome comparisons in human, mouse and rat. BMC bioinformatics 2006, 7:136.
10. Chen FC, Chuang TJ: Different alternative splicing patterns are subject to
opposite selection pressure for protein reading frame preservation. BMC
evolutionary biology 2007, 7(1):179.
11. Gelly JC, Lin HY, de Brevern AG, Chuang TJ, Chen FC: Selective constraint on
human pre-mRNA splicing by protein structural properties. Genome biology
and evolution 2012, 4(9):966-975.
12. Chuang TJ, Chen FC, Chen YZ: Position-dependent correlations between DNA
methylation and the evolutionary rates of mammalian coding exons.
Proceedings of the National Academy of Sciences of the United States of America 2012, 109(39):15841-15846.
13. Mouse Genome Sequence Consortium: Initial sequencing and comparative
analysis of the mouse genome. Nature 2002, 420(6915):520-562.
579 580 581 582 583 584 585 586 587 588 589 590 591 592 593 594 595 596 597 598 599 600 601 602 603 604 605 606 607 608 609 610 611 612 613 614 615
14. Lander ES, Linton LM, Birren B, Nusbaum C, Zody MC, Baldwin J, Devon K, Dewar K, Doyle M, FitzHugh W, Funke R, Gage D, Harris K, Heaford A,
Howland J, Kann L, Lehoczky J, LeVine R, McEwan P, McKernan K, Meldrim J, Mesirov JP, Miranda C, Morris W, Naylor J, Raymond C, Rosetti M, Santos R, Sheridan A, Sougnez C et al: Initial sequencing and analysis of the human
genome. Nature 2001, 409(6822):860-921.
15. Arabidopsis Genome Initiative: Analysis of the genome sequence of the
flowering plant Arabidopsis thaliana. Nature 2000, 408(6814):796-815.
16. Gossmann TI, Woolfit M, Eyre-Walker A: Quantifying the variation in the
effective population size within a genome. Genetics 2011, 189(4):1389-1402.
17. Cokus SJ, Feng S, Zhang X, Chen Z, Merriman B, Haudenschild CD, Pradhan S, Nelson SF, Pellegrini M, Jacobsen SE: Shotgun bisulphite sequencing of the
Arabidopsis genome reveals DNA methylation patterning. Nature 2008, 452(7184):215-219.
18. Chen FC, Chuang TJ: The effects of multiple features of alternatively spliced
exons on the K(A)/K(S) ratio test. BMC bioinformatics 2006, 7:259.
19. Chen FC, Wang SS, Chen CJ, Li WH, Chuang TJ: Alternatively and
constitutively spliced exons are subject to different evolutionary forces.
Molecular biology and evolution 2006, 23(3):675-682.
20. Graur D, Li W-H: Fundamentals of molecular evolution, second edition edn. Sunderland, Massachusetts: Sinauer Associates; 2000.
21. Chen FC, Pan CL, Lin HY: Independent effects of alternative splicing and
structural constraint on the evolution of mammalian coding exons.
Molecular biology and evolution 2011, 29(1):187-193.
22. Brown CJ, Johnson AK, Daughdrill GW: Comparing models of evolution for
ordered and disordered proteins. Molecular biology and evolution 2010, 27(3):609-621.
23. Brown CJ, Takayama S, Campen AM, Vise P, Marshall TW, Oldfield CJ, Williams CJ, Dunker AK: Evolutionary rate heterogeneity in proteins with long
disordered regions. Journal of molecular evolution 2002, 55(1):104-110.
24. Cheng C, Bhardwaj N, Gerstein M: The relationship between the evolution of
microRNA targets and the length of their UTRs. BMC genomics 2009, 10:431.
25. Chen SC, Chuang TJ, Li WH: The relationships among microRNA regulation,
intrinsically disordered regions, and other indicators of protein evolutionary rate. Molecular biology and evolution 2011, 28(9):2513-2520.
26. Chen YC, Cheng JH, Tsai ZT, Tsai HK, Chuang TJ: The impact of trans-regulation
on the evolutionary rates of metazoan proteins. Nucleic acids research 2013, 41(13):6371-6380. 26 616 617 618 619 620 621 622 623 624 625 626 627 628 629 630 631 632 633 634 635 636 637 638 639 640 641 642 643 644 645 646 647 648 649 650 651 652 653 51
27. Lin MF, Kheradpour P, Washietl S, Parker BJ, Pedersen JS, Kellis M: Locating
protein-coding sequences under selection for additional, overlapping functions in 29 mammalian genomes. Genome research 2011,
21(11):1916-1928.
28. Ding J, Li D, Ohler U, Guan J, Zhou S: Genome-wide search for miRNA-target
interactions in Arabidopsis thaliana with an integrated approach. BMC
genomics 2012, 13 Suppl 3:S3.
29. Dweep H, Sticht C, Pandey P, Gretz N: miRWalk--database: prediction of
possible miRNA binding sites by "walking" the genes of three genomes.
Journal of biomedical informatics 2011, 44(5):839-847.
30. Wu L, Zhou H, Zhang Q, Zhang J, Ni F, Liu C, Qi Y: DNA methylation mediated
by a microRNA pathway. Molecular cell 2010, 38(3):465-475.
31. Hu W, Wang T, Xu J, Li H: MicroRNA mediates DNA methylation of target
genes. Biochemical and biophysical research communications 2014, 444(4):676-681.
32. Chuang TJ, Chiang TW: Pre-transcriptional DNA Methylation, Transcriptional
Transcription Factor and Post-transcriptional microRNA Regulations on Protein Evolutionary Rate. Genome biology and evolution 2014, In press.
33. Fang Z, Rajewsky N: The impact of miRNA target sites in coding sequences
and in 3'UTRs. PLOS ONE 2011, 6(3):e18067.
34. Chen SC, Chen FC, Li WH: Phosphorylated and nonphosphorylated serine
and threonine residues evolve at different rates in mammals. Molecular
biology and evolution 2010, 27(11):2548-2554.
35. Aivaliotis M, Macek B, Gnad F, Reichelt P, Mann M, Oesterhelt D: Ser/Thr/Tyr
protein phosphorylation in the archaeon Halobacterium salinarum--a representative of the third domain of life. PLOS ONE 2009, 4(3):e4777.
36. Levy ED, Michnick SW, Landry CR: Protein abundance is key to distinguish
promiscuous from functional phosphorylation based on evolutionary information. Philosophical transactions of the Royal Society of London Series
B, Biological sciences 2012, 367(1602):2594-2606.
37. Freschi L, Osseni M, Landry CR: Functional divergence and evolutionary
turnover in mammalian phosphoproteomes. PLoS genetics 2014, 10(1):e1004062.
38. Villen J, Beausoleil SA, Gerber SA, Gygi SP: Large-scale phosphorylation
analysis of mouse liver. Proceedings of the National Academy of Sciences of
the United States of America 2007, 104(5):1488-1493.
39. Wang X, Bian Y, Cheng K, Gu LF, Ye M, Zou H, Sun SS, He JX: A large-scale 654 655 656 657 658 659 660 661 662 663 664 665 666 667 668 669 670 671 672 673 674 675 676 677 678 679 680 681 682 683 684 685 686 687 688 689 690
phosphoregulatory networks in Arabidopsis. Journal of proteomics 2013, 78:486-498.
40. Al-Shahrour F, Minguez P, Tarraga J, Medina I, Alloza E, Montaner D, Dopazo J:
FatiGO +: a functional profiling tool for genomic data. Integration of functional annotation, regulatory motifs and interaction data with microarray experiments. Nucleic acids research 2007, 35(Web Server
issue):W91-96.
41. Stergachis AB, Haugen E, Shafer A, Fu W, Vernot B, Reynolds A, Raubitschek A, Ziegler S, LeProust EM, Akey JM, Stamatoyannopoulos JA: Exonic
transcription factor binding directs codon choice and affects protein evolution. Science 2013, 342(6164):1367-1372.
42. Li X, Zhu J, Hu F, Ge S, Ye M, Xiang H, Zhang G, Zheng X, Zhang H, Zhang S, Li Q, Luo R, Yu C, Yu J, Sun J, Zou X, Cao X, Xie X, Wang J, Wang W: Single-base
resolution maps of cultivated and wild rice methylomes and regulatory roles of DNA methylation in plant gene expression. BMC genomics 2012, 13:300.
43. Chodavarapu RK, Feng S, Ding B, Simon SA, Lopez D, Jia Y, Wang GL, Meyers BC, Jacobsen SE, Pellegrini M: Transcriptome and methylome interactions in
rice hybrids. Proceedings of the National Academy of Sciences of the United
States of America 2012, 109(30):12040-12045.
44. Ibarra CA, Feng X, Schoft VK, Hsieh TF, Uzawa R, Rodrigues JA, Zemach A, Chumak N, Machlicova A, Nishimura T, Rojas D, Fischer RL, Tamaru H,
Zilberman D: Active DNA demethylation in plant companion cells reinforces
transposon methylation in gametes. Science 2012, 337(6100):1360-1364.
45. Chen PY, Cokus SJ, Pellegrini M: BS Seeker: precise mapping for bisulfite
sequencing. BMC bioinformatics 2010, 11:203.
46. Meissner A, Mikkelsen TS, Gu H, Wernig M, Hanna J, Sivachenko A, Zhang X, Bernstein BE, Nusbaum C, Jaffe DB, Gnirke A, Jaenisch R, Lander ES:
Genome-scale DNA methylation maps of pluripotent and differentiated cells. Nature
2008, 454(7205):766-770.
47. Laurent L, Wong E, Li G, Huynh T, Tsirigos A, Ong CT, Low HM, Kin Sung KW, Rigoutsos I, Loring J, Wei CL: Dynamic changes in the human methylome
during differentiation. Genome research 2010, 20(3):320-331.
48. Nekrutenko A, Makova KD, Li WH: The K(A)/K(S) ratio test for assessing the
protein-coding potential of genomic regions: an empirical and simulation study. Genome research 2002, 12(1):198-202.
49. Loraine AE, McCormick S, Estrada A, Patel K, Qin P: RNA-seq of Arabidopsis
pollen uncovers novel transcription and alternative splicing. Plant
physiology 2013, 162(2):1092-1109. 28 692 693 694 695 696 697 698 699 700 701 702 703 704 705 706 707 708 709 710 711 712 713 714 715 716 717 718 719 720 721 722 723 724 725 726 727 728 729 55
50. Xi L, Feber A, Gupta V, Wu M, Bergemann AD, Landreneau RJ, Litle VR, Pennathur A, Luketich JD, Godfrey TE: Whole genome exon arrays identify
differential expression of alternatively spliced, cancer-related genes in lung cancer. Nucleic acids research 2008, 36(20):6535-6547.
51. Roberts A, Pachter L: Streaming fragment assignment for real-time analysis
of sequencing experiments. Nature methods 2013, 10(1):71-73.
52. Smit AFA, Hubley R, Green P: RepeatMasker Open-3.0. 1996-2010.
53. Ward JJ, McGuffin LJ, Bryson K, Buxton BF, Jones DT: The DISOPRED server for
the prediction of protein disorder. Bioinformatics 2004, 20(13):2138-2139.
54. Edgar RC: MUSCLE: multiple sequence alignment with high accuracy and
high throughput. Nucleic acids research 2004, 32(5):1792-1797.
55. Yang Z: PAML 4: phylogenetic analysis by maximum likelihood. Molecular
biology and evolution 2007, 24(8):1586-1591.
730 731 732 733 734 735 736 737 738 739 740 741 742 743 744 745
Figure legends
Figure 1.
Pearson’s coefficients of correlation between mCG density and the CpG O/E ratio in (A) different methylome datasets (S1~S4); (B) first, last, and internal coding exons in different methylome datasets. ***: p < 0.001.
Figure 2.
The evolutionary rates (dN/dS ratio, dN, and dS) of first, last, and internal coding exons in different methylome datasets. The curves with stars indicate statistically significant difference. ***: p < 0.001, by Wilcoxon Rank Sum Test.
Figure 3.
The Spearman’s coefficients of correlation between mCG density and the dN/dS ratio,
dN, and dS based on different methylome datasets. *: p < 0.05; **: p<0.01; ***:
p<0.001.
Figure 4.
The Pearson’s coefficient of correlations between mCG density and the CpG O/E ratio of first, last, and internal coding exons of five length subgroups (Subgroups 1~5) in the four analyzed sperm methylome datasets. Subgroup 1 includes the shortest and subgroup 5 includes the longest exons.
30 746 747 748 749 750 751 752 753 754 755 756 757 758 759 760 761 762 763 764 765 766 767 768 769 770 771 59
Tables
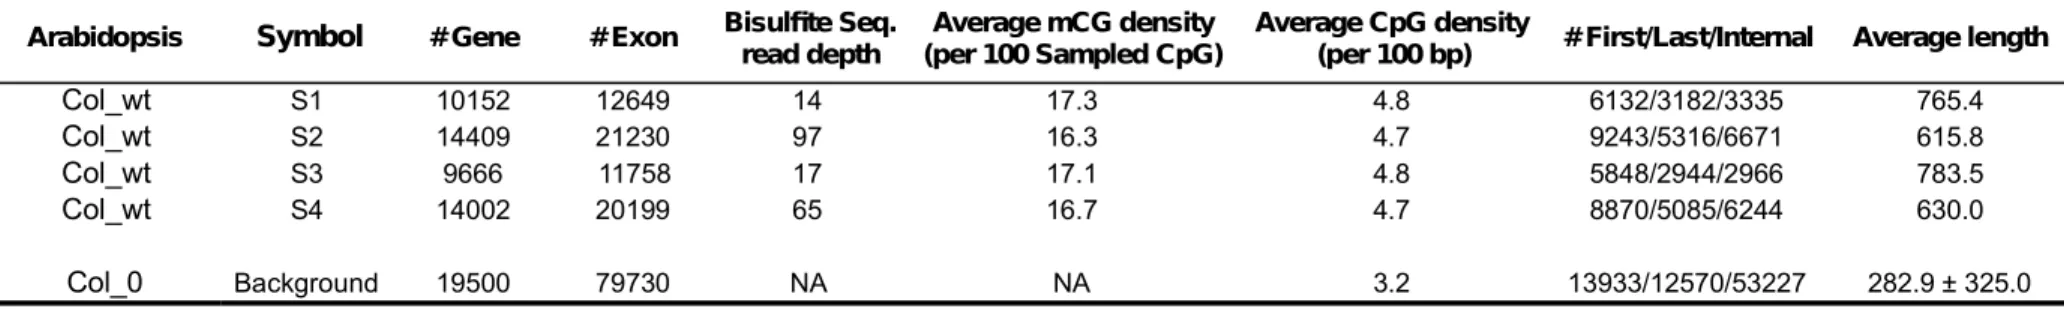
Table 1. The methylome datasets and the background exome dataset analyzed in this study. Note that the background dataset was not filtered for methylation data, but was filtered for the definitions of first, last, and internal exons and for the length threshold for calculations of evolutionary rates (see Methods). NA: not applicable. Note that the “Bisulfite Seq. read depth” is defined as the total length of the bisulfite
sequencing reads divided by the size of the A. thaliana genome.
Arabidopsis Symbol # Gene # Exon Bisulfte Seq.
read depth (per 100 Sampled CpG)Average mCG density Average CpG density(per 100 bp) # First/Last/Internal Average length
Col_wt S1 10152 12649 14 17.3 4.8 6132/3182/3335 765.4 Col_wt S2 14409 21230 97 16.3 4.7 9243/5316/6671 615.8 Col_wt S3 9666 11758 17 17.1 4.8 5848/2944/2966 783.5 Col_wt S4 14002 20199 65 16.7 4.7 8870/5085/6244 630.0 Col_0 Background 19500 79730 NA NA 3.2 13933/12570/53227 282.9 ± 325.0 772 773 774 775 776 777 778 779 780 781
Table 2. The Spearman’s coefficient of correlation (ρ) between exon length and the dN/dS ratio, dN, and dS before (upper row; “Original”) and after (lower row; “Control”) controlling for four potential confounding factors (ASE/CSE exon type, proprtion of repetitive elements/disordered regions, and exonic expression level). Note that this table is based on the background dataset.
ρ p-value ρ p-value ρ p-value
Original -0.004 0.6126 0.090 < 2.2e-16 0.156 < 2.2e-16
Control -0.004 0.41741 0.090 1.34E-68 0.146 0
Original 0.085 < 2.2e-16 0.139 < 2.2e-16 0.161 < 2.2e-16
Control 0.085 1.23E-68 0.140 9.64E-166 0.153 0
Original 0.187 < 2.2e-16 0.112 < 2.2e-16 0.039 < 2.2e-16
Control 0.188 0 0.113 1.32E-108 0.043 9.23E-67
First Exon Last Exon Internal Exon
dN/dS dN dS 32 782 783 784 785 63
Additional Files
Additional File 1.
The median mCG densities of first, last, and internal coding exons in different methylation datasets. All pairwise differences between exon groups in each dataset are statistically significant (p < 0.001, by Wilcoxon Rank Sum Test).
Additional File 2.
The Spearman’s coefficients of correlation between mCG density and the dN/dS ratio,
dN, and dS based on S1~S4 datasets after controlling for four potential confounding factors (CpG density, G+C content, exon length, ASE/CSE exon type). *: p < 0.05; **: p<0.01; ***: p<0.001.
Additional File 3.
The Spearman’s coefficients of correlation and p values between exon length and
dN/dS ratio, dN, and dS for first, last, and internal exons before (“Original”) and after (“Control”) controlling for five potential confounding factors (the ASE/CSE exon type, the proportion of repetitive elements/disordered regions, exonic expression level, and mCG density).
Additional File 4.
Pairwise comparison between length subgroups of internal coding exons in view of Gene Ontology functional categories. Note that here the “function” of an exon is the function of the gene it resides. The Y axis indicates the percentage of each length subgroup in a specific functional category. The table at the bottom shows whether the differences between subgroups are statistically significant. Lighter grey shading indicates that the former subgroup is relatively enriched. Darker grey shading 786 787 788 789 790 791 792 793 794 795 796 797 798 799 800 801 802 803 804 805 806 807 808 809 810 811
indicates the contrary. ***: p < 0.001. The numbers on top of the table indicate the percentages of genes in a specific functional category over all of the analyzed genes.
Additional File 5. The Spearman’s coefficients of correlation between mCG density and the dN/dS ratio, dN, and dS for different Gene Ontology functional categories (Level 3 of Molecular Function). *: p < 0.05; **: p<0.01; ***: p<0.001.
Additional File 6. The methylome datasets of rice (panicles: P1and P2; leaves: L).
Additional File 7. Pearson’s coefficients of correlation between mCG density and the CpG O/E ratio in (A) different methylome datasets (panicles: P1and P2; leaves: L); (B) first, last, and internal coding exons in different methylome datasets of rice. ***:
p < 0.001.
Additional File 8. The evolutionary rates (dN/dS ratio, dN, and dS) of first, last, and internal coding exons in different methylome datasets of rice (panicles: P1and P2; leaves: L). The curves with stars indicate statistically significant difference. **: p < 0.01; ***: p < 0.001, by Wilcoxon Rank Sum Test.
Additional File 9. The Spearman’s coefficients of correlation between mCG density and the dN/dS ratio, dN, and dS based on different methylome datasets of rice (panicles: P1and P2; leaves: L). *: p < 0.05; **: p<0.01; ***: p<0.001. 34 812 813 814 815 816 817 818 819 820 821 822 823 824 825 826 827 828 829 830 831 832 833 834 835 836 67