Semihydrodynamic Injection for High Salt Stacking
and Sweeping on Microchip Electrophoresis and
Its Application for the Analysis of Estrogen and
Estrogen Binding
Cheng-Chuan Chen,†Shu-Fang Yen,†,‡Honest Makamba,†Chun-Wei Li,§Mei-Ling Tsai,|and
Shu-Hui Chen*,†
Department of Chemistry and Department of Physiology, National Cheng Kung University, Tainan, Taiwan, and Faculty of Medical Radiation Technology, College of Health Sciences, Kaohsiung Medical University, Kaohsiung, Taiwan
In this work, a semihydrodynamic (SHD) injection method was introduced and coupled with high salt stacking and electrokinetic chromatography for the analysis of estrogen and estrogen binding using a simple cross microchannel. The SHD method allows all samples to be hydrodynami-cally injected and focused into the separation channel at a relatively high flow rate and without splitting and diffusion, leading to reproducible bias-free injections of larger sample volumes (up to 50 nL) within 3 s. Moreover, the injection method is initiated without voltage switching, leading to a reduced mixing effect. Such advantages are well suited for performing stacking and sweeping on a microchip. We investigated the stacking effect under continuous and discontinuous co-ion conditions as well as under sweeping conditions. Micellar sweeping effect alone was relatively weak (7-8 times), partly due to a lower sodium cholate concentration (30 mM) used for the running buffer. By combining the sweeping effect with high salt stacking, however, up to a 200-300-fold en-hancement factor could be achieved, and the high-salt and low-surfactant contents for the running buffer were favor-able for binding study under nonequilibrium conditions. To the best of our knowledge, this is the first demonstra-tion of the hydrodynamic injecdemonstra-tion used for high salt sample stacking on a microchip, also for further combin-ing micellar electrochromatography and affinity separation for the analysis of hydrophobic ligand binding using microchip electrophoresis.
The use of microchips in separation sciences has increased greatly in recent years.1-4Despite the many advantages, such as the short separation time and disposable use, that are associated
with the microchip platform, the number of assays developed for microchip electrophoresis is substantially less than that developed for capillary electrophoresis. There is still much room for improve-ments in such areas as detection sensitivity and the functional integration for real-world applications. Like capillary electrophore-sis, the sensitivity of microchip electrophoresis is limited by the short optical path length. Injection of long sample plugs of low-concentration analytes is therefore necessary in order to improve the detection sensitivity. Stacking or sweeping mechanisms are applied to decrease the length of an analyte zone and increase the analyte signal. These techniques include field-amplified sample stacking (FASS),5-8sweeping,9-11isotacophoresis,12,13and elec-trokinetic trapping.14 Sweeping was initially developed for con-centration of neutral hydrophobic analytes, but it has also been applied to charged hydrophobic analytes in combination with stacking by ion selective injection.15-17Sweeping occurs when micelles in the running buffer penetrate the sample zone devoid of the micelle, and the micelles collect the sample into a narrow concentrated zone. Sweeping has been shown to be a very powerful technique, enabling concentration enhancement as high as 5000.10In FASS, sample concentration is achieved by preparing sample solutions whose ionic strength is different from that of the running buffer, which results in a difference in field strength
* To whom correspondence should be addressed. Email: shchen@ mail.ncku.edu.tw.
†Department of Chemistry, National Cheng Kung University.
‡Current address: Analytical Department, ScinoPharm Taiwan, Ltd., Taiwan. §Kaohsiung Medical University.
|Department of Physiology, National Cheng Kung University.
(1) Reyes, D. R.; Iossifidis, D.; Auroux, A.; Manz, A.; Pawson, T. Anal. Chem. 2002, 74, 2623-2636.
(2) Culbertson, C. T.; Jacobson, S. C.; Ramsey, J. M. Anal. Chem. 2002, 72, 5814-5819.
(3) Auroux, P. A.; Iossifidis, D.; Reyes, D. R.; Manz, A. Anal. Chem. 2002, 74, 2637-2652.
(4) Jacobson, S. C.; Hergenroder, R.; Koutny, L. B.; Ramsey, J. M. Anal. Chem. 1994, 66, 1114-1118.
(5) Zhang, C.-X.; Thormann, W. Anal. Chem. 1996, 68, 2523-2532. (6) Zhao, Y.; McLaughlin, K.; Lunte, G. E. Anal. Chem. 1998, 70, 4578-4585. (7) Zhu, L.; Lee, H. K. Anal. Chem. 2001, 73, 3065-3072.
(8) Dang, F.; Zhang, L.; Jabasini, M.; Kaji, N.; Baba, Y. Anal. Chem. 2003, 75, 2433-2439.
(9) Quirino, J. P.; Terabe, S. Anal. Chem. 1999, 71, 1638-1644. (10) Quirino, J. P.; Terabe, S. Science 1998, 282, 465-468.
(11) Sera, Y.; Matsubara, N.; Ostuka, K.; Terabe, S. Electrophoresis 2001, 22, 3509-3513.
(12) Wolters, A. M.; Jayawickrama, D. A.; Larive, C. K.; Sweedler, J. V. Anal.
Chem.2002, 74, 2306-2313.
(13) Vreeland, W. N.; Williams, S. J.; Barron, A. E.; Sassi, A. P. Anal. Chem. 2003, 75, 3059-3065.
(14) Dai, J.; Ito, T.; Sun, L; Crooks, R. M. J. Am. Chem. Soc. 2003, 125, 13026-13027.
(15) Palmer, J.; Munro, N. J.; Landers, J. P. Anal. Chem. 1999, 71, 1679-1687. (16) Zhu, L.; Tu, C.; Lee, H. K. Anal. Chem. 2002, 74, 5820-5825.
(17) Quirino, J. P.; Terabe, S. Anal. Chem. 2000, 72, 1023-1030. Anal. Chem.2007,79,195-201
between the sample and the buffer. In one form of FASS, the sample is prepared with a lower ionic strength than the buffer.5 This results in a higher field in the sample zone than the running buffer. The charged analytes are stacked as they cross the boundary of the sample zone and the running buffer. Another type of FASS is coupled with sweeping, and the sample is prepared with a higher ionic strength than the running buffer that contains micelles. This results in a higher field in the running buffer,15 and the micelle is stacked as it approaches the sample zone. This type of FASS is more useful for neutral analytes, which can be stacked together with the micelle.
In capillary electrophoresis, hydrodynamic injections with low pressure (∼50 mbar)10,15are commonly used to introduce sample plugs containing neutral analytes. The low velocity used to diminish mixing, however, necessitates a long injection time, which exceeds the analysis time. For example, typical separations take as little as 60 s; however, the time required to introduce long sample plugs for filling 50% of the capillary is on the order of 50-2000 s; this time frame is considered to be a drawback for fast analysis. On the other hand, the electrokinetic injection method has been demonstrated for stacking neutral analytes by electroos-motic flow at up to 1 order of magnitude faster than the corresponding pressure injections.18Electrokinetic injection method also results in an increased length of capillary remaining for separation since the injection is initiated at the capillary inlet. In theory, however, hydrodynamic injection should have a relatively higher confidence for introducing neutral or hydrophobic com-pounds since the injection bias is prevented especially when the analytes are dissolved in high-salt buffers.
Most sample injections on microchips employ electrokinetic flow,19-21which is less favorable for neutral compounds. Various hydrodynamic injection methods have been reported for microchip electrophoresis.22-24We have also reported25-28a flow-through hydrodynamic (HD) method for sample injection in which the sample is introduced into the chip by a syringe pump. Application and control of voltage on the buffer reservoir can allow sample injection into the separation channel by gating.25-28In this method, we showed that there was no electrokinetic bias, meaning that neutral and charged analytes can be injected together without significant contamination27and a waste-removing function can be integrated into the microchip for continuous analysis.28Here, we introduce an improved hydrodynamic injection technique that we call semihydrodynamic injection (SHD) for high salt stacking and electrokinetic chromatography using a simple cross microchannel.
This method uses the same hydrodynamic pumping for sample introduction while the sample is being focused by application of voltage to the two side arms. We show that the SHD method is superior to the HD due to its simplicity and because a high sample amount is injected within a short period of time. Moreover, the mixing effect is reduced because no voltage switching is involved. We couple the SHD method for high salt stacking with electro-kinetic chromatography for the analysis of dye-labeled estrogens and for estrogen binding. The injection method and separation buffers were optimized, and the concentration effect was system-atically investigated.
EXPERIMENTAL SECTION
Chemicals and Buffers. Methanol, glycerol, and Tris-HCl were obtained from J.T. Baker (Phillipsburg, NJ). EDTA, sodium vanadate, DL-dithiothreitol (DTT), sodium cholate, and β-cyclo-dextrin were purchased from Sigma (St. Louis, MO). Potassium chloride was purchased from Fisher Chemicals, boric acid was purchased from Fluka (Buchs, Switzerland), and human estrogen receptor R (ERR) and FITC-labeled β-estradiol (F-E2) were purchased from Panavera (Madison, WI). 17R-Cy3-estradiol (Cy3-E2) was synthesized in-house following the procedure reported previously29 with minor modifications, and the details of the synthesis are described in the Supporting Information.
The solvent buffer was composed of 50 mM Tris-HCl (pH 8.0), 500 mM KCl, 2 mM DTT, 1 mM EDTA, 1 mM sodium vanadate, and 10% glycerol. Running (separation) buffer was composed of 10 mM boric acid, 30 mM sodium cholate, 2 mM β-cyclodextrin, and 20% methanol adjusted to pH 7.4 with 50 mM sodium tetraborate decahydrate. Binding buffer was composed of 10 mM Tris-HCl, 2 mM DTT, and 10% anhydrous glycerol, adjusted to pH 7.4 with 1 N NaOH. For high salt stacking and sweeping, unless specified, the F-E2 sample solution was prepared by mixing 1 volume of F-E2 in MeOH at various concentrations, 2 volumes of the solvent buffer, 0.5 volume of MeOH, and 6.5 volumes of the binding buffer, which yielded a final sample buffer composed of 16.5 mM Tris-HCl, 1.7 mM DTT, 8.5% glycerol, 100 mM KCl, 0.2 mM EDTA, 0.2 mM Na3VO4, and 15% MeOH. For studies of the affinity between F-E2 and ERR, the solution was prepared by mixing 1 volume of 10 nM F-E2 prepared in MeOH, 1 volume of 2200 nM ERR prepared in the solvent buffer, 1 volume of the solvent buffer, 0.5 volume of MeOH, and 6.5 volumes of the binding buffer. This sample solution was incubated at 4°C for 18 h. For the comparison of hydrodynamic and semihydrodynamic injections by CCD camera, the F-E2 was directly dissolved in the running buffer.
Microchip Fabrication. The cross channels on the microchip are 2 and 6 cm in length, respectively; the width and depth of all microchannels are 100 and 20 µm, respectively. The microchip was fabricated on a soda lime glass substrate using standard photolithography techniques at the Micro-Nanotechnology Center at National Cheng Kung University. Before bonding, four through-holes corresponding to each channel end with a diameter of 1.5 mm were mechanically drilled on the cover plate to bond with four reservoirs by epoxy adhesive, and hole S (Figure 1) was used as the sample inlet. Before experiments, the microchannel was (18) Palmer, J.; Burgi, D.S.; Munro, N. J.; Landers, J. P. Anal. Chem. 2001, 73,
725-731.
(19) Solignac, D.; Gijs, M. A. M. Anal. Chem. 2003, 75, 1652-1657. (20) Karlinsey J. M.; Monahan, J.; Marchiarullo, D. J.; Ferrance, J. P.; Landers,
J. P. Anal. Chem. 2005, 77, 3637-3643.
(21) Reichmuth, D. S.; Shepodd, T. J.; Kirby, B. J. Anal. Chem. 2004, 76, 5063-5068.
(22) Fang, Q.; Xu, G.-M.; Fang, Z.-L. Anal. Chem. 2002, 74, 1223-1231. (23) Ito, T.; Inoue, A.; Sato, K.; Hosokawa, K.; Maeda, M. Anal. Chem. 2005,
77, 4759-4764.
(24) Wang, J.; Chen, Z.; Cai, P.; Mo, J. Anal. Lett. 2005, 38, 857-867. (25) Lin, Y.-H.; Lee, G.-B.; Li, C.-W.; Huang, G.-R.; Chen, S.-H. J. Chromatogr., A
2001, 937/1-2, 115-125.
(26) Chen, S.-H.; Lin, Y.-H.; Wang, L.-Y.; Lin, C.-C.; Lee, G.-B. Anal. Chem. 2002,
74, 5146-5143.
(27) Lin, C.-C.; Lee, G.-B.; Chen, S.-H. Electrophoresis 2002, 23, 3550-3557. (28) Lin, C.-C.; Chen, C.-C.; Lin, C.-E.; Chen, S.-H. J. Chromatogr., A 2004, 1051,
69-74.
(29) Ohno, K.-I.; Fukushima, T.; Santa, T.; Waizumi, N.; Tokuyama, H.; Maeda, M.; Imai, K. Anal. Chem. 2002, 74, 4391-4396.
sequentially rinsed with DI water, 1 M NaOH, DI water, and the running buffer for 10 min, respectively.
Instrumentation. As depicted in Figure 1, a syringe pump (Series 74900, Cole Parmer, Vernon Hills, IL) was used to drive the buffer at the flow rate of 1 µL/min through a 15-cm connection capillary (i.d. 50 µm, o.d. 375 µm) into the microchannel. The fitting on hole S for inserting the connection capillary was made by a 1-cm Teflon tubing (i.d. 250 µm, o.d.1/
16in.), as described
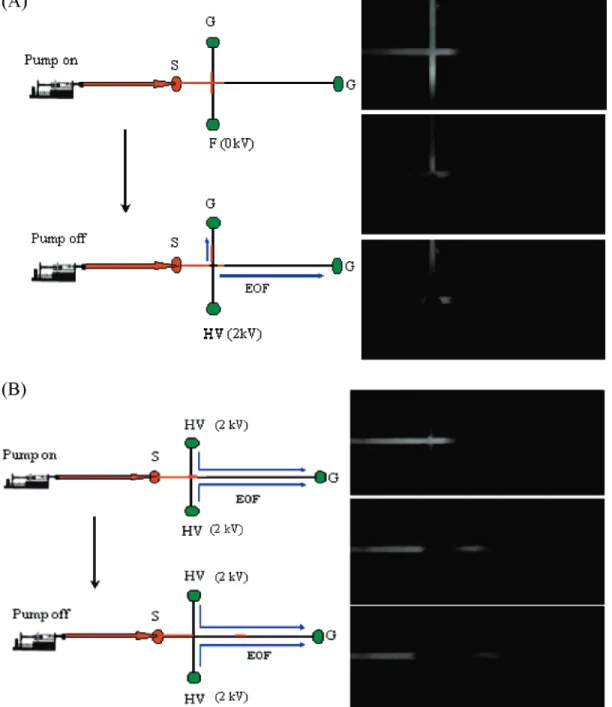
previously. A high-voltage power supply (Series 230, Bertan High Voltage, Hicksville, NY) was employed to furnish the gating and separation voltages. For hydrodynamic gated injection, as indi-cated in Figure 1A, the injection and separation was initiated by switching off the pump and a high voltage (HV) of 2 kV was applied to the buffer reservoir after a 3-s pumping. For semihy-drodynamic injection, as indicated in Figure 1B, the 2-kV HV was always applied to two reservoirs marked as HV and the injection
Figure 1. Sample injection by (A) HD method and (B) SHD method. In (A), F-E2 was delivered into the microchannel through port S using a syringe pump under a flow rate of 1µL/min; the HV and W reservoirs were kept floating (F) and grounding (G), respectively. In the top CCD image, part of the cross region was filled with F-E2. After 3 s of sample loading, the pump was turned off, and a high voltage of 2 kV was applied to the HV reservoir to start sample injection and separation. As indicated in the bottom CCD image, the sample zone in the cross region was injected into the separation channel. In (B), F-E2 was delivered into the microchip by a syringe pump under a flow rate of 1µL/min while a high voltage of 2 kV was applied to both the side arm reservoirs for focusing and the reservoir in the end of the separation channel was kept grounding (G) as indicated. As seen in the top CCD image, under these conditions, all injected sample was directed to the separation channel without splitting. After 3 s of pumping (sample loading time), the pump was turned off and the applied voltage served as the injection and separation voltage. As indicated in the bottom CCD image, the sample in the separation channel was injected as a zone and separated by the voltage. The volume of sample injected by this method was estimated to be∼10 times that injected by the hydrodynamic injection method, based on the split ratio estimated from the channel lengths.
and separation was initiated by switching off the syringe pump after a 3-s pumping. Instead of voltage switching, sample injection/ separation in SHD mode was controlled by switching the syringe pump. In both modes, consecutive injections and analyses were performed by resuming the pump flow and high voltage, which were controlled by a program written with LabVIEW (National Instruments, Austin, TX) software. Signals were detected on-chip via fluorescence detection, with the detection system being constructed by modifying a commercial reflection microscope (model Axiover 25, Zeiss, Taipei, Taiwan). The light source from a mercury lamp was filtered by a band-pass filter (450-490 nm) from the intersection by a 40× (NA ) 0.5) long working distance objective. Fluorescence was collected by the same objective lens and passed through a dichroic cube (510 nm) with a long-pass filter (515 nm), followed by spatial filtering, and finally detected by a photomultiplier tube (LD A-Plan, Zeiss). Amplified photo-electron signals were converted to the digital signal and processed by a computer using a commercial interface (model 9524, SISC, Taipei, Taiwan). The reproducibility between injections (Figure 4) was confirmed by consecutive injections with the detection at the same location. For monitoring the band signal moving along the microchannel, consecutive injections were performed and the detection location was varied for each injection using the X-positioner attached to the sample stage.
RESULTS AND DISCUSSION
HD versus SHD injections. In this study, we would like to further improve the sensitivity and stability of the HD method by introducing the SHD method. As shown in Figure 1A, when performing the gated HD mode in a simple cross microchannel configuration, part of the sample pumped into the microchip is wasted due to the split flow in the cross. Moreover, using the HD injection method, the applied voltage is interrupted during the loading and separation; this could lead to undesired mixing due to the imbalanced surface potentials associated with electro-kinetic forces. As shown in Figure 1A, although no clear turbulent flow is detected, the created sample plug is short and rather nonsymmetrical. On the other hand, in SHD mode, the sample
loading is controlled by the pump while the applied voltage is not interrupted. The voltage applied during injection is the same voltage used for separation when the pump is switched off. We think this helps to reduce any mixing that may occur during voltage interruption. As shown in Figure 1B, the created sample plug is symmetrical, with parabolic profiles for both ends; this characteristic is consistent with the expectation for hydrodynamic injections. Moreover, the sample flow is focused to the separation channel without splitting and diffusion; therefore, a longer plug length is injected compared to that injected by the HD method under the same injection time (3 s). Moreover, there were no signs of sample overloading in SHD, despite the fact that the entire sample loaded was directed to the main separation channel. We estimated that∼10 times more sample volume was injected by the SHD method versus the HD method, based on the split ratio of the flow in the cross of the chip. As seen in Figure 2, the relative peak intensity acquired from high salt stacking and sweeping (which will be described later) by the two injection methods also reveals a 10-fold higher peak intensity obtained from the SHD mode, compared to the HD mode. We also obtained similar results by injecting Cy3-labeled ERR (data not shown) protein, where the peak intensity ratio for SHD to HD is 12.2. The peak intensity ratios, thus, agree with the ratio expected from calculations.
The SHD injection method demonstrated here allows the analyte to be introduced by hydrodynamic forces, and the applied voltage is used to focus the sample plug. As a result, the injection bias could be prevented; this is a very crucial factor for high salt stacking in which neutral or hydrophobic analytes are dissolved in high-salt buffers. Although FITC dye could bear one negative charge, the E2 compound is neutral and extremely hydrophobic. The derivatized F-E2 compound can barely be dissolved in aqueous buffers, indicating a hydrophobic nature. We had compared the electrokinetic and hydrodynamic injection method for F-E2 in our previous work.27For electrokinetic injection, the
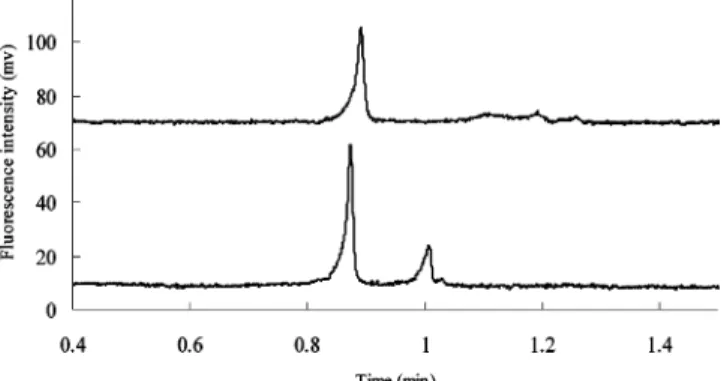
Figure 2. Electropherograms of F-E2 (1 nM) dissolved in 16.5 mM
Tris-HCl, 1.7 mM DTT, 8.5% glycerol, 100 mM KCl, 0.2 mM EDTA, 0.2 mM Na3VO4, and 15% MeOH obtained by the (A) SHD and (B)
HD methods. The separation buffer was composed of 10 mM boric acid, 30 mM SC, 2 mMβ-CD, and 20% methanol at pH 7.4. Sample was injected at a pump flow rate of 1µL/min for 3 s, and the applied HV was 2 kV. Under these conditions, the volume of sample injected was about 50 nL for SHD and 5 nL for HD. The PMT detection point was at 3 cm downstream from the cross point, and voltage applied to PMT was-750 mV. The intensity ratio of the two peaks was calculated to be∼10.
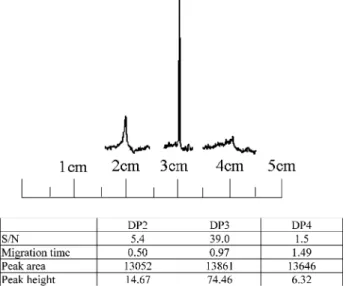
Figure 3. Electropherograms of F-E2 (1 nM) acquired by the SHD
method at separation distances ranging from 1 to 4.5 cm from the cross point. All other conditions were the same as those used in Figure 2. In 1 cm, the background level was raised but no clear signal could be recognized due to the broadband. The detected peak height, S/N ratio, and peak area from all locations are indicated in the bottom table.
required injection time was relatively long for attaining a compa-rable intensity and the reproducibility was also much poorer.27 Due to the length limitation associated with the microchip platform, the volume (50 nL) injected here is∼20 times less than that normally injected in a capillary. Nevertheless, the short channel length allows a higher velocity to be used, due to the reduced back pressure. The injection time is reduced by ∼10-20 times for injecting the same volume of the analytes. We would like to take these advantages to explore their uses for high salt stacking and sweeping, as well as affinity separation for the analysis of estrogenic compounds using microchip electrophoresis. High Salt Stacking and Sweeping of F-E2. It is desirable to be able to concentrate the F-E2 injected on microchip electro-phoresis to gain better sensitivities. In this study, the buffer conditions were optimized by systematic studies for each variable, and the optimized conditions were used except for the surfactant, sodium cholate (SC). Although the enrichment factor increases with SC concentration, precipitation of the running buffer in the reservoir occurred over time as the SC concentration rose above 30 mM. To prevent the blockage of the channel entrance by the precipitate, we chose to use 30 mM SC. In contrast, the F-E2 sample was dissolved in a buffer containing high salt, 100 mM KCl, for stacking. Moreover, when we measured the conductivity, the sample buffer appeared to have 7-8 times (∼8600 µΩ-1/cm) higher conductivity compared to that of the running/separation buffer (∼1200 µΩ-1/cm). Under these conditions, FASS was expected because of the high ionic strength in the sample solution (low field) and the lower ionic strength in the running/separation buffer (high field). We expected the co-ion (chloride in this case) in the sample matrix to be present at a concentration sufficient to reduce its velocity to less than that of the electrokinetic vector (cholate in this case) in the running/separation buffer. We also expected sweeping to occur since the sample solution did not contain the surfactants/micelles. Therefore, we expected the SC micelles to be stacked as they approached the sample zone as previously described.15Hence, the synergic effects of stacking and sweeping in enhancing peak intensity were expected. We moni-tored the peak intensity of both 1 nM F-E2 and 40 nM Cy3-E2 loaded by the SHD method with increasing distance from the injection cross under high salt stacking and sweeping. Figure 3 shows that the peak intensity of 40 nM Cy3-E2 increases gradually until 3 cm, where a tall, sharp peak is obtained; beyond 3 cm, the peak intensity decreases dramatically. This means that the effect
of high salt stacking and sweeping is complete at a certain distance; beyond that distance band broadening due to diffusion begins to dominate. Whereas, as indicated in Figure 3, the peak area remains similar for all three bands as the sample zone migrates along the channel. Band broadening after completing sweeping has been observed in the sweeping of hydrophobic dyes by SDS on a microchip.11 As shown in Figure 4, consecutive injections of F-E2 showed that the high salt stacking and sweeping by the SHD method are highly reproducible up to more than 30 min, with the relative standard deviation of the peak height less than 1.7% for six injections.
To deconvolute the contribution of FASS and sweeping under the conditions used in this study, we varied the composition of the sample solution while keeping the separation buffer composi-tion the same. We used Cy3-E2 for this investigacomposi-tion since more concentrated samples were required to gain appreciable intensity for detection under each conditions and the amount of commercial F-E2 was very limited. The overall enhancement can be calculated based on the peak height or S/N and the dilution factor. Since the sweeping or stacking speed will vary with the composition of the sample zone, the detection point to obtain the maximum peak height will also vary with the sample buffer. Hence, the signal was monitored at several locations along the channel, and only the electropherogram with the maximum peak height for each sample buffer was used for the calculation. Figure 5 shows the electropherograms obtained when varying the composition of the sample solution. For the sample solution without KCl and with 30 mM SC (the top electropherogram shown in Figure 5), the
Figure 4. Consecutive injections of F-E2 (4 nM) by the SHD
method. All other conditions were the same as those used in Figure 2.
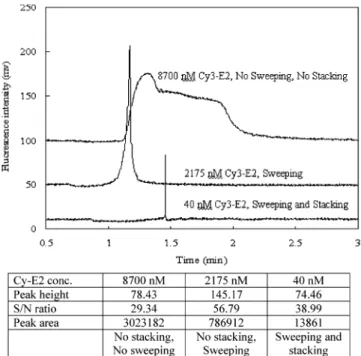
Figure 5. Signal enhancement by high salt stacking and sweeping
using the SHD method under various concentrations of Cy3-E2 dissolved in buffers with or without KCl and SC. From the top, the compositions for each condition were as follows: 8700 nM Cy3-E2 dissolved in the buffer with 30 mM SC and without KCl (the uppermost one); 2175 nM Cy3-E2 dissolved in the buffer without SC and without KCl (middle); 40 nM Cy3-E2 dissolved in the buffer without SC and with 100 mM KCl (bottom). The detected peak height, S/N, and peak area from all conditions are indicated in the bottom table. All other separation conditions were the same as those indicated in Figure 2.
peak is very broad since no high salt stacking and sweeping is expected under such conditions. Although the conductivity of the sample solution was determined to be∼1.7 times higher than that of the running buffer under such conditions, the higher concentra-tion of SC created in the zone boundary by field stacking is not high enough to cause efficient sweeping for Cy3-E2. We needed as high as 8700 nM of Cy3-E2 to obtain a clear signal. For the sample solution without KCl and without SC (the second elec-tropherogram), the peak was not broad under such condition. Here, the process occurring is sweeping without stacking, and the result indicates that the sweeping alone does have caused a concentration effect. The peak height and the concentration (2175 nM) injected, however, suggest that the sweeping contribution alone is not very strong. With the sample solution containing 100 mM KCl and without SC (the bottom electropherogram), high salt stacking and sweeping are expected to occur together and with the highest strength. The peak obtained was much taller and sharper than that obtained under other conditions and with the lowest concentration of 40 nM Cy3-E2 being injected. The peak shows that high salt stacking and sweeping are occurring together to produce the concentration effects. It is also noticeable from the attached table for Figure 5 that the peak areas determined from all three bands agree with the amount of the sample injected. Table 1 shows the calculated peak enhancement effects based on either S/N ratio or peak intensity when compared to the conditions where high salt stacking and sweeping are absent or minimal. From the table, the enhancement factor is∼7-8 for sweeping alone and it is enhanced by 30-fold when coupled with high salt stacking for SC; the synergic effect of both stacking and sweeping gives an overall enhancement∼200-300. The effect of sweeping in our work was not as high as that demonstrated in other reports in which sodium dodecyl sulfate (SDS) was used with selected hydrophobic analytes.11Sweeping in MEKC is highly dependent on the interaction between the surfactant and the analyte; the hydrophobicity and concentration of the interacting species are the key factors.10 We did not use SDS, to avoid denaturation of the estrogen receptor, which may affect protein binding. We also did not use the optimum concentration of SC due to the experimental difficulty associated with the microchip channel; however, higher concentrations of SC are expected to cause a greater sweeping effect. Therefore, it is not too surprising that the sweeping effect alone was not strong in this study. The detection limit of Cy3-E2 and F-E2 using the current method is estimated to be lower than 40 and 1 nM, respectively, under which
the S/N value is∼67. This sensitivity, however, is suitable for the study of E2 and ERR binding by microchip affinity electro-phoresis.
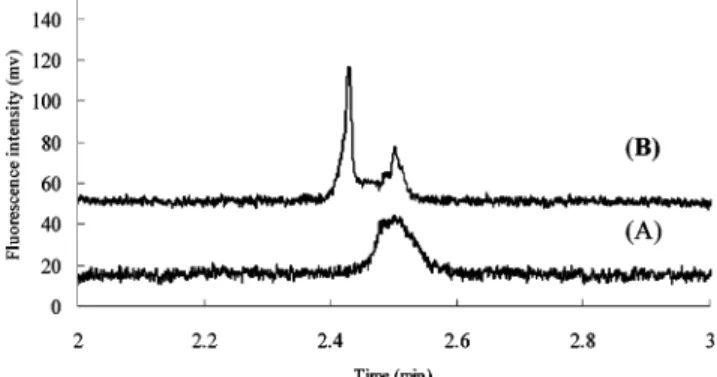
Estrogen-Estrogen Receptor Binding. We used conditions of high salt stacking and sweeping described above to investigate the binding between F-E2 ligand and ERR. F-E2 ligand was specified to have appreciable binding affinity toward ERR by the manufacturer. In order to prevent protein adsorption on the channel wall, a nonequilibrium mode of affinity electrophoresis was used in which ERR is not present in the running buffer. In this investigation, F-E2 and ERR were mixed, incubated in the binding buffer and then injected into the microchip for analysis. The final composition of the binding buffer is as the sample buffer for F-E2. It is interesting to note that the high-salt condition (100 mM KCl) used for sample stacking was also compatible with estrogen binding, in which the complex can be stabilized by high ionic strength. In addition to estrogen ligand, as described previously, we confirmed that the signal of ERR will also be enriched by the sample stacking and sweeping method. As observed previously, the peak intensity increased gradually until 3-4 cm, at which point a tall, sharp peak was obtained. Beyond 4 cm, the peak intensity began to decrease and a small complex peak was resolved at a longer migration time as shown in Figure 6. This means that, at 4 cm, the effect of high salt stacking and sweeping are complete; beyond that, the sample separation as well as band broadening, due to diffusion, begins to dominate. To confirm binding between estrogen ligand and ERR, both a double-labeling method and a hot/cold competition method were used. For the double-labeling method, the F-E2 (1 nM) was mixed with 100 nM of Cy3-labeled receptor (Cy3-ERR) and the sample was injected by SHD. Figure 6A shows that with the optical filter for Cy3 (upper electropherogram), two peaks appear; one for the Cy3-ERR and the other for the Cy3-Cy3-ERR-F-E2 complex. With the optical filter for FITC (lower electropherogram), one peak was observed at the same migration time as for the complex in the upper electropherogram. In the competitive assay, Figure 7A (upper electropherogram) shows two peaks representing the free F-E2 and F-E2/ERR complexes, respectively. In the presence of an excess of unlabeled E-2 competitor (50 nM), as indicated in Figure 7B, the F-E2 could not form a complex because of the competition from the unlabeled E2, which is present at a much higher concentration than the F-E2. These data confirm that the
Table 1. Concentration Factors Calculated from Figure 5
sweepinga stackingb stacking andsweepingc
peak height 7.4 28 ∼206
S/N ratio 7.7 37 ∼289
aCy3-E2 concentration ratio multiplied by the ratio of peak height or S/N of the two peak pairs with (the middle of Figure 5) and without stacking (the top of Figure 5).bF-E2 concentration ratio multiplied by the ratio of peak height or S/N of the two peak pairs with (the bottom of Figure 5) and without sweeping (the middle of Figure 5). cF-E2 concentration ratio multiplied by the ratio of peak height or S/N of the peak pair with (the bottom of Figure 5) and without (the top of
Figure 5) both stacking and sweeping. Figure 6. Confirmation of the complex peak using double labeling and the SHD method. The sample was composed of 1 nM F-E2 and 100 nM Cy3-ERR, and the emission filters used for the detection were specific for (A) Cy3 dye and (B) FITC dye. All other conditions were the same as those used for Figure 2.
buffer conditions used here are able to preserve the complex between the F-E2 ligand and the Cy3-ERR receptor. We noticed that, under lower molar ratios of ERR, migration time shifts were observed instead of the complex peak, due to the weak interaction. Further studies are currently underway to establish a reliable assay for quantitating the binding constant. It is important, however, to note that the short separation distance associated with the microchip had allowed the complex signal to be captured before the dissociation or diffusion occurs. At longer distances, the complex signal will degrade due to band broadening. More-over, the stability of the complex will also degrade due to exposure of the complex in a nonequilibrium environment. The relatively low concentration (30 mM) of SC used for sweeping also helped
to prolong the complex stability, since the SC molecule has an estrogen-like structure and therefore might be a potential competi-tor for the binding.
CONCLUSIONS
In this work, the SHD injection method was introduced and utilized for high salt stacking and sweeping of neutral compounds on a microchip. This method was very convenient because longer sample plugs could be introduced into the microchip within seconds and the sensitivity could be greatly enhanced by high salt stacking and sweeping. Meanwhile, the high-salt buffer and microchip platform was also suitable for binding complexes under nonequilibrium conditions, due to the high ionic strength and short separation distance. Our preliminary data indicate that this technique is also very promising for developing on-chip sweeping assays for neutral or hydrophobic compounds such as estrogen metabolites.
ACKNOWLEDGMENT
This work was supported by National Science Council of Taiwan. The authors also thank the Center for Micro/Nano Technology Research, National Cheng Kung University, Tainan, Taiwan, for equipment access and technical supports.
SUPPORTING INFORMATION AVAILABLE
Additional information as noted in text. This material is available free of charge via the Internet at http://pubs.acs.org.
Received for review July 27, 2006. Accepted October 20, 2006.
AC061377B
Figure 7. Confirmation of the complex peak using hot/cold
competi-tion and the SHD method. In the bottom electropherogram, the sample was composed of 1 nM F-E2 and 220 nM ERR, and two peaks were detected; in the top electropherogram, the complex signal was quenched by the competitive binding when the sample was added with 50 nM unlabeled E2. All other conditions were the same as those used for Figure 2.