1
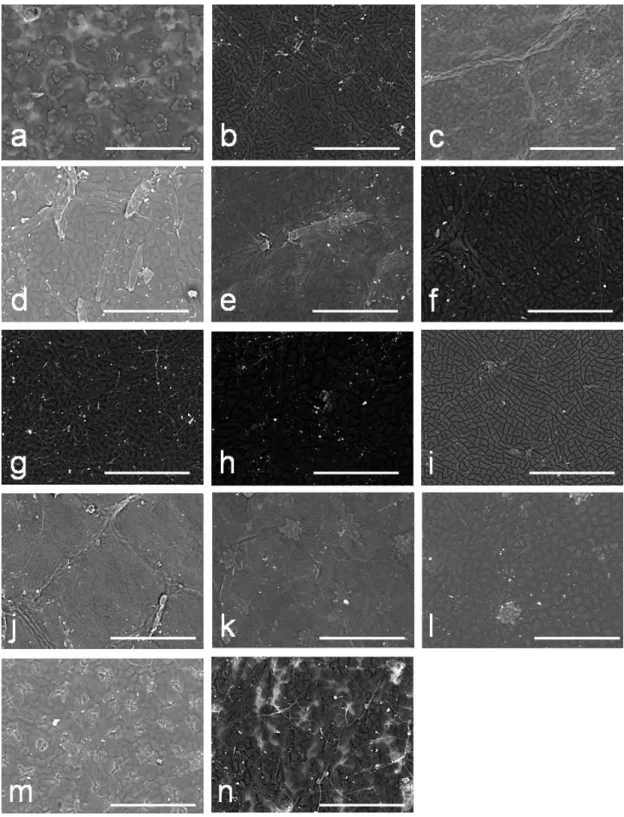
Figure S1. Detail of adaxial layer of leaf epidermis of the genus Lithocarpus using scanning electron microscope (SEM). (A) L. amygdalifolius; (B) L. brevicaudatus; (C) L. cornea; (D) L. dodonaeifolius; (E) L. formosanus; (F) L. glaber; (G) L. hanceii; (H) L. harlandii; (I) L. kawakamii; (J) L. konishii; (K) L. lepidocarpus; (L) L. nantoensis; (M) L. shinsuiensis; (N) L. taitoensisx. The SEM shows no epicuticular wax crystals covered in the leaf adaxial surface in Lithocarpus.
2
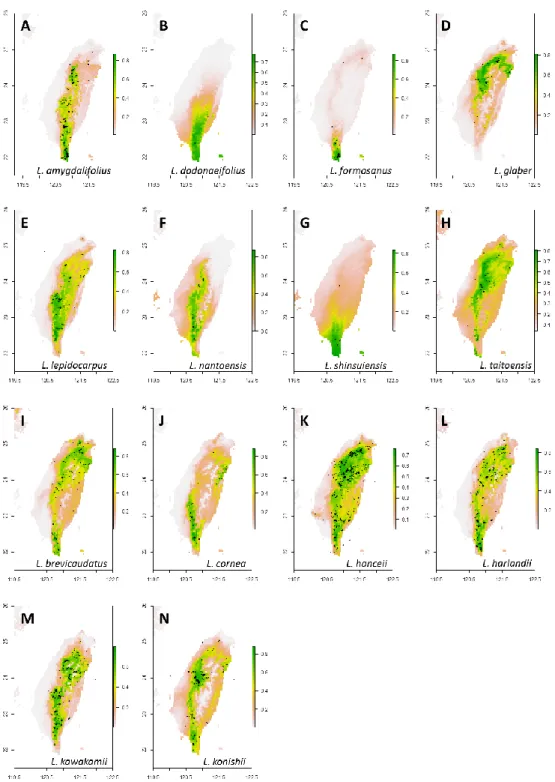
Figure S2. The spatial distribution reconstructed according to the current sampling records from GBIF and predicted using a machine-learning algorithms, maximum entropy algorithms, implemented in Maxent (Phillips & Dudík, 2008). The species distribution modeling was conducted by Maxent (Phillips & Dudík, 2008), with assistance of the R packages dismo (Hijmans et al., 2013). The species occurrence data were extracted from the Global Biodiversity Information Facility (GBIF;
http://gbif.org). The continuous probability distributions for each Lithocarpus species were generated with 19 BIOCLIM predictors downloaded from WorldClim database
(http://www.worldclim.org/bioclim). Trimming and visualization of the continuous probability distributions were conducted by R packages raster (Hijmans & van Etten, 2014). (A)~(H) are the distribution patterns of species with LAEWC, while (I)~(N) are the distributions of species without LAEWC. Dots on the maps are the distribution of specimen records.
3
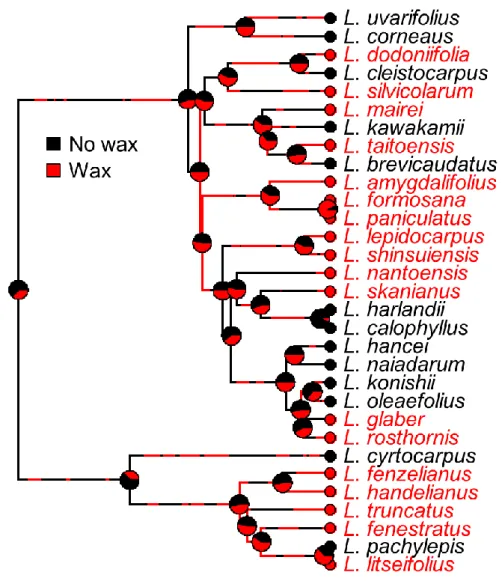
Figure S3. Ancestral state inference of discrete characters using the Maximum likelihood framework assuming one-parameter equal rates (ER) of character transition model and summarize the 300 simulated character reconstructions. This analysis is performed with the function of simmap in R package phytools. Posterior density of ancestral state was presented in pie chart: presence of the leaf abaxial epicuticular wax crystals (LAEWC) is red and absence of LAEWC is black. Colors in the branches show the stochastic character mapping which use an MCMC approach to sample character histories from their posterior probability distribution. We marked the gain and lost events with the red and black arrows, respectively. Fourteen species of this study are marked in blue words. The question marks indicate the ambiguous inference of the ancestral states. This tree is reconstructed based on the chloroplast atpB-rbcL fragment obtained from the NCBI GenBank using the Yule’s pure-birth model. Character state of the LAEWC was determined referred to the Zhou and Xia (Zhou & Xia, 2012). This result indicates ambiguous ancestral states at the basal nodes of the tree with higher probability of absence of LAEWC at subsequent nodes, implying that the earlier ancestors of the extant Lithocarpus could be lack of LAEWC. The following “gain” events were observed at certain derived lineages, while certain lineages were suggested to be “lost” the LAEWC again, which inferred that the gain and loss of the LAEWC seemed independently evolving at divergent lineages and the current status of the
4
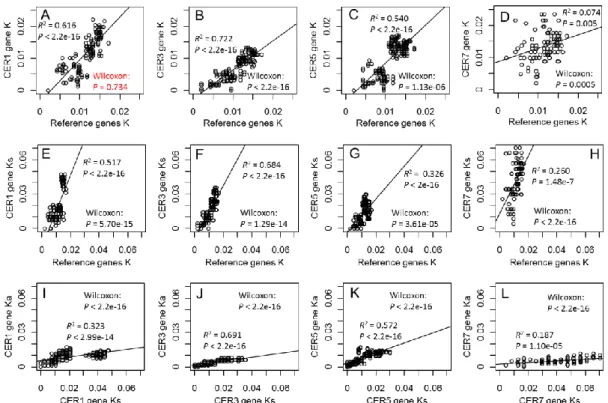
Figure S4. Pairwise comparison of substitution rates (K) of LAEWC related genes and reference genes using simple linear regression (SLR) and dependent two-group Wilcoxon Signed Rank Test (WSRT). The R2 of the SLR is the adjusted R2. a~d, the K of LAEWC related gene vs. K of reference genes; e~h, the synonymous substitution rate (Ks) of LAEWC related gene vs. K of reference genes; i~l, the nonsynonymous substitution rate (Ka) vs. Ks of LAEWC related gene. The open dots are the observed values of pairwise comparisons and the lines indicate the estimates of simple linear model. Significant results of SLR in all pairs of K between the LAEWC related genes and reference genes suggest similar trends of evolution sequence of LAEWC related genes and the species. However, the non-significant WSRT result in CER1 and reference genes (Supporting information Fig. S4A) indicates the K of CER1 is independent from the rate of species divergence, implies non-neutrally evolving of CER1. This inference from this result is consistent with the inference from PAML results (Table 1).
5 Table S1. Primer list and annealing temperatures used in this study
Locus Primer Sequence Tm(°C) Accession number Aligned length (bp) Percentage of coding regions
SAHH FagaSAHH-F CAAGTTCTAACCCTTGAGGATG 52 KY458942 - KY458955 462 100%
FagaSAHH-R CTTCTCAGTACCTGTAGTGA
SAM FagaSAM-F CCATTTGCTACTATACTCTTGG 56 KY458956 - KY458961 565 100%
FagaSAM-R GGTCTTGATGCTGACAACTGC
DGD FagadGd-F CTCGCTTTCCCTCATCATAGC 58 KY458894 - KY458907 536 48.10%
FagadGd-R GGAGGAGCTGGATTCATTGG
CAP FagaCAP-F CTTGCAGTGGGTGTCACTGAG 56 KY458808 - KY458821 587 82.60%
FagaCAP-R GCAGGTGTGAGTACATTGGCAG
ESRK FagaESRK-F GATTCTTCGGGGGCTAAAGT 55 KY458908 - KY458926 461 56.80%
FagaESRK-R GTGTGAGGGGAGTTGGCGAA
FAD FagaFAD-F1 CAGGTTGRAGAACAATGGGTG 52 KY458927 - KY458941 461 100%
FagaFAD-R1 GCCTGGWGGATTGTTRAGGT
CER1 CER1-F1 ATGGCTACYAAACCWGGWAT 54 KY458822 - KY458839 1701 100%
CER1-R1 ATCCCAGCWATACGCCAAGC
CER3 CER3-F1 ATGGTTGMTWCTTYGTCAGG 53 KY458840 - KY458857 1818 100%
CER3-R1 ACCRTGTTTTAATGCWGCTTC
CER5 CER5-F1 ACASTATGGAGATWGAGRTAGCT 52 KY458858 - KY458879 2058 100%
CER5-R1 TGCTTCTAGTGGAGAGGAG
CER7 CER7-F1 CGTTTAACAGTGAACGAGAAG 55 KY458880 - KY458893 1032 100%
CER7-R3 CCTCCACTRGTGARAGATG
6
Table S2. Results of likelihood ratio test of hypotheses of positive selection on retaining the gain or loss of LAEWC trait. The result shows that all LAEWC related genes were not positively selected for retaining the gain of LAEWC or retaining the loss of LAEWC. These three hypotheses were tested under the branch model implemented by PAML with labeling “$” on foreground branches, which indicates allowing ω > 1 on all deriving branches of the marked foregrounds. The results showed that none of null hypotheses can be rejected by the alternative hypotheses in all four LAEWC related genes.
Hypothesis a Gene lnL0 b lnLA b 2ΔL df P
Hypothesis 1’ CER1 -2969.330 -2970.308 -1.963 1 NA CER3 -2923.210 -2922.587 1.245 1 0.265 CER5 -3516.910 -3516.750 0.326 1 0.568 CER7 -2009.030 -2009.013 0.028 1 0.866 Hypothesis 2’ CER1 -2969.330 -2969.950 -1.246 1 NA CER3 -2923.210 -2923.153 0.113 1 0.737 CER5 -3516.910 -3516.910 0.005 1 0.943 CER7 -2009.030 -2008.363 1.329 1 0.249 Hypothesis 3’ CER1 -2969.330 -2968.744 1.166 2 0.558 CER3 -2923.210 -2923.126 0.167 2 0.920 CER5 -3516.910 -3516.533 0.760 2 0.684 CER7 -2009.030 -2008.317 1.422 2 0.491
a Hypotheses modified from Fig. 1 and Table 1, but the foreground branches are changed to all deriving branches of the marked branches.
b lnL
0: natural logarithm of the likelihood of null model; lnLA: natural logarithm of the likelihood of alternative mode
7
Table S3. Ecophysiological measurements and altitudinal distribution of Lithocarpus species tested in this study
Species LAEWC N(YII) YII±STD PA δ13C δ15N C N C/N Min Alt Max Alt ΔAlt
L. amygdalifolius waxy 40 0.7709±0.0267 47.70 -31.076 -0.856 0.550 0.015 36.552 250m 2000m 1750m L. brevicaudatus non-waxy 20 0.6814±0.0181 44.11 -31.018 -0.862 0.499 0.017 29.961 200m 2350m 2150m L. cornea non-waxy 20 0.6995±0.0382 72.68 -30.654 -0.510 0.484 0.020 24.170 100m 1400m 1300m L. dodonaeifolius waxy 20 0.7457±0.0326 44.53 -31.254 -1.618 0.550 0.014 38.397 350m 1600m 1250m L. formosanus waxy 20 0.7006±0.0206 45.33 -31.833 -1.393 0.504 0.014 36.320 100m 550m 450m L. glaber waxy 20 0.7376±0.0273 28.65 -30.451 -0.499 0.499 0.020 24.504 450m 1050m 600m L. hanceii non-waxy 20 0.7438±0.0245 26.72 -33.455 -0.964 0.503 0.031 16.110 100m 2700m 2600m L. harlandii non-waxy 20 0.7266±0.0255 30.00 -31.962 -1.589 0.482 0.015 32.745 350m 600m 250m L. kawakamii non-waxy 20 0.7345±0.0403 34.03 -32.413 -0.512 0.491 0.026 18.893 350m 2350m 2000m L. konishii non-waxy 52 0.6646±0.0541 52.87 -30.841 1.125 0.483 0.020 24.220 100m 1150m 1050m L. lepidocarpus waxy 40 0.7702±0.0245 61.07 -31.334 -0.606 0.529 0.026 20.297 600m 2230m 1630m L. nantoensis waxy 20 0.6290±0.0250 83.09 -31.844 -2.622 0.481 0.017 29.146 550m 1300m 750m L. shinsuiensis waxy 20 0.7451±0.0315 103.10 -30.893 -1.509 0.495 0.013 38.697 300m 1200m 900m L. taitoensis waxy 20 0.7236±0.0468 36.46 -32.009 -0.763 0.521 0.018 28.848 700m 1300m 600m
LAEWC: leaf abaxial epicuticular wax crystals N(YII): sample size of YII measurements
YII±STD: phytochemical yield of photosystem II and the standard deviation PA: contents of phenolic acids