Visualization for High-dimensional Data: VisHD
Cheng-Chih Yang
1, Cheng-Chieh Chiang
2, 3, Yi-Ping Hung
1, Greg C. Lee
2 1Dept. of Computer Science and Information Engineering, National Taiwan University, Taiwan.
2Dept. of Information and Computer Education, National Taiwan Normal University, Taiwan.
3
Dept. of Information Technology, Takming College, Taiwan.
[email protected], [email protected], [email protected], [email protected]
Abstract
This paper presents a visualization tool, VisHD, that can visualize the spatial distribution of vector points in high dimensional feature space. It is important to handle high dimensional information in many areas of computer science. VisHD provides several methods for dimension reduction in order to map the data from high dimensional space to low dimensional one. Next, this system builds intuitive visualization for observing the characteristics of the data set, whether these data are pre-defined labels or not. In addition, some useful functions have been implemented to facilitate the information visualization. This paper, finally, gives some experiments and discussions for showing the abilities of VisHD for visualizing high-dimensional data.
Keywords--- information visualization, dimension reduction, high-dimensional data.
1. Introduction
During the last decade, multimedia information has been widely used in the world. Multimedia information is often modeled as feature vectors in high dimensional feature space. For example, color, texture, or shape feature space is commonly used for representing image contents. Handling high dimensional data set is a critical issue in many areas of computer science. However, the ways to dealing with high dimensional data are mostly based on mathematical theories and thus provide only abstract concepts instead of visual intuitions. Information visualization is a good way to setup the presentation of abstract data in a graphical form so that the user may use his visual perception to evaluate and analyze the data [1].
There are many researches for the visualization issue of high dimensional data or large data set. Shamir showed that feature space analysis using the mean shift procedure could provide a powerful tool for visualizing and interrogating data [6]. Kienreich et al. presented a system, InforSky, that employs a 2D graphical representation with variable magnification, much like a telescope, to visualize all documents as stars, hierarchical structures as constellations, and the whole knowledge repository as a galaxy[4]. In [5], Novotny discussed the visualization problems for large data set, and then he proposed an approach combining data clustering and visual abstraction.
Two major issues of high dimensional information are concerned in this work: 1. the visualization of the spatial distribution of feature points in high dimensional space; 2. the dimensionality problem of the feature space. Let us discuss the following illustration. Given a set of images with some relevance, e.g. some face images of one person, we should expect that vector points associated with these images are close in feature space. Assume these vectors are closer in color space than in texture space, then it means that the color feature are proper to represent the set of images than texture feature. Thus we need a visualization tool for observing that. However, multimedia data are often high dimensional. The technique for dimension reduction is necessary for visualizing the data behavior in feature space.
Our goal in this paper is to build a visualization system, we call it as VisHD (Visualization for High-dimensional Data), for serving the user to realize the characteristics of data with different feature spaces and different techniques of dimension reduction. The proposed system can visualize the spatial distribution of interesting data in high dimensional feature space. In VisHD, three techniques, including PCA, LDA, and Sammon, are chosen for reducing the feature dimension. VisHD does not only provide different
perspectives for labeled or non-labeled data, but also design some convenient functions of the data visualization for the user.
The rest of this paper is organized as follows. In section 2,we will briefly introduce dimension reduction. The details of the proposed system are presented in the section 3. Section 4 shows some experiments and discussions for our system. And finally, the conclusion and future works are given in the section 5.
2. Dimension reduction
Many useful techniques for reducing the feature dimensions had been well known. In this section, we will give a brief discussion, most referred to [2][3], for some widely-used approaches for dimension reduction. Principal Components Analysis (PCA) and Linear Discriminant Analysis (LDA) are two most famous approaches to reducing dimensions of data. The former is to find a subspace consisting of orthogonal bases for effectively representing data. The latter is to find a subspace for optimizing discriminability. Factor Analysis (FA), another approach, assumes that the measured variables depend on some unknown, and often unmeasured, common factors. The goal of FA is to uncover such relations, and then the dimension can be reduced by use of the factor model. Independent Component Analysis (ICA) seeks linear projections, not necessarily orthogonal to each other, that are as nearly statistically independent as possible.
Besides, the traditional approaches for dimension reduction may not preserve the original “structure” of the input data. Here, the word “structure” refers to geometric relationship among subsets of the data vectors. The Sammon algorithm, proposed in [7], designs a method of mapping data from high dimension to lower, e.g. 2D or 3D, space while trying to preserve the data “structure.” In [10], Weinberger and Saul proposed an interactive approach of a non-linear mapping for the manifold from the high dimensional space to the lower dimension one. The mapping will not keep the distance of sampled points in the feature space, but keep the structure on the manifold.
We adopt three approaches of dimension reduction: PCA, LDA, and Sammon, for our VisHD system. In the original algorithm of PCA or LDA, the dimension for best reducing data is automatically computed. However, we set the reduced dimension of PCA/LDA as 2 for the purpose of visualization. Certainly, the output dimension of Sammon is also 2. In the original Sammon algorithm, the initial estimation of the
interactive process is random sampled. In VisHD, two kinds of initializations are used: by random or by PCA. Besides, VisHD also provides the manual-selection for allowing the user to choose some two dimensions of the data. The aim of this function is that the user can analyze or compare the relationship among data by viewing two chosen variables.
3. System description
3.1. Overview
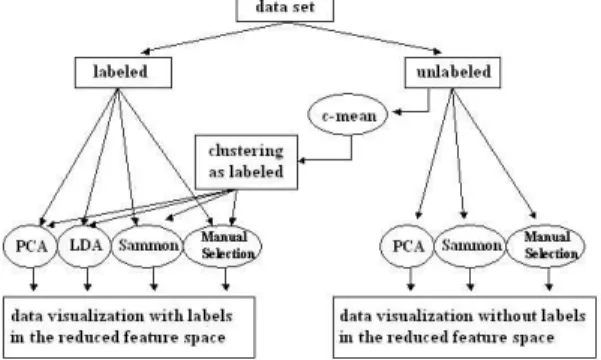
Figure 1 shows the overview of VisHD. The proposed system accepts two kinds of input data: labeled and unlabeled data. The labeled data implies the data set with pre-defined classes. If the source data is unlabeled, the user may decide whether the data is clustered by the standard c-mean clustering method. That is to say, the user can use the classes generated by the standard c-mean clustering instead of the pre-defined labels.
Figure 1. Overview of VisHD
After the data are completely loaded, the user then selects the methods for dimension reduction, as stated the previous section, including PCA, LDA, Sammon with random initial configuration, Sammon with PCA initial configuration, and manual-selection. The user can choose one of these methods according to the aim of the data analysis. For example, if the user wants to analyze the disciminability of features for a data set, he should use LDA for previewing the data classification.
The methods for dimension reduction are used to handle the data set, either labeled or unlabeled, and then VisHD will visualize their spatial distribution in the feature space. In the case of the labeled input data, the output would be automatically shown in different tab pages with respect to the input class labels thus gives the user more ideas of the characteristics of each cluster. Otherwise, in the case of the unlabeled data, all data will be displayed on the window.
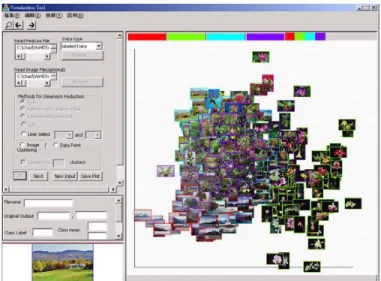
Figure 2. The user interface of VisHD
3.2. Data Input
The data input is of high dimension and of text file format, for example, if a set of 1000 data vectors has 20 dimensions, the input text file would be 20 columns and 1000 rows. The user could provide either labeled or unlabeled data. In the case of unlabeled data, the user could then check the clustering option for automatically generating labels. Therefore, the output results would be displayed in tab windows according to data labels.
In most of the cases, the user would provide the input text file as well as the input image file. Thus, VisHD can display all images directly on the window associated with the input feature vectors. On the other hand, this system would show the data points as circles instead of images if the images are not available.
3.3. Visualization
As the picture shown in figure 2, the left part of the window in VisHD is the parameter area, and the right part is the displaying area. In the parameter area, the input setting contains the path of the feature file (and the path of the image file if available), the method of the dimension reduction, and the option of the c-mean clustering if the input data is unlabeled. In addition, the parameter area also contains the selected image and its detail information.
In the displaying area, the result of the selected method will be the images distributed on this window where the coordinates of each image corresponds to the 2D vector reduced from the original high-dimension feature. Let the number of the classes of the
data be k, then the number of tab pages will be k+1 where one tab page displays all images, and each of other k tab pages contains data of individual class. Furthermore, the displaying area will have only one tab window if k=1, which also implies the data is unlabeled. In figure 2, the displaying area shows the distribution of all data with four image categories by using PCA. The border color of an image represents the class, in the input or clustering labels, of the image. In figure 3, the four pictures show the individual class of all data in figure 2.
(a) (b)
(c) (d)
Figure 3. The individual class of all image data Because the image database may contain plenty of images, VisHD also supply zoom in/out function, thus make it easy for the user to focus on certain images which they are nearly overlapping in the original scale.
The user can also use the function of “go back” for reviewing the previous zoomed view. Besides, VisHD shows the detail information of a selected image shown in the displaying area if the user is interested in any one picture among others in the displaying area. Finally, the function of “image save” makes it possible for the user to save the entire displaying area as an image file.
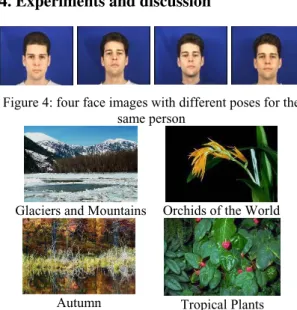
4. Experiments and discussion
Figure 4: four face images with different poses for the same person
Glaciers and Mountains Orchids of the World
Autumn Tropical Plants Figure 5: examples and semantic names of four image
categories
In our experiments, we adopt two kinds of data sets: face images and general-purposed images. The former contains color face images of four persons from XM2VTS database where each person has four images with different poses. All images of the same person will be in the same class. On the other hand, the latter consists of 400 images in four categories from Corel Photos where each category contains 100 images. The four categories of Corel images include Glaciers and Mountains, Orchids of the World, Autumn, and Tropical Plants. Figure 4 and figure 5 show some example images of face images and the Corel Photos, respectively, used in our experiments.
Here, figure 6 illustrates the first experiment, choosing the data set as face images and extracting their color moments [8] in LAB color space, in this paper. Four methods of PCA, LDA, Sammon with PCA initialization, and Sammon with random initialization are used for visualizing the data shown in figure 6(a), (b), (c), and (d), respectively. In the figure, the displaying area contains all of data, and image borders with different color present different classes of
the face images. By observing the visualization results, the figure 6(a) shows that the data distribution in each class is compact. Figure 6(b) shows the better discriminability because of using LDA. Both of them are consistent with the theory of PCA and LDA, respectively. In addition, the goal of Sammon algorithm is to map data and to preserve their structure in original feature space, shown as figure 6(c) and 6(d).
(a) PCA (b) LDA
(c) Sammon with PCA initialization
(d) Sammon with random initialization Figure 6. Analyzing face images in VisHD
(a). feature C (b). feature T
(c). feature C+T
Figure 7. The distribution of the image class “Glaciers and Mountains” with PCA in different feature spaces,
Next, the second experiment will show the 2D visualization for same data with different features. In figure 7(a), (b), and (c) are the 2D distribution of the same image category “Glaciers and Mountains” in different feature spaces, including color moments (C) in LAB color space, Tamura (T) [9], and both of them (C+T), respectively, where PCA is used for reducing the dimensions. The goal of PCA is to seek the principal components of the data set in the feature space. Thus, the denser the projected result of the data is, the better the represented feature is. Comparing the figure 7(a), (b), and (c), we know figure 7(a) is densest. That is to say, the best feature to represent the category “Glaciers and Mountains” with 100 images is color moments. This example illustrates that our system, VisHD, can assist the user in choosing the representative features for data before he analyzes these data based on mathematical model.
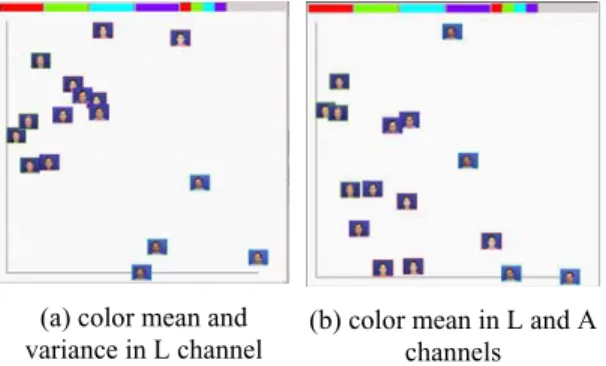
(a) color mean and variance in L channel
(b) color mean in L and A channels Figure 8. Two selected dimensions for face images.
Figure 8 depicts the ability, in VisHD, of manual-selection, which allows the user for observing any two dimensions of the data. Color moments in LAB color space are extracted from the data set of face images. The chosen dimensions of figure 8(a) and figure 8(b) are color mean and variance of face images in L channel, and color mean of them, respectively, in L and A channels. The data distribution of the same class in figure 8(a) is more compact than that in figure 8(b). That means the two variables, mean and variance of face images in L channel, are more representative for face images.
5. Conclusion
This paper presents the details of VisHD, which is a visualization tool for serving the user to realize the characteristics of data with different feature spaces and
different techniques of dimension reduction. We have discussed the design of VisHD, and given some experiments for showing the abilities of this system. In the future, more methods for dimension reduction will be added into VisHD. Also, as for the data of very high dimensions (e.g. over one thousand), to establish a mechanism, which incorporates dimension reduction and information visualization, is necessary for generating more reasonable 2D or 3D results.
6. Acknowledgements
This work was partially supported by National Science Council of Taiwan under the grants of NSC 92-2213-E-002 -082.
7. References
[1] D. Carr. Guidelines for Designing Information Vis-ualization Applications. In Proceedings of ECUE 1999. [2] R. O. Duda, P. E. Hart, and D. G. Stork, Pattern
Classification, 2nd Ed. John Wiley & Sons, Inc., 2001. [3] I. K. Fodor, "A survey of dimension reduction
techniques," technical report, Lawrence Livemore National Laboratory, June 2002
[4] W. Kienreich, V. Sabol, M. Granitzer, F. Kappe, and K. Andrews. InfoSky: A System for Visual Exploration of Very Large, Hierarchically Structured Knowledge Spaces. In Proceeding of FGWM 2003, Oct. 2003.
[5] Matej Novotny. Visually Effective Information Visualization of Large Data. Technical Report, the research center for Virtual Reality and Visualization (VRVis). 2004.
[6] A. Shamir. Feature-Space Analysis of Unstructured Meshes. In Proceedings of IEEE Visualization 2003. pp. 185-192.
[7] W. Sammon. A nonlinear mapping for data structure analisys. IEEE Transactions on computers, vol.C-18, May 1969
[8] M. Stricker and M. Orengo. Similarity of Color Images. In Proceeding SPIE Storage and Retrieval for Image and Video Databases. pp.381-392, 1995.
[9] H. Tamura, S. Mori, and T. Yamakaki. Textural Features Corresponding to Visual Perception. IEEE Trans. on Systems, Man, and Cybernetics, vol. SMC-8, pp.460-473, Jun. 1978.
[10] K. Q. Weinberger and L. K. Saul. Unsupervised Learning of Image Manifolds by Semidefinite Programming, in Proceeding CVPR 2004.