Human Activities and Environmental Changes along Taiwan’s West Coast
Ts’ui-jung Liu*
This article was first presented at the Sixth Conference of European Society for Environmental History (ESEH2011), held at Turku, Finland, on June 28-July 2, 2011, and later published in Storia e futuro, No.29 (Giugno 2012), available online at: http://www.storiaefuturo.com/it/numero_29/storia_e_futuro.php. (Chinese characters are added in this text.)
Abstract
The coastline surrounding the Island of Taiwan is measured to be 1,139 km with different topographies. Along the island’s west coast, from the estuary of the Tamsui River in the north to that of the Fengkang Stream in the south, is uplifted coast with topographies of gravel beach, sandy beach, sand dune, sandbank, lagoon as well as newly reclaimed tidal land. This paper attempts to investigate human activities and their impacts on the environment along this costal area. With a brief overview of human settlements in this area, the discussion will focus on the development of tidal land, aquaculture, and establishment of coastal industrial parks. These activities brought forth economic gains; however, there are related issues, such as subsided stratum, pollution, water and soil salinity, which cannot be ignored.
1. Introduction
2. Reclamation of Tidal Land 3. Development of Aquaculture 4. Development of Industrial Parks 5. Mitigation Effort and Limitation
1. Introduction
The Island of Taiwan has a land area of 35,806.47 km2 and a coastline of 1,139.25 km as in 2009.1 The coast of Taiwan is generally divided into four parts with different topography. The northern mixed coast, from the estuary of the Tamsui River 淡水河 in the northwest to the headland of Sandiaojiao 三貂角 in the northeast, has both rocky and sandy sections produced by uplifting and depression. The eastern fault coast, from Sandiaojiao to Hsuhai 旭海 in the southeast, except for a few alluvial deltas, has the mountains parallel to the coastline facing the Pacific Ocean. The southern coral-reef coast along the Hengchun 恆 春Peninsula extends from Hsuhai to Fengkang 楓港 in the southwest. The western uplifted
* Distinguished Research Fellow, Institute of Taiwan History, Academia Sinica.
1
coast, from Fengkang to the Tamshui River, is close to deposit plains with straight sandy coast without deep bays.2 (See Map 1) This paper will focus on Taiwan’s west coast.
2
Department of Geography, National Taiwan Normal University, http://twgeog.geo.ntnu.edu.tw/ english/gemophology/gemophology.htm. Searched on 2010/12/18.
A study in 1980 divided Taiwan’s west coast into three sections. The northern section, from the Tamsui River to the Tachia 大甲 River, including the coast along Taoyuan 桃園, Hsinchu 新竹, Miaoli 苗栗, and Taichung 臺中 Counties, has a length of 177 km with gravels scattering along sandy beach. The middle section, from the Tachia River to the Tsengwen 曾文 River can be further divided into two parts: the one along the coast of Changhua 彰化 and Yunlin 雲林 Counties has a length of 93 km with sandy beach and wide intertidal zone created by sediments deposited mainly from the Chuoshui 濁水 River; and the other along the coast of Chiayi 嘉義 and Tainan 臺南 Counties has a length of 70 km with sandy beach, offshore sandbank and lagoon. The southern section, from the Tsengwen River to the Fengkang Stream, including the coast along Tainan City, Kaohsiung 高雄 County, Kaohsiung City, and a part of Pingtung 屏東 County, has a length of 120 km with sandy beach; and some earlier tidal lands, sandbanks and lagoons had already become dry land. By comparing the maps of 1904, 1926, 1954 and 1975, it was found that Taiwan’s west coast had extended westward, although the speed of movement varied at different localities.3
In 2008, the Construction and Planning Agency of Ministry of the Interior initiated a program and entrusted Taiwan CECI Engineering Consultants, Inc. to conduct surveys on intertidal zone. As a result, the current situations of Taiwan’s west coast at 10 sections are as follows:4
(1) The coast of Taoyuan has a length of 39 km with sandy beech. Previously, there was a sand dune with a length of 8 km and height of 8 km as well as a dense windbreak forest. Now, the sand dune is drawing backward and the windbreak is disappearing. The width of intertidal zone is about 100-300 meters.
(2) The coast of Hsinchu has a length of 28 km with characteristics of large tide range (about 4.8 m) and wide intertidal zone, but the coastline at many places are drawing backward and windbreak forests are disappearing. There are three wetlands along this coast, at Hsianshan 香山 and Hsinfeng 新豐 townships and the estuary of Keya 客雅 Creek.
(3) The coast of Miaoli has a length of 50 km. As previously, the amount of sediments was rather large, there are offshore sandbanks between Houlung 後龍 and Tungsiao 通霄 and the width of intertidal zone is 0.7-1 km around Waipu 外埔 fishing port. At Tungsiao and Yuanli 苑裡, some sand dunes are eroding. At the estuary of Chungkang 中港 Stream, there are mangrove and coastal forests nearby.
(4) The coast of Taichung has a length of 41 km. There are alluvial plains at the estuaries of Taan 大安 and Tachia Rivers with high tidal range (about 5.2 m) and wide intertidal zone; the southern part is marsh swamp at the estuary of Wu 烏 (also known as
3
Shih Tsai-tien, 1980, “The Evolution of Coastlines and the Development of Tidal Flats in Western Taiwan,”
Geographical Research, No. 6, pp. 5-14.
4
See Intertidal Zone Designated and Land Use Classification, gisapsrv01.cpami.gov.tw/cpatidal/ topicA/ index1_1.html;gisapsrv01.cpami.gov.tw/cpatidal/topicC/index3_1.html; gisapsrv01.cpami. gov.tw/cpatidal / topicC/index3_2.html; and gisapsrv01.cpami.gov.tw/cpatidal/topicC/index3_3.html. Searched on 2010/12/17.
Tadu 大肚) River. At the estuary of Tachia River is Kaomei 高美 wetland conservation area.
(5) The coast of Changhua has a length of 61 km with rising alluvial plain created by sediments deposited mostly from the Wu and Chuoshui Rivers. At the time of ebb tide, the beech can reach a width of 5 km. On the average the wetland has a width of 2.7 km with the widest part reaches 4.5 km at Fanyuan 芳苑 area.
(6) The coast of Yunlin has a length of 55 km. In recent years, exploitations, dredging of rivers and reduction of sediments had caused sandbanks to disappear gradually or even completely. The width of tidal land at Taisi 臺西 is about 2.1 km. The Yunlin coast has the largest area of land subsidence.
(7) The coast of Chiayi has a length of 41 km with considerable windings affected by ocean waves and river sediments, and there are sandbanks and lagoons. The lagoons are shrinking and Haomeiliao 好美寮 wetland is disappearing rapidly due to reclamation of tidal lands. The problem of land subsidence is most serious at two coastal townships.
(8) The coast of Tainan has a length of 77 km with several offshore sandbanks created mostly by sediments from the Tsengwen River. These sandbanks are lining about 2 km offshore. For recent decades, lagoons formed previously have remained rather stable. The reclaimed tidal lands are mostly utilized for fish ponds. There are several wetlands along this coast and the total conservation area is estimated to be 50,370 ha, with the shares of land and sea to be 26.2% and 73.8% respectively.
(9) The coast of Kaohsiung has been developed rapidly for industry with big factories, thermal power plant and shipyards. Fishing resource is abundant around Hsingda 興達 port; a fishing resource conservation area and several fishing prohibition areas are established there.
(10) The coast of Pingtung is the most seriously eroded section in Taiwan because of the steep submarine slope. The development of aquaculture since 1974 had induced land subsidence at some parts, particularly at Chiatung 佳冬 and Linbian 林邊. In 2005 the depth of land subsidence reached 3.22 m and the area reached 7.4 km2.
As for the human settlements along Taiwan’s west coast, here the population density in terms of persons per square km during 1955-2010 is taken as an indicator for illustrating changes at 10 Counties and Cities along the west coast.5
In Taoyuan County (Figure 1.1), the average density increased from 330 in 1955 to 1,640 in 2010. The four coastal rural townships had almost the same density as the county average by 1965, but from then on the density of coastal townships became much lower except for Luchu 蘆竹 where the density became higher after 2005.
5
In December 2010, there was a rearrangement of administration units and thus, Taichung County and City were merged as Taichung City, Tainan County and City as Tainan City, and Kaohsiung County and City as Kaohsiung City. The population densities of these three mega-cities are calculated by adding the original county and city together, while districts under their jurisdiction are not affected.
In Hsinchu County (Figure 1.2), the average density increased from 278 to 450 during 1955-1980 and then decreased to 257 in 1985 because of the administration rearrangement in 1982 for Hsinchu City. But the average density increased again to 359 in 2010. The two coastal townships, one urban and the other rural, as well as Hsinchu City all had higher density than the county average.
The Population Density of Taoyuan County and Coastal Townships
0 500 1,000 1,500 2,000 2,500 1955 1965 1975 1985 1995 2005 Year Persons per square km Taoyuan County Luchu Tayuan Kuanyin Hsinwu
The Population Density of Hsinchu County and City and Coastal Townships
0 500 1,000 1,500 2,000 2,500 3,000 3,500 4,000 1955 1965 1975 1985 1995 2005 Year persons per square km Hsinchu County Hsinfeng Chupei Hsinchu City Figure 1.1: Taoyuan County Figure 1.2: Hsinchu County and City
In Miaoli County (Figure 1.3), the average density increased from 212 to 308 in 1955-2010. The density of Chunan 竹南 urban township was much higher than the county average and showed a growing trend, while the three coastal rural townships had slightly higher density than the county average and maintained rather stable.
In Taichung City (Figure 1.4), a merger of county and city, the average density increased from 351 to 1,196 during 1955-2010. The five coastal districts all had higher density than the city average; but Taan, a rural district, had its density decreased slightly after 1985, and Wuchi 梧棲 and Longjing 龍井 districts, one urban and the other rural, had growing densities.
In Changhua County (Figure 1.5), the average density increased from 733 in 1955 to 1,225 in 2005 and then decreased slightly to 1,217 in 2010. Of the six coastal townships, only the densities of Lukang 鹿港 and Shenkang 伸港, one urban and the other rural, were higher than the county average.
In Yunlin County (Figure 1.6), the average density increased from 460 in 1955 to around 620 in 1970-1980 and then decreased to 556 in 2010. The four coastal townships are all rural with densities lower than the average, except for Taisi 臺西 where the density was higher during 1965-1985; and Mailiao 麥寮 had its density increased after 2005 apparently due to industrial development which will be discussed later.
The Population Density of Miaoli County and Coastal Townships
0 500 1,000 1,500 2,000 2,500 1955 1965 1975 1985 1995 2005 Year Persons per square km Miaoli County Chunan Houlung Yuanli Tungsiao
The Population Density of Taichung City and Coastal Districts
0 500 1,000 1,500 2,000 2,500 3,000 3,500 1955 1965 1975 1985 1995 2005 Year Persons per square km Taichung City Tachia Taan Chingshui Wuchi Longjing Figure 1.3: Miaoli County Figure 1.4: Taichung City
The Population Density of Changhua County and Coastal Townships
0 500 1,000 1,500 2,000 2,500 1955 1965 1975 1985 1995 2005 Year Persons per square km Changhua County Shenkang Hsiensi Lukang Fuhsing Fanyuan Tacheng
The Population Density of Yunlin County and Coastal Townships
0 100 200 300 400 500 600 700 195 5 196 5 197 5 198 5 199 5 200 5 Year Persons per square km Yunlin County Mailiao Taisi Sihu Kouhu
Figure 1.5: Changhua County Figure 1.6: Yunlin County
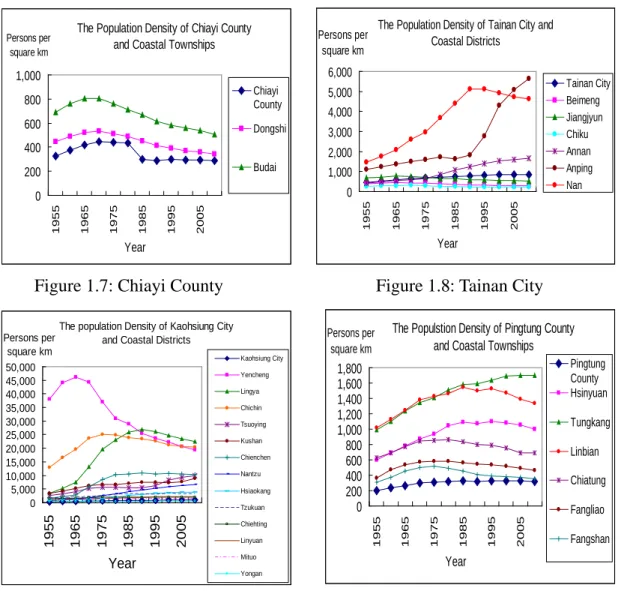
In Chiayi County (Figure 1.7), the average density increased form 325 to 445 in 1955-1970 and then decreased to 300 in 1985 and further to 286 in 2010. The two coastal townships, one urban and the other rural, had their densities higher than the county average, but were in decline after 1970.
In Tainan City (Figure 1.8), a merger of county and city, had the average density increased from 443 to 855 during 1955-2010. Of the three coastal urban districts, Annan 安 南 had a lower density before 1982, Anping 安平 had a density increased rapidly after 1990, while that of Nan (South) decreased slightly. But the three coastal rural districts had a lower density and showed a declining trend after 1965.
In Kaohsiung City (Figure 1.9), a merger of county and city, the average density increased from 298 to 941 during 1955-2010. Of the 14 coastal districts, only Yongan 永安 rural district had a lower density then the city average after 1965. The three small urban districts, Yencheng 鹽埕 (1.42 km2), Chichin 旗津 (1.46 km2) and Lingya 苓雅 (8.15 km2), had much higher density than the city average; Yencheng had its density declined
rapidly after 1972, while Lingya and Chichin declined slightly only after 1990. Tsuoying 左營, Chienchen 前鎮, Kushan 鼓山 and Nantzu 楠梓 districts had the density lying in the middle while other six districts had the density closer to the city average.
In Pingtung County (Figure 1.10), the average density increased from 199 in 1955 to 329 in 1995 and then decreased slightly to 315 in 2010. The six coastal townships all had the density higher than the county average; and Tungkang 東港 urban township had the highest and increasing density, while other rural townships had their densities decreased slightly after 1990-1995.
The Population Density of Chiayi County and Coastal Townships
0 200 400 600 800 1,000 1955 1965 1975 1985 1995 2005 Year Persons per square km Chiayi County Dongshi Budai
The Population Density of Tainan City and Coastal Districts 0 1,000 2,000 3,000 4,000 5,000 6,000 1955 1965 1975 1985 1995 2005 Year Persons per square km Tainan City Beimeng Jiangjyun Chiku Annan Anping Nan
Figure 1.7: Chiayi County Figure 1.8: Tainan City The population Density of Kaohsiung City
and Coastal Districts
0 5,000 10,000 15,000 20,000 25,000 30,000 35,000 40,000 45,000 50,000 1 95 5 1 96 5 1 97 5 1 98 5 1 99 5 2 00 5 Year Persons per square km Kaohsiung City Yencheng Lingya Chichin Tsuoying Kushan Chienchen Nantzu Hsiaokang Tzukuan Chiehting Linyuan Mituo Yongan
The Populstion Density of Pingtung County and Coastal Townships
0 200 400 600 800 1,000 1,200 1,400 1,600 1,800 1955 1965 1975 1985 1995 2005 Year Persons per square km Pingtung County Hsinyuan Tungkang Linbian Chiatung Fangliao Fangshan Figure 1.9: Kaohsiung City Figure 1.10: Pingtung County
The population density in Taiwan’s West coast in 2010 was illustrated in Map 2. In the ten sections there were altogether 53 coastal townships (districts), of which 37 have their population density higher than the county (city) average.
With this background of coastal geography and human settlements the discussion below will be focused on reclamation of tidal land, development of aquaculture and industry along Taiwan’s west coast.
2. Reclamation of Tidal Land
Major rivers in Taiwan run mostly from the central high mountains to the west coast carrying a large amount of sand and mud to the estuaries; and with the function of waves the sediments gradually deposited to become tidal land (known in Chinese as hai-pu-di 海埔地). This is an area lying between the high water and low tidal mark where the land encounters the sea; it is full of sunshine and nutrition and hence is an important ecosystem for fishery. Moreover, because the water is shallow, it is feasible to build dikes for reclaiming the land.
The historical records of Taiwan revealed that from the eighteenth century, tidal lands were gradually reclaimed for farmlands, fish ponds, and slat fields. For instance, as Taiwan’s west coast has been moving westward, it was estimated that some 40,000 ha of coastal plain in today’s Tainan area were gradually shaped in the past centuries.6 A document of Wen-kai shu-yuan 文開書院, an old-style academy at Lukang revealed that by 1827 the academy owned 50 chia 甲 (1 chia = 0.97 ha) of reclaimed tidal land.7 A land deed signed in 1862 stated that a piece of tidal land reclaimed two generations ago at the coast of today’s Changhua was rented out for cultivation.8 Another land deed was signed in 1884 for renting a piece of tidal land reclaimed along the coast of today’s Taichung.9 In 1885, a piece of tidal land was reclaimed by the British merchant, Elles & Company, at Anping Harbor in Tainan.10
In 1937, the Japanese Colonial Government in Taiwan entrusted two companies, Kōgyō 興業 Sugar Manufacturing Company and Taiwan Development Company, to reclaim tidal land at Hsinkang 新港 in today’s Chiayi County; an area of 738 ha was completed in 1941 with another 2,264 ha planned to be completed in 8 years but the work was interrupted by the war. In 1940, the two companies were again entrusted to develop tidal land at Lunbei 崙背 in today’s Yunlin County. Kōgyō Company completed in 1942 a piece of 872 ha which was transferred to Taiwan Sugar Company after the war. Taiwan Development Company handled a larger scale project in 1941 and completed in 1945 a piece of 1,700 ha which was transferred later to Taiwan Land Bank.11
6
Wei Yang-hsien, Development and Utilization of Taiwan’s Tidal Land (Nantou: Taiwan Provincial Government, 1973), p.71; Shih Tsai-tien, 1980, pp. 19-20; Chiau Wen-yen, 1993, “Conflicts with the Sea──a reflection and prospective on the development of tidal land,” Science Monthly, 24(9): 674-686, see
http://140.111.103.200/science/content/1993/00090285/0009.htm, searched on 2010/3/23.
7
Chou Si, Gazetteer of Changhua County (Chang-hua hsien-chih ), in Collections of Taiwan Documents
(Taiwan wen-hsien tsung-kan) No. 156 (Taipei: Bank of Taiwan, 1962), p. 403.
8
Temporary Taiwan Old Manners and Custom Survey Society (ed.), Real Rights in Taiwan’s Private Law (Taiwan ssu-fa wu-chuan pien), in Collections of Taiwan Documents No. 150 (Taipei: Bank of Taiwan, 1963), pp. 929-930.
9
Real Rights in Taiwan’s Private Law, pp. 257-258.
10
Tang Tsan-gun, A Record of Information about Taiwan (Tai-yang chien-wen-lu), in Collections of Taiwan
Documents No. 30 (Taipei: Bank of Taiwan, 1958), p. 38.
11
Wei Yang-hsien, pp. 71-72. Yin Chang-fu, 1990, A Study on the Methods of Development Tidal Lands in
Taiwan’s West Coast (Nantou: Taiwan Provincial Government), pp. 18-19. A recent study on tidal land
reclamation in Yunlin during the Japanese Colonial Period, see Shu-wan Ting, “The Development and Utilization of Marginal Land in Taiwan during the Japanese Colonial Period – the Yunlin Area as Example,” M.A. thesis of the Department of History, Tamkang University, 2010, pp. 84-110.
After the World War II, under the pressure of rapidly increasing population, the government policy encouraged reclamation of new lands. In 1947, Tainan County Government developed 900 ha for aquaculture. In 1955, Joint Commission on Rural Reconstruction initiated a program for developing tidal lands and conducted surveys for evaluating the feasibility. In 1956, Taiwan Provincial Government approved the Regulation for Developing Tidal Land which allowed private people to apply for reclamation; but this Regulation was annulled in 1959 due to criticisms and conflict interests. In 1961, Executive Yuan formed a planning committee for tidal land reclamation and the task was entrusted in 1963 to Taiwan Provincial Government. In 1965, the Commission for Land Resource Development in Taiwan Province (hereafter Tutsuhui 土資會) was formally established to take up the task until 1976 when the task was attributed to the Water Control Bureau of Taiwan Provincial Government.12 In 1983 Executive Yuan issued the Regulation for Managing the Development of Tidal Lands and allowed government agencies, farmers, and private agricultural organizations to apply for the development.13 However, this Regulation needed to be revised along with new demands and it was until April 1993 that it was formally legalized to meet non-agricultural purposes.14
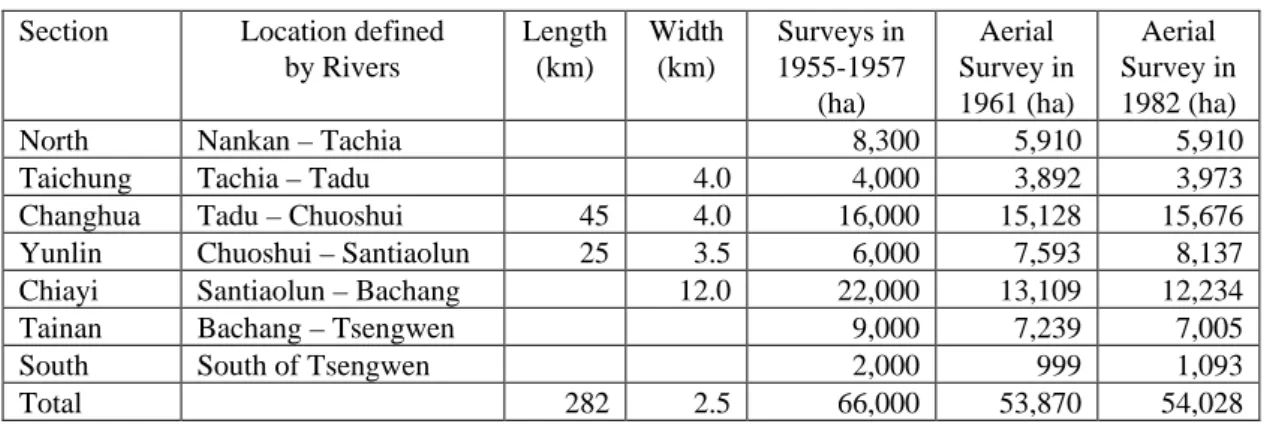
Table 1 shows different estimations available for tidal lands in Taiwan’s west coast through several surveys.
Table 1: The Distribution of Tidal Lands in Taiwan’s West Coast
Section Location defined by Rivers Length (km) Width (km) Surveys in 1955-1957 (ha) Aerial Survey in 1961 (ha) Aerial Survey in 1982 (ha)
North Nankan – Tachia 8,300 5,910 5,910
Taichung Tachia – Tadu 4.0 4,000 3,892 3,973
Changhua Tadu – Chuoshui 45 4.0 16,000 15,128 15,676 Yunlin Chuoshui – Santiaolun 25 3.5 6,000 7,593 8,137 Chiayi Santiaolun – Bachang 12.0 22,000 13,109 12,234
Tainan Bachang – Tsengwen 9,000 7,239 7,005
South South of Tsengwen 2,000 999 1,093
Total 282 2.5 66,000 53,870 54,028
Source: Wang Chang-si, “A Deliberation on the Methods and Principles of Tidal Land Development in Taiwan, ” Quarterly of Taiwan Bank, Vol. 13, No. 2 (1962), p. 58; Cheng Tien-chang, “A Study on the Development of Tidal Land in Taiwan,” M.A. thesis of the Department of Land Economics, National Chengchi University (1970), in Hsiao Cheng (ed.), Materials of Taiwan’s Land and Agriculture, Vol. 28 (Taipei:
Chengwen Publishing Co., 1981), pp. 27-28; Wei Yang-hsien, p. 55; Shih Tsai-tien, p. 19; Yin Chang-fu, pp. 5-6.
The total length of tidal lands in Taiwan’s west coast was estimated to be 282 km and the width 2.5 km on the average. The total area was estimated in 1955-1957 as 66,000 ha, but
12
Wei Yang-hsien, pp. 72-73; Shih Tsai-tien, pp. 19-20; Yin Chang-fu, p.19; Chiau Wen-yen, 1993.
13
Yin Chang-fu, pp. 101-105.
14
Chiau Wen-yen, 1993. This Regulation was revised in March 1996 and again in October 1999. See law.moj.gov.tw/Scripts/Newsdetail.asp?NO=1D0070038, searched on 2011/01/18.
aerial surveys in 1961 and 1982 obtained 53,870 ha and 54,028 ha respectively. Of the total area of tidal lands, it was estimated that 44,000 ha could be developed for cultivation and aquaculture. A detailed estimation in 1993 showed that reclaimable tidal lands were 30,370 ha, of which 43.3% had already been developed and 20.3% were still in the process of development.15
In 1956, Executive Yuan’s Vocational Assistance Commission for Retired Servicemen (hereafter Fudaohui 輔 導 會 ) initiated to apply to Taiwan Provincial Government for allocating tidal lands in Taiwan’s west coast in order to accommodate retired servicemen to develop the tidal land. In 1957, Taiwan Provincial Government agreed to allocate 15,039 ha, of which 2,200 ha in Hsinchu, 7,340 ha in Changhua, and 5,499 ha in Yunlin. Thus, a research group planned to develop a total area of 1,112 ha in Hsinchu. An experiment area of 89 ha was completed in 1959-1962 and another 225 ha in the north part in 1966.16 This experiment in Hsinchu encouraged other public investments to follow suit. Table 2 shows the area of developed tidal lands by 1992.
Table 2: Areas of Developed Tidal Lands at Taiwan’s West Coast by 1992
Period of Development
Location Total Area (ha)
Net Production Area (ha) Farm Land Fish Pond Salt Field Port & Harbor Housing Total 1959-1960 Hsinchu, Experiment 89 61 7 68
1962-1966 Hsinchu, North Zone 225 154 4 158
1963-1967 Tainan, Tsengwen 1,600 1,242 1,242 1964-1970 Chiayi, Auoku 996 770 60 830 1966-1968 Changhua, Wangkung 462 343 10 353 1968-1971 Changhua, Yupu* 820 549 123 672 1971-1977 Tainan, Chiku 1,715 640 640 1973-1974 Yunlin, Taisi 777 657 657 1973- Taichung Harbor 3,973 3,973 3,973 1977-1979 Chiayi, Haomei 160 150 150 1982- Chiayi, Tungshi 103 28 24 23 75 1982- Chiayi, Budai 66 66 66 1984- Miaoli, Tungsiao 130 82 82 1984- Changhua, Yunghsing 599 482 33 515 1984- Yunlin, Hsinhsing 375 300 300 1984- Tainan, Beimen 450 391 391 Chiayi, Budai 809 809 809 Total 13,349 1.107 4,236 1,449 4,067 122 10,981 * This area was re-designated for Changhua Coastal Industrial Park.
Source: Shih Tsai-tien, 1980, p. 20; Yin Chang-fu, 1990, pp. 25-26; Chen Ching-chun, 1994, pp. 29-32.
15
Chen Ching-chun, “A Study on Compensation for Coastal Fishing by the Development of Tidal Lands,”
Yenkao Paotau, No. 25 (1993.10), pp. 26-28.
16
Hsin-Chu Tidal Land Development Commission, Annual Report on Development and Experimentation of
Hsin Chu Tidal Land. (Taipei, December 31, 1962), p. 133-135; Vocational Assistance Commission for
Retired Servicemen (ed.), General Report on Development of Hsin Chu Tidal Land of Taiwan (Taipei, October 1969), pp. 1-3.
In addition to Fudaohui, these development projects were carried out by Tutsuhui, Water Control Bureau, local governments, Taiwan Sugar Company, and Taiwan Salt Company. By 1992, the developed tidal lands had reached a total of 13,349 ha, of which the share of net production area was 82.3%; and of the 10,981 ha net production area, the share of fish ponds was 39.4% and that of Taichung Harbor 36.2%. In other words, the developed tidal lands were mostly for aquaculture but not yet fully utilized. Moreover, there was a problem of private (illegal) occupation of tidal lands. In 1989, a survey study on faming and fishing households using tidal lands in Changhua and Yunlin Counties found that 64.8% (162/250 households) of the users said that they simply occupied the lands, 26% purchased the land, 4.8% rented the land, 4.0% inherited the land, and 0.4% in cooperation with others.17
During 1995-2005, the Construction and Planning Agency of Ministry of the Interior approved nine projects of tidal land development as shown in Table 3.
Table 3: Projects of Tidal Land Development approved in 1995-2005
Time Location Area
(ha) Length (m) Width (m) Purpose 1995.07 Coastal area north of the
Kongsitien Creek, Tamshui
38.6 A demonstration of Danhai New Town
1995.07 South of Hsingda Fishing Port, Kaohsiung
32.0 To stabilize the industrial waste (coal dust)
1995.08 Kaohsiung area 186.0 To stabilize the industrial and construction waste.
2001.05 West side of Chiapao Creek, Linkou
21.0 650 325 The second stage of Linkou Power Plant.
2002.04 Coastal area at Linkou, Taipei
380.0 For filling construction waste soil into the sea.
2002.12 West of Tachuang Sea dike, Hsinchu
17.2 560 400 Keya Waste Water Treatment Plant, Hsinchu.
2003.03 Yongan, Kaohsiung 239.71 To develop tidal lands. 2004.04 Tongsiao, Miaoli
(expired in 2009.03)
To develop tidal lands. 2005.04 Chichin, Kaohsiung 26.49 1,400 190 Middle District Waste Water
Treatment Plant.
Total 941.0
Source: Construction and Planning Agency, Ministry of the Interior,
www.cpami.gov.tw/chinese/index.php?option=com_content&view=article&id=10177&Itemid=53, searched on 2010/12/07.
Of these nine projects, the case in Miaoli was expired in 2009 as the plan did not proceed in time. The other 8 projects together developed 941 ha of tidal lands, of which 484.2 ha (51.5%) were in Kaohsiung, 439.6 ha (46.7%) in Tamshui and Linkou 林口 (Taipei), and the rest 17.2 ha (1.8%) in Hsinchu.
17
In recent decades, tidal lands were reclaimed not only for aquaculture but for industry as will be discussed further in below. Many scholars had expressed their concerns. A geographer pointed out in 1989 that the reclamation of tidal lands would directly destroy the topography, tidal beech, and threaten coastal habitats. After the development is completed, any kind of land utilization will affect indirectly the coastal habitats.18 A scholar of land economics suggested in 1990 that the reclaimed land could be used for industry and recreation, but further development projects should be conducted only by government agencies and private development should not be encouraged.19 A scholar of marine environment pointed out in 1993 that the development of tidal lands could have the benefits, such as increasing the land area, promoting land utilization and improving the livelihood of residents along the coast, providing inexpensive land for industries, fishing ponds, fishing ports, and salt fields, increasing job opportunities, saving the maintenance expenditures on coastal safety, dikes, roads, and water control works, as well as reducing the lost from flooding for nearby farmlands and inland areas. However, after more than 10,000 ha of tidal lands had already been developed and more than 30,000 ha were still in planning, many problems had already emerged. A few alarming points are: the scales of development were usually too big; the plans were often too rough; the balance between development and conservation has been neglected (for example, an area along the coast of Changhua, Yunlin and Chiayi had been designated for protection, but a plan had also been drawn up to develop nearly 20,000 hectares at this area for economic purposes); the managerial efficiency needed to be improved; and many factors of uncertainty required more studies.20
In 2000, a marine biologist pointed out that the loss of biological habitats was due to over development of wetlands, improper ways of fishing and shallow sea aquaculture, pollution and waste, as well as improperly managed marine recreation activities.21 And in 2008, an expert of geotechnical engineering pointed out the problems related to the development of tidal lands: the destruction of ecosystem along the coast and the withdrawal of sea sands and construction of dikes have changed the coastal topography and hydrology and caused erosion of the coast and subsidence of reclaimed lands.22
3. Development of Aquaculture
A major way of utilizing the tidal land in Taiwan’s west coast is to develop aquaculture. The history of aquaculture in Taiwan can be traced back to the seventeenth century when aquaculture of milkfish (Chanos chanos) was practiced during the Dutch Period (1624-1661)
18
Chang Chang-yi, “Analyses and Suggestions on Problems of Land Utilization along the Coast of Taiwan,”
Taiwan Historica (Taiwan wen-hsien), 40.1 (1989.03), p. 52.
19
Yin Chang-fu, pp. 95-98.
20
Chiau Wen-yen, 1993.
21
Shao Kwang-tsao, “Loss of Coastal Land and Biological Habitats,” in ChinaTimes Foundation, Symposium of Protecting Taiwan’s Island, Coast, and Wetland (Taipei: China Times Foundation, 2000), pp. 66-84.
22
Yu Ming-shan, “New Challenges and Thoughts regarding Tidal Land Reclamation,’’ http://www. geotech.org.tw/, search on 2010/12/13.
and fish pond tax (wen-shui 塭稅) was collected in the Cheng Period (1661-1683).23 In 1889, a memoir of Liu Ming-chuan 劉銘傳, the first Governor of Taiwan (1885-1891), revealed that fish pond tax was collected throughout the Ch’ing Period in Taiwan (1683-1895).24 According to the statistics by the Japanese Colonial Government in 1898, there were 5,745 chia (approximately 5,573 ha) of aquaculture ponds in Taiwan, of which 95.9% were in the south, 4% in the middle, less than 0.01% in the north, and none in the east. The Japanese Colonial Government attached importance to Taiwan’s aquaculture by conducting experiments and promoting new technologies. For instance, in 1910 fresh water aquaculture was experimented at Hsiaoli 霄裡 in today’s Taoyuan County; and in 1911 brackish water aquaculture was established at Tainan. The Japanese Colonial Government also provided funds to develop seashore aquaculture in 1942.25
Figure 2 illustrates the aquaculture area in Taiwan during 1912-1943. The total area of aquaculture fluctuated between 21,431 ha and 28,202 ha during 1912-1939 and then decreased to 17,662 ha in 1942, but surged to 29, 985 ha in 1943. The available data of brackish and fresh water aquaculture during 1931-1943 showed that the area of fresh water ponds was somehow larger than that of blackish water ponds by 1936 when the former had 13,899.6 ha and the latter 11,011.1 ha. But from then on until 1943, the blackish water ponds gained more space and reached 16,527.5 ha compared to 13,457.9 ha of fresh water ponds.
The Area of Aquaculture in Taiwan, 1912-1943
0 5,000 10,000 15,000 20,000 25,000 30,000 1912 1914 1916 1918 1920 1922 1924 1926 1928 1930 1932 1934 1936 1938 1940 1942 Year Hectare
Total Brackish Water Fresh Water
Figures 2: The Area of Aquaculture Area in Taiwan, 1912-1943
Source: The Statistical Summary of Taiwan, 1894-1945 (Taipei, 1947), Table 235.
23
Chou Chung-hsuan, The Gazetteer of Chu-lo County (Chu-lo hsien-chih) in Collections of Taiwan Documents No. 141 (Taipei: Bank of Taiwan, 1958), pp. 96-97; Hu Hsing-hua, 2004, The Aquaculture in Taiwan (Taipei: Walker Cultural), p. 16.
24
Liu Ming-chuan, Memoirs of Liu Ming-chuan (Liu Chuang-shu kung tsou-yi), in Collections of Taiwan
Documents No. 27 (Taipei: Bank of Taiwan, 1958), pp. 321-322.
25
A turning point of aquaculture in Taiwan took place in the 1960s when new technologies of fry breeding and fish production were developed and laid down the basis for growth. Attracted by high profit, in addition to lowland, salty land and newly reclaimed land along the coast, many lands not suitable for farming were also turned into ponds for aquaculture in the 1970s and the area increased rapidly.26
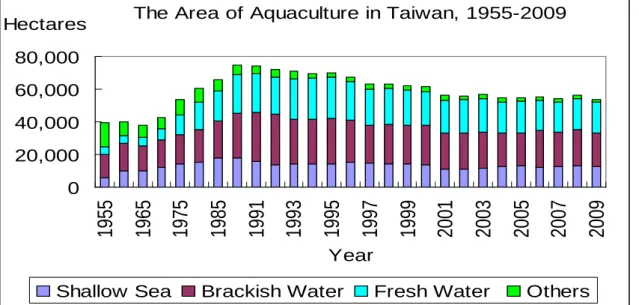
Figure 3 illustrates the development of aquaculture in Taiwan in 1955-2009. The total area of aquaculture increased from 39,547.46 ha in 1955 to 76,421.9 ha in 1990 and then decreased gradually to 53,757.2 ha in 2009. During 1955-2009, on the average, the shares of shallow sea aquaculture, blackish water ponds, fresh water ponds and others were 22.6%, 38.4%, 30.5% and 8.6% respectively. The brackish water ponds had the largest share; it increased from 14,177.5 ha in 1955 to 30,625.8 ha in 1992 and then decreased to 20,612.4 ha in 2009. The fresh water ponds ranked next; it increased from 4,938.5 ha in 1955 to 25.381.4 ha in 1995 and then decreased to 19,008.4 ha in 2009. The shallow sea aquaculture increased from 5,703.9 ha in 1955 to more than 17,900 ha in 1985-1990 and than decreased to 11,219.3 ha in 2002 before increased slightly to 12,744.7 ha in 2009. The other patterns included using paddy fields, reservoirs, irrigation ponds and lakes for aquaculture; this item consisted of 14,727.5 ha in 1955 but it gradually declined to 1,391.7 ha in 2009.
The Area of Aquaculture in Taiwan, 1955-2009
0 20,000 40,000 60,000 80,000
1955
1965
1975
1985
1991
1993
1995
1997
1999
2001
2003
2005
2007
2009
Year HectaresShallow Sea Brackish Water Fresh Water Others
Figure 3: The Area of Aquaculture in Taiwan, 1955-2009
Source: Taiwan Fisheries Yearbook and Statistical Yearbook of related counties.
As for the shares of aquaculture area along Taiwan’s west coast in 1955-2009, here the statistics are grouped into 10 sections mostly by county with Hsinchu, Tainan, and Kaohsiung identifying county and city together and illustrated in Figures 4-7.
26
Council of Agriculture, Executive Yuan (ed.), Monograph of Taiwan’s Fishery in 40 Years (Taipei: Council of Agriculture, Executive Yuan, 1993), pp. 112-130. Hu Hsing-hua, pp.20-21.
In the case of shallow sea aquaculture, on the average, 10 sections have 96.7% of the total area. Major sections are Changhua (20.1%), Yunlin (19.8%), Chiayi (28.0%) and Tainan (21.3%). Sections to the north, Taoyuan, Hsinchu, Miaoli and Taichung, have shares of 0%, 2.7%, 0.02% and 2.2%; and to the south, Kaohsiung and Pingtung, 1.6% and 1.1% respectively. Figure 4 shows the changing rates of shallow sea aquaculture at major sections of west coast.
The Share of Shallow Sea Aquaculture at Major Sections of Taiwan's West Coast
0 20 40 60 80 100
1955
1965
1975
1985
1991
1993
1995
1997
1999
2001
2003
2005
2007
2009
Year Percent Tainan Chiayi Yunlin ChanghuaFigure 4: The Share of Shallow Sea Aquaculture at Four Major Sections
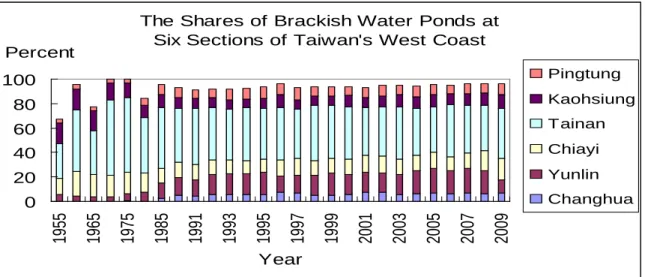
In the case of brackish water ponds, on the average, 10 sections had 93% of the total area. Major sections are Changhua (4.7%), Yunlin (13.9%), Chiayi (13.7%), Tainan (43.2%), Kaohsiung (10.1%), and Pingtung (7.1%); while shares of Taoyuan (0.03%), Hsinchu (0.25%), Miaoli (0.08%), and Taichung (0.04%) are very small. Figure 5 illustrates the changing rates of brackish water ponds at major sections.
The Shares of Brackish Water Ponds at Six Sections of Taiwan's West Coast
0 20 40 60 80 100 195 5 196 5 197 5 198 5 199 1 199 3 199 5 199 7 199 9 200 1 200 3 200 5 200 7 200 9 Year Percent Pingtung Kaohsiung Tainan Chiayi Yunlin Changhua
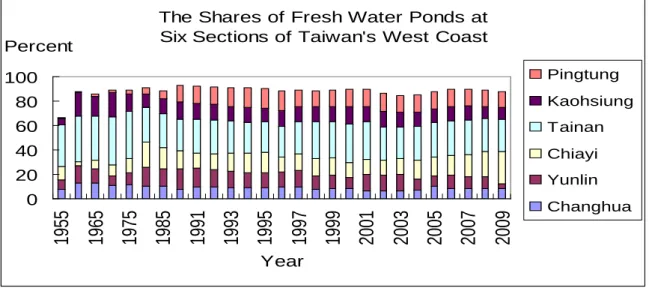
In the case of fresh water ponds, on the average, 10 sections had 93.4% of the total area. Major sections were Changhua (9.0%), Yunlin (11.6%), Chiayi (14.3%), Tainan (29.4%), Kaohsiung (12.4%), and Pingtung (11.4%), while Taoyuan, Hsinchi, Miaoli, and Taichung had 2.1%, 1.8%, 0.5% and 0.9% respectively. Figure 6 shows the changing rates of fresh water ponds at major sections.
The Shares of Fresh Water Ponds at Six Sections of Taiwan's West Coast
0 20 40 60 80 100
1955
1965
1975
1985
1991
1993
1995
1997
1999
2001
2003
2005
2007
2009
Year Percent Pingtung Kaohsiung Tainan Chiayi Yunlin ChanghuaFigure 6: The Shares of Fresh Water Ponds at Six Major Sections
The case of other patterns is illustrated in Figure 7.
The Area of Other Aquaculture Patterns in Taiwan and in Taoyuan County
0 5,000 10,000 15,000
1955
1965
1975
1985
1991
1993
1995
1997
1999
2001
2003
2005
2007
2009
Year Hectares Total TaoyuanFigure 7: The Area of Other Aquaculture Patterns in Taiwan and Taoyuan
In 1955 the area of other aquaculture was mostly located in Taoyuan as it had 4,789 ha (32.5% of the total); but along with the trend of decreasing, the share of Taoyuan increased to more than 90% in 2002-2008 before decreased to 40.4% in 2009. This particularity of Taoyuan can be explained by a large number of irrigation ponds developed since the 1850s at
the tableland east of the coast.27
The aquaculture in Taiwan’s west coast consumed a great amount of water mostly supplied by the groundwater. According to a report of the Water Resource Committee of Ministry of Economic Affairs, in 1983-1985, the aquaculture ponds in Taiwan used 24 billion m3 of water with a distribution asfollows: in the north, 1 billion m3 (fresh and brackish water ponds used 0.8 and 0.2 billion m3 respectively); in the middle, 5.3 billion m3 (4 and 1.3 billion m3 respectively); and in the south, 16.6 billion m3 (9.3 and 7.3 billion m3 respectively).28
Table 4 shows the estimations of groundwater withdrawal, natural recharge, and usages in Taiwan according to a report in 1992.
Table 4: The Usage of Groundwater in Taiwan, ca. 1992
Recharge Million m3 (1) Withdrawal Million m3 (2) Rate % (2)/(1) Shares of Usages % Farming & Husbandry Aqua- culture Industry Water Supply Domestic Use Total 4,000 7,308 183 45 33 13 7 2 West Coast Taoyuan 117 136 116 2 18 68 2 10 Hsinchu 85 132 155 11 28 30 15 16 Miaoli 95 121 127 38 10 30 8 14 Taichung 379 369 97 30 3 31 22 14 Changhua 686 1,285 187 52 39 8 1 0 Yunlin 454 986 217 76 20 1 3 0 Chiayi 246 562 228 58 33 5 4 0 Tainan 120 351 293 49 3 41 2 0 Kaohsiung 187 703 376 43 16 25 17 0 Pingtung 1,111 2,181 196 39 53 2 6 0 Sub-total 3,480 6,826 196 Other Area Taipei 150 86 57 0 3 74 6 16 Yilan 120 183 153 6 52 24 9 9 Hualien 157 115 73 20 15 46 16 3 Taitung 93 98 105 18 51 20 7 4
Source: Chang Shih-chiao, “The Falling Horizon: Problems of Groundwater Resource in Taiwan,” in Ou-yang Chiao-hui et al., The Water Century: Symposium of Sustainable Development of Water Resource (Taipei: China Times,1995), p. 353, citied Hsu Hung-si, “Taiwan’s Water Resource and Groundwater” in Symposium of
Sino-Netherlands Conference on Technology of Monitoring Groundwater (Taipei: Industrial Technology
Research Institute, 1992).
It reveals that by 1992, the annual amount of groundwater withdrawal in Taiwan was 7,308 million m3, accounted for 183% of yearly natural recharge. The shares of different usages of groundwater were as follows: farming and husbandry 45%, aquaculture 33%, industry 13%, public water supply 7%, and private domestic use 2%. Taking the 10 sections in west coast
27
Hsu Min-yang, “Irrigation Ponds in Taoyuan County,” see Taoyuan County Government,
http://www.tycg.gov.tw/site/index.aspx?site_id=012&site_cotent_sn=3339. Search on 2010/12/30.
28
together, it turned out that annual withdrawal was 6,826 million m3 (93% of the total) as compared to 3,480 million m3 (87% of the total) of natural recharge. In other words, the situation of groundwater over withdrawal was more serious in the west coast, particularly at sections from Changhua to Pingtung where the rates of over withdrawal (187-396%) were higher than the average. Moreover, although groundwater was used not just for aquaculture, the shares of this usage in Changhua (39%) and Pingtung (53%) were higher than the average; and in Chiayi (33%), the same as the average.
4. Development of Industrial Parks
Since the 1960s, the Taiwan government devoted a great effort to develop industrial parks which were classified into seven categories by the Industrial Development Bureau of Ministry of Economic Affairs as follows:29
(1) Industrial Parks designated by the Ministry of Economic Affairs
Industrial Parks (IPs) designated by the Ministry of Economic Affairs were managed by Industrial Development Bureau. There are 59 IPs developed in Taiwan since 1964; of them 44 are located in counties and cities along the west coast and 15 of them are located at coastal townships and districts (see Table 5 and Map 3).
Table 5: Industrial Parks at Coastal Townships and Districts in Western Taiwan
Section of Coast Name of Industrial Park Year of Development Area (ha) Operating Factory % of Total Taoyuan Dayuan IP 1976-1984 204.38 156 83.42 Kuanyin IP 1982-1990 632.12 343 95.28 Miaoli Jhunan IP 1982-1984 76.30 50 98.04
Taichung Tajia Youth IP 1975-1978 218.47 222 90.95
Taichung Harbor Related IP 1975-1979 143.12 107 99.07
Changhua Fusing IP 1973 43.14 56 100.00 Fangyuan IP 1978-1982 160.00 117 88.64 Chuansing IP 1987-1991 246.80 141 92.16 Changhua Coastal IP 1979, 1990-2010 3,643.00 186 57.94 Tainan An-ping IP 1971-1975 200.00 537 95.20 Tainan Technology IP 1996- 496.00 74 64.35 Kaohsiung Yongan IP 1973-1975 64.37 66 94.29 Linyuan IP 1973-1975 403.25 26 92.86 Kaohsiung Linhai IP 1974-1977 1,582.00 465 94.51 Pingtung Pingnan IP 1979-1987 278.00 82 89.13
Subtotal 15 IPs at coastal townships 8,390.95 2,628 89.06 Total 44 IPs in western Taiwan 1964-1993 12,561.82 7,344 88.49 Other areas* 15 IPs 1971-1996 2,051.21 3,276 89.65 Grand Total 59 IPs in Taiwan** 14,613.03 10,620 89.07 * In Taipei, Yilan, Nantou, Hualien, and Taitung.
** Not including Liudu IP (in Keelung City) developed in 1973 and dissolved in 1993.
Source: Taiwan Industrial Land Supply and Service Information, see http://idbpark.moeaidb.gov.tw/, with links to individual industrial park. Searched on 2010/11/12.
29
Taiwan Industrial Land Supply and Service Information, http://idbpark.moeaidb.gov.tw/, with links to industrial parks. Search on 2010/11/12.
The 44 IPs located at the west coast have a total area of 12,561.82 ha, or 85.96% of the grand total in Taiwan; and the 15 IPs at townships and districts along west coast have 8,390.95 ha, or 66.80% of the subtotal and 57.42% of the grand total. It should also be noted that although not located right at a coastal district, Taichung IP (580 ha) developed in 1973-1987, has a short distance of 15 km to Taichung Harbor; three IPs in Chiayi County, Jiatai 嘉太 (60 ha) developed in 1974-1795, Puzih 朴子 (21.52 ha) developed in 1979-1981, and Yi-jhu 義竹 (15.66 ha) developed in 1998, are also quite close to harbors along the coast in a distance of 10-25 km. These four IPs will add 5.4% of the area shared by the western coastal townships.
Of these 15 IPs located at western coastal townships, Changhua Coastal Industrial Park at Lukang is particularly notable. In 1979 this project proposed to reclaim a total area of 3,643 ha from tidal lands, but was suspended due to the global energy crisis in the 1980’s and resumed only in 1990. It was expected to complete development of 2,577 ha by the end of 2010, but the entire project has been extended to 2030. Up to 2010 there are 186 factories in operation and they counted for 58% of the total in plan, far below the average rate (89%) of the grand total. In January 2011, members reviewing the report of environmental impacts of this industrial park pointed out problems related to air pollution and marine water pollution.30 (2) Export Processing Zones
Export Processing Zones (EPZs) are managed by the Ministry of Economic Affairs. There are four EPZs developed since 1965 in Taiwan. The Kaohsiung EPZ includes three zones located in Kaohsiung City at Chiencheng (1965-1966), Nantzu (1968-1971), and Linkuang (1991), with a total area of 154 ha. The Taichung EPZ at Tantzu Rural Township was developed in 1969-1971 and expanded in 1983 with a total area of 26 ha. The Chungkang EPZ at Taichung Harbor was developed in 2005 with an area of 177 ha. And the Pingtung EPZ was developed in 2005 with an area of 124 ha which was originally owned by Taiwan Sugar Company. Two of the four EPZs, Kaohsiung and Chungkang, are located right along the west coast and share 68.8% of the total.
(3) Science Parks
Science Parks (SPs) are managed by the National Science Council. There are three SPs in Taiwan, but each has branches at different locations. Hsinchu SP was first developed in Hsinchu (650 ha) in 1980; and from 1999 to 2009, other five branches were developed at Jhunan 竹南 (Chunan, 159 ha), Longtan 龍潭 (106.9 ha) Tongluo 銅鑼 (349.7 ha), Yilan (70.8 ha), and Hsinchu Biomedical SP (at Chupei 竹北, 38.1 ha). Of them, Chunan and Chupei branches are located at western coastal townships. The Central Taiwan SP consists of five branches developed at Taichung (412.86 ha) in 2003, Huwei 虎尾 (in Yunlin County, 96.52 ha) in 2004, Houli 后里 (in Taichung County, 246.27 ha) in 2006, Erhlin二林 (in Changhua County, 636 ha) in 2008, and Advanced Research Park at Nantou 南投 (262 ha) in
30
See http://www.moeaidb.gov.tw/iphw/changpin/; http://www.cna.com.tw/SearchNews/doDetail.aspx? =201101120135&q=...; e-info.org.tw/taxonomy/term/2764, search on 2010/11/12 and 2011/01/20.
2009 respectively. The Southern Taiwan SP has four branches, Tainan (1,043 ha) developed in 1995, Kaohsiung (570 ha) in 2001, Kaohsiung Medical Device Special Zone (30 ha) in 2001, and Chiayi Machouhou 馬稠後 (86.34 ha) in 2010 respectively. Both Central and Southern Taiwan SPs are not located at coastal townships, but the requisition of land for industrial usage had incurred protests and law suits.31
(4) Environmental Science and Technology Parks
Environmental Science and Technology Parks (ESTPs) are managed by the Environmental Protection Administration and local governments. There are four ESTPs developed during 2003-2005; they are Kaohsiung (40 ha), Hualien (22 ha), Tainan (30 ha), and Taoyuan (31 ha). Only the last one is located at Kuanyin 觀音 Township along the west coast.
(5) High-Tech Industrial Parks
The High-Tech Industrial Parks (HTIPs) are managed by local governments. There are six HTIPs developed since 1995. The first one was developed at Kuanyin Township in Taoyuan with 274.99 ha. The second one, Kangshan Benjhou 岡山本洲 (208 ha) in Kaohsiung, was developed in 1997 followed by Kaohsiung Software Technology Park (30 h) at the same site in 2000. The other three HTIPs, Taichung Sheng-kang Fong-chou 神岡豐洲 (47.64 ha), Chiayi Dapumei 嘉義大埔美 Intelligent (298 ha), and Tainan Liu-ying 柳營 Technology (246 ha), are developed in 2006-2010. Only the first one of these newly developed HTIPs is located at coastal township in the west coast.
(6) Biotechnology Parks
Biotechnology Parks (BPs) are managed by the Council of Agriculture and local governments. This category includes three BPs in addition to the above mentioned Hsinchu Biomedical Science Park and Kaoshiung Biomedical Device Special Zone. These three BPs, Taiwan Orchid Plantation (175 ha) in Tainan, Pingtung Agricultural BP (233 ha), and Chiayi Dapumei Herb BP (86.14 ha), were developed during 2003-2006; and the sites are not right along the coast.
(7) Others
The category of others includes special industrial parks and those developed by local governments and private enterprises; they can be divided into three groups. The first group includes Long-chi 龍崎 (341.3 ha) in Tainan, a defense chemical industrial park, was developed in 1976 and managed by the Ministry of Defense, and Datan 大潭 (226.7 ha), a power plant at coastal Kuanyin Township in Taoyuan, was developed in 1992 and managed by Taiwan Power Company. The second group consists of three industrial parks developed by Miaoli County Government: Kwang-yuan 廣源 (57 ha), located at coastal township Chunan,
31
For cases of Houli and Erhlin, see China Times, 2010/7/28; 2010/8/1; 2010/8/3; 2010/08/09; 2010/10/16; 2010/11/12; for the case of Nantou, see antictsp.wordpress.com/tag/, searched on 2011/01/06; and the preliminary review for this case was not approved by the Environmental Impact assessment committee on January 10, 2011, see China Times, 2011/01/11.
was developed in 1990; Longgang 龍港 (15 ha), located at coastal township Houlong, was approved in 1999; and Chung-ping 中平 (32 ha), located at Tongluo Township, was proposed in 2009. Of them, only Kwang-yuan was in operation, while Chung-ping had incurred protests from the residents in December 2010.32 The third group consists of eight industrial parks developed by private enterprises: two located in Tainan, Pao-an 保安 (159 ha) and Hsin-shih 新市 (46 ha), were developed in 1970 and 1976 respectively; three located in Miaoli, San-yi 三義 (75 ha), Chung-hsing South 中興南 (46 ha), and Chung-hsing North 中興北 (12 ha), were developed in 1978, 1988, and 1989 respectively; Tai Yuan High-Tech (39.6 ha) at Chupei, a coastal city, was developed in 2000; and Aspire Park (172 ha) at Longtan, was developed in 2004.
Finally, there is a controversial case of Yunlin Offshore Industrial Park. This project was designated by the Ministry of Economic Affairs in 1991 with a total area of 17,203 ha along the coast in Yunlin County with a length of 32 km and width 3-4 km. It was planned to create 11,562 ha from tidal lands at four sections: Mailiao 麥寮 (2,233 ha), Hsinhsing 新興 (991 ha), Taisi 臺西 (1,061 ha), and Sihu 四湖 (6,232 ha), as well as two industrial harbors at Mailiao and Sihu. In 1993, the Mailiao section was sold to Formosa Petrochemical Corporation (FPCC) for it to reclaim the tidal land and to develop petrochemical industry. It was reported by FPCC that 109.15 million m3 of pebbles and soils were filled in to create 2,255 ha of land, accounted for 0.062% of the total land area in Taiwan. At this industrial park, the No. 6 Naphtha Cracker Complex was in operation since 1993 with 66 factories of 13 companies.33
It was pointed out by a scholar of environmental engineering that the land developed by FPCC used mostly sands withdrawn from the sea; this way of doing was quite different from that of Kansai International Airport in Japan which did not withdraw sea sands in order to avoid changes in marine ecology. However, FPCC obtained approval from the Water Resource Bureau in the name of dredging the estuary of the Chuoshui River.34
In July 2010, two fires occurred within half a month at No. 6 Naphtha Cracker Complex had stirred up protests of Mailiao residents and criticisms from scholars and environmental protection organizations; the result was that FPCC agreed to sign an agreement with Yunlin County Government for compensation, providing free health examinations for residents, and subsidizing forestation.35
The Mialiao Industrial Harbor was also constructed by private investments with a total area of 1,594 ha. It was planned to construct 30 wharfs in 476 ha of the harbor. In 2007 there
32
See a report of the protest on December 11, 2010 at http://www.dfun.com.tw/wp-trackback.php?= 32558, searched on 2011/01/05.
33
See http://www.fpcc.com.tw/six/six_2.asp, search on 2011/01/07
34 Lin Yi-cheng, “Be Cautious to Conflict with the Sea―Taiwan’s Physical Planning from the view of
developing tidelands,” PROECO (Huan-keng),1997.09, pp. 7-22, see http://www.water.tku.edu.tw/ sub91/volunteer/data/1_0005.asp?q_class=, search on 2010/3/31.
35
Here, just mention a few reports in China Times on 2010/7/27/, 2010/8/18-21, 2010/10/27-30, 2010/11/05, and 2011/01/05.
were 19 wharfs in operation with 3,172 ships in and out the harbor; and in 2009 there were 20 wharfs with 5, 880 ships.36
As for the three other sections, the Ministry of Economic Affairs agreed to transfer the Taisi section to Yunlin County Government in 1995, but the development has not yet started. The Hsinsing section was entrusted in 1998 to RSEA Engineering Corporation for reclaiming 991 ha of the tidal land, of which 283 ha had been completed. As for the Sihu section, it was decided to stop development in 2005.37
The development of industrial parks in Taiwan is now facing a problem of over supply of land. As mentioned above in Table 5, the rate of factories in operation was about 89% on the average. In 2002, the Industrial Development Bureau reported that 3,000 ha of vacant land in industrial parks were waiting for sale and most of them are locating at newly developed IPs, such as Changhua Coastal and Yunlin Offshore in the west coast, and Litze in Yilan in the east coast.38
However, a new project for developing the tidal land along the coast at Tacheng 大城 Township in Changhua County for the establishment of No. 8 Naphtha Cracker Complex by Kuokuang Petrochemical Technology Company was still in the process of environmental impact assessment. This project was first approved on 3 October 2006 by Executive Yuan’s Council for Economic Planning and Development for its investment at the Taisi section of Yunlin Offshore Industrial Park. In February 2008, after the second-stage environmental impact assessment the Kuokuang Company decided to change the site to Tacheng and the new project was reviewed by the environmental impact assessment committee on June 9, 2009 with a decision that it should enter the second-stage assessment because of its possibility of bringing about great impacts. But the first meeting of the second-stage assessment in April 2010 still did not approve the case.39
Because this project will affect the migratory corridor of Chinese white dolphin (Sousa chinensis) and destroy part of the wetland along the coast, therefore, a movement of obtaining warrants for protecting white dolphin was initiated by seven environmental protections organizations on April 11, 2010. Since then there were protests and debates with a result that the investors agreed to reduce the scale in December 2010 in order to win over the environmental impact assessment in the near future.40 As the revised project was submitted
36
See http://www.moeaidb.gov.tw/iphw/yloip/index.do?id=05; http://www.fpcc.com.tw/six/six_4.asp; and blog.udn.com/iverson810/3659868, searched on 2010/11/12 and 2011/01/10.
37
See http://www.moeaidb.gov.tw/iphw/yloip/index.do?id=05, searched on 2010/11/12.
38
Chen Chin-long, “To pay attention to problem of vacant land,” in National Policy Foundation Commentary, No. 091-057 (2002/11/27), see http://old.npf.org.tw/PUBLICATION/TE/091/TE-C- 091-057.htm, searched on 2010/11/12.
39
Report on China Times, 2006/10/3 cited by Taiwan Environmental Information Center at
e-info.org.tw/node/14884; Chu Shu-chuan’s report on 2009/6/25 at e-info.org.tw/node/44438; and on 2010/04/14 at e-info.org.tw/node/53836; searched on 2010/12/10.
40
See http://www.libertytimes.com.tw/2010/new/apr/11/today-life6.htm; for other related news to this project, here just mention some reports of China Times on 2010/08/08, 2010/09/10-11, 2010/09/25, 2010/10/29, 2010/11/02, 2010/11/14, 2010/12/15, 2010/12/31.
for review in early 2011, writers in Changhua County led by poet Wu Cheng 吳晟 went to the County Government on 20 January 2011 to express their opposition. At a press conference held in Taipei on the same day, scholars led by Academician Chen Chien-jen 陳建仁 pointed out that Kuokuang petrochemical was designed to be a project of high energy, high water consumption, and high emission of carbon dioxide, a simple reduction of scale was not a good solution; they urged the review committee of environmental impacts to face humbly the appealing of environmental organizations and to think over carefully the sustainability of Taiwan.41
5. Mitigation Effort and Limitation
As mentioned above, groundwater provides a large amount of water used in aquaculture and industry and the result of over withdrawal had caused serious problems of subsided stratum along the coast of Taiwan, particularly in the southwestern area. An estimation in 1992 revealed that the total subsided area was 1,170 km2,accounted for 11% of the total area of plain in Taiwan.42
In order to reduce the groundwater withdrawal and to prevent further land subsidence, the Executive Yuan approved a program in 1995. The preventing program brought some immediate effects on aquaculture, as it was reported that by assisting the aquaculture to transform from using fresh water to seawater, the amount of groundwater withdrawal was reduced from 24 billion m3 in 1992 to 11.7 billion m3 in 1997. Moreover, the technology of using recycling water was promoted and extended to 807 aquaculture households with an effect of saving 60% of water and reducing annual withdrawal of groundwater in 0.87 billion m3.43
Table 6 shows the statistics of land subsidence in 1993-2008 at eight locations, of which six are in the west coast. The total area of land subsidence was 1,616 km2 in 1993-1995; it decreased to 920 km2 in 2000. In 2001-2002, another 620 km2 were added into the program for investigating the situation in inland area, and thus the total area increased to 1,540 km2. From 2003 to 2008, the area gradually decline to 821 km2 as a result of carrying out the program of control.
Apparently, except for in 1993-1995 when there were also subsided area in Taipei (in the north) and Yilan (in the northeast), almost all areas were along the west coast from Changhua to Pingtug; and the subsided areas in 2006-2008 were largely in Changhua and Yunlin. Some reports revealed the seriousness of local situations. In 1999, it is noted that the cumulative depth of land subsidence at the coast of Pingtung had reached 2.9 meters and the
41
See China Times, 2011/01/21/A22. 42
Chang Shih-chiao, “Sinking Horizon ― Problem of Taiwan’s Groundwater Resource,” in Ou-Yang Chiao-hui et al., The Water Century ― Symposium of Conference on Sustainable Development of Water Resource (Taipei: China Times, 1995), pp. 347-348.
43
encroachment of seawater had caused water salinity of wells located 5 km east of the coast.44 Another report in 2009 stated that in Yunlin the rate of land subsidence was 6.4-7.1 cm per year, and the center of subsidence had moved eastward into inland; and in Pingtung, an area of 115 km2 was affected as the seawater had encroached 9 km eastward.45
Table 6: The Area of Land Subsidence in Taiwan, 1993-2008 (Unit: km2)
Place\ Year 1993-95 2000 2001-02 2003 2004 2005 2006 2007 2008 Taipei 252 0 0 0 0 0 0 0 0 Yilan 50 0 0 0 0 0.2 0.2 0 0 Changhua 196 322 408 357 368 263.0 278.3 225.6 581.0 Yunlin 745 366 611 703 516 678.6 557.1 551.5 214.0 Chiayi 197 173 212 269 269 170.0 28.6 26.1 26.1 Tainan 30 30 294 34 34 27.5 27.5 0 0 Kaohsiung 10 10 10 0 0 0 0 0 0 Pingtung 136 19 5 7 7 7.4 0 0 0 Total 1,616 920 1,540 1,370 1,194 1,147.1 891.7 803.2 821.1 West Coast % 81.31 100 100 100 100 99.95 99.98 100 100
Source: Water Resource Agency, Ministry of Economic Affairs, Land Subsidence Prevention and Reclamation Data Network, http://www.water.tku.edu.tw/sub/91/sub/gov.aspx, searched on 2010/11/04.
According to a report of the Water Resource Agency of Ministry of Economic Affairs, the preventing program was carried out in two stages: the first stage from 1995 to 2000 was conducted at Yilan in northeast coast and at Changhua, Chiayi, Tainan, Kaohsiung, and Pingtung in west coast; the second stage from 2001 to 2008 selected Changhua and Yunlin as areas of demonstration and added Taoyuan in the program. The results of the first stage prevention included: (1) The amount of groundwater withdrawal was reduced from 71.4 billion m3 to 57.3 billion m3; (2) The area of land subsidence was reduced from 1,616 km2 to 920 km2; (3) There were 3,283 illegal wells being blocked up; (4) The area of aquaculture was reduced from 52,000 ha to 41,000 ha; (5) The amount of groundwater used by aquaculture was reduced from 24 billion m3 to 11.8 billion m3; and (6) The technique of using recycling water was extended to 413 aquaculture households. Moreover, in December 1998 the Water Resource Agency collaborated with Tainan Hydraulics Laboratory of Cheng Kung University to establish a Service Team to assisted local governments to carry out the related tasks of preventing land subsidence.
The results of second stage included: (1) At a half of the land subsidence area the level of groundwater did not fall anymore and the subsided area was reduced 15%; (2) Annual amount of groundwater withdrawal at the subsided area decreased from 38.1 billion m3 to
44
Li Yuan-hui, “The Current Situation of Taiwan’s Marine Area and Sustainable Management,” in Sun Pao-nien (ed.), The Disappearing Coast (Hsiao-shih te hai-an 消失的海岸), (Taipei: Lienching Publishing Company, 1999), p. 26.
45
Li Cheng-kao and Chen Chung-wei, “Limited Supply of Underground Treasure – Groundwater and Subsided Stratum” Science Monthly, No. 479 (2009/11), see http://scimonth.blogspot. com/2009/12/ blog-post_2436. html, searched on 2010/11/03.
34.7 billion m3; (3) The amount of groundwater withdrawn by aquaculture was reduced from 11.8 billion m3 to 10.4 billion m3; (5) Five collective systems of water supply for aquaculture were completed; (6) 2,730 illegal wells were blocked up. In addition, from 2002 on, training courses were provided and groups of volunteers were formed to help in preventing land subsidence. And in 2009, Yunlin and Chiayi were selected for demonstrating the improvement of drainage system.46
In addition to land subsidence, some coastal areas were polluted by the industrial waste brought along by rivers to the estuaries. Investigations by scholars revealed that the collective deaths of oysters and clams occurred as early as 1969 and from then on almost every year along the coast of Changhua, Yunlin and Chiayi. In early 1986 events of collective deaths of oysters, clams, and shrimps occurred one after the other at the coast of Kaohsiung, Tainan, and Yunlin because of the water pollution. Until 1994, similar events occurred at the estuary of Chungkang River in Miaoli. It was only after 1987 that the Water Pollution Control Act was more strictly implemented and this kind of events disappeared gradually.47
The pollution of solid waste was also a problem. For instance, in April 2010 it was reported that the wetland at Chiku 七股, Tainan was polluted by slag with an area of 10 km long and 50 m wide. The environmental protection organization in Tainan urged the authority to investigate. It was found that the slag contained dioxin and heavy metals that were harmful to aquaculture ponds nearby.48 Another report on 10 June 2010 said that the coast between Hsinfeng and Chubei in Hsinchu County was covered by solid waste for more than 20 years and the coastline had moved outwards 10-20 meters with a comparison of the 1994 aerial map. The County Environmental Bureau said that they received sometimes reports or petitions, but were still not able to catch the perpetrator successfully.49 The preliminary test results revealed that the waste contained heavy metal such as lead and cadmium.50
According to the Ministry of the Interior, artificial coast had reached 43.83% of Taiwan’s coastline in recent years. At a meeting on 22 April 1981, the Executive Yuan decided to protect natural landscape and ecological resource along Taiwan’s coast and asked the Ministry of the Interior to do surveys as soon as possible. On 23 February 1984 Executive Yuan approved a program with seven coastal sections selected for protection, including the estuary of Tamshui River in the north; the coast along Lanyang plain, the coast from Suao to Hualien,
46
Chin Chi-wen, “The Effects of Carrying out Land Subsidence Preventing Program,” see http://www. wcis.itri. org.tw/Upload/QUARTC/000286/15-6.pdf, search on 2010/11/03. Land Subsidence Prevention and
Reclamation Data Network of Water Resource Agency, Ministry of Economic Affairs, http://www.water.tku. edu.tw/sub/91/sub/gov.aspx; and important policies announced at the website of Water Resource Agency, Ministry of Economic Affairs, http://www.wra.gov.tw, searched on 2010/11/04.
47
Ts’ui-jung Liu, “Water Pollution Control along Rivers in Taiwan during 1986-2006,” in Fu-shan Huang (ed.),
Ocean, River and the Transformation of Settlements in Taiwan: A Comparative4 Perspective (Taipei: Institute
of Taiwan History, Academia Sinica, 2009), pp. 229-289.
48
Chu Li-chuen reported, China Times, 2010/04/20/A7; Lo Jung and Chou Hsiao-ting reported, China Times, 2010/07/17/A12.
49
See http://www.libertytimes.com.tw/2010/new/jun/10/today-north17.htm, searched on 2010/12/17.
50
and the coast from Hualien to Taitung in the east; the coast of Changhua-Yunlin-Chiayi in the west; the northeast coast, and the southern coast along Kenting墾丁. On 13 January 1987, the Executive Yuan approved another five selected sections including the north coast, Beimeng 北 門 (Tainan), Chienshan 尖 山 at Checheng 車 埕 (Pingtung), Chiupeng 九 棚 at Manchou滿州 (Pingtung) and Haomeiliao 好美寮 at Budai 布袋 (Chiayi).51
These 12 coastal areas selected for protection had a total area of 0.24 million ha. In July 2007, the Executive Yuan approved a comprehensive program for sustainable development of the coast and thus, the Construction and Planning Agency of Ministry of the Interior started to review previous plans and after 16 meetings with scholars, government departments, fishing organizations, and NGOs, a preliminary conclusion was reached that the coastal protection zones would be increased from 12 to 21 with a total area of 1.32 million ha.52
Whether or not this plan can really be carried out depends on perfection of legal and management systems. As pointed out by a scholar of land management in 1989, the plan of coastal land utilization was defined in the Comprehensive Development Plan of Taiwan Area as early as 1979, however, due to a lack of specific methods and the deviation of actual implementation, the Plan was a mere formality. Moreover, the plans of coastal environmental protection drawn in the 1980s also faced the same predicament.53 Even so, the Ministry of the Interior proceeded to prepare a draft of the Coastal Law (Hai-an-fa 海岸法) in 1991 and submitted to the Legislative Yuan for review in 1997, 2000, and 2002, but never went through the procedure of legislation. In May 2008, a new draft was sent to the Legislative Yuan again for review but was still pended. However, the Construction and Planning Agency of the Ministry of Interior had prepared a draft of enforcement rules of the coastal law and held the first public hearing on 23 March 2010. Thereby, the environmental protection organizations urged that the coastal law should be legalized as soon as possible. As the big project such as Kuokuang petrochemical industry is still waiting for approval, the chairman of Changhua County Environmental Protection Union worried that the leeway of administrative discretion might provide a backdoor for the authority and thus to sacrifice coastal protection.54
After all, the choice between economic development and environmental protection is still rather difficult in Taiwan at present, regardless that the principle of priority is clearly stated in the country’s Constitution that when there is a conflict between the two purposes, the environmental protection has the priority.
51
Chang Chang-yi, pp. 1-2; Construction and Planning Agency, Ministry of the Interior, www.cpami.gov.tw/ chinese/index.php?option=com_content&view= article&id=10714&Itemid=57, searched on 2010/10/07.
52
See Task force for Maritime Affairs, Executive Yuan, http://www.cmaa.nat.gov.tw; Urban and Rural Development Branch, Construction and Planning Agency, Ministry of the Interior, http://www.tcd/gov.tw/, search on 2010/08/08.
53
Han Chien, A Survey Study on Taiwan’s Coastal Land Utilization and Regulation (Nantou: Taiwan Provincial Government, 1989), pp. 67-68.
54
See, Construction and Planning Agency, Ministry of the Interior, www.cpami.gov.tw/chinese/ index.php?option=com_content&view=article&id=10173&Itemid=53; www.cpami.gov.tw/
chinese/index.php?option=com_content&view=article&id=745&Itemid=76; Wild at Heart Legal Defense Association, zh.wildatheart.org.tw/archives/990308.doc; searched on 2011/01/18.