230 IEEE TRANSACTIONS ON NEURAL SYSTEMS AND REHABILITATION ENGINEERING, VOL. 22, NO. 2, MARCH 2014
Independent Component Ensemble of EEG
for Brain–Computer Interface
Chun-Hsiang Chuang, Li-Wei Ko, Member, IEEE, Yuan-Pin Lin, Member, IEEE, Tzyy-Ping Jung, and
Chin-Teng Lin, Fellow, IEEE
Abstract—Recently, successful applications of independent
com-ponent analysis (ICA) to electroencephalographic (EEG) signals have yielded tremendous insights into brain processes that underlie human cognition. Many studies have further established the feasi-bility of using independent processes to elucidate human cognitive states. However, various technical problems arise in the building of an online brain–computer interface (BCI). These include the lack of an automatic procedure for selecting independent components of interest (ICi) and the potential risk of not obtaining a desired ICi. Therefore, this study proposes an ICi-ensemble method that uses multiple classifiers with ICA processing to improve upon ex-isting algorithms. The mechanisms that are used in this ensemble system include: 1) automatic ICi selection; 2) extraction of fea-tures of the resultant ICi; 3) the construction of parallel pipelines for effectively training multiple classifiers; and a 4) simple process that combines the multiple decisions. The proposed ICi-ensemble is demonstrated in a typical BCI application, which is the moni-toring of participants’ cognitive states in a realistic sustained-at-tention driving task. The results reveal that the proposed ICi-en-semble outperformed the previous method using a single ICi with (91.6% versus 84.3%) in the cognitive state classification. Additionally, the proposed ICi-ensemble method that character-izes the EEG dynamics of multiple brain areas favors the applica-tion of BCI in natural environments.
Index Terms—Brain–computer interface (BCI), independent
component analysis (ICA), multiple classifier system.
I. INTRODUCTION
O
VER the last few decades, the electric field that is gen-erated by the activity of the brain, monitored by an elec-troencephalogram (EEG), has been proven to be a robustphys-Manuscript received March 01, 2013; revised June 28, 2013; accepted November 10, 2013. Date of publication December 11, 2013; date of current version March 05, 2014. This work was supported in part by the UST-UCSD International Center of Excellence in Advanced Bio-engineering sponsored by the Taiwan National Science Council I-RiCE Program under Grant NSC-101-2911-I-009-101, in part by the Aiming for the Top University Plan of National Chiao Tung University, the Ministry of Education, Taiwan, under Contract 100 W9633, and in part by the National Science Council, Taiwan, under Contract 100-2628-E-009-027-MY3. Research was also sponsored in part by the Army Research Laboratory and was accomplished under Coopera-tive Agreement W911NF-10-2-0022. The views and the conclusions contained in this document are those of the authors and should not be interpreted as repre-senting the official policies, either expressed or implied, of the Army Research Laboratory or the U.S. Government. The U.S. Government is authorized to reproduce and distribute reprints for Government purposes notwithstanding any copyright notation herein. Asterisk indicates corresponding author.
C.-H. Chuang and *C.-T. Lin are with the Department of Electrical and Com-puter Engineering and Brain Research Center, National Chiao Tung University, Hsinchu, Taiwan (e-mail: [email protected]; [email protected]).
*L.-W. Ko is with the Department of Biological Science and Technology, and Brain Research Center, National Chiao Tung University, Hsinchu 30010, Taiwan (e-mail: [email protected]).
Y.-P. Lin and T.-P. Jung are with the Swartz Center for Computational Neuro-science, Institute for Neural Computation, University of California-San Diego, La Jolla, CA, USA (e-mail: [email protected]; [email protected]).
Color versions of one or more of the figures in this paper are available online at http://ieeexplore.ieee.org.
Digital Object Identifier 10.1109/TNSRE.2013.2293139
iological indicator of human behaviors. Recent advances in al-gorithms and the findings of computer science and neuroscience [2] have led to advances in EEG-based brain–computer inter-faces (BCI) [3] to the point that they now have a wide range of applications such as for personal authentication or identifica-tion [4], [5], assessment of emoidentifica-tional disorders [6], games [7], and accident prevention [8]–[10]. However, suboptimal perfor-mance that results from pervasive EEG contaminations (muscle activity, blinks, eyes movement, and environmental noise) in real operational environments still inhibits the transition of labo-ratory-oriented neuroscience research to practical BCI devices. Independent component analysis (ICA) [11], [12] is an ex-tensively used method of separating brain signals from arti-facts. Applying machine-learning approaches to assess the dy-namics of task-related independent components (ICs) has been demonstrated to enhance effectively the performance of BCIs in estimating cognitive states of human subjects. For example, the ICs of the posterior brain region can be used to predict human driving performance [9], [13]; temporo-parietal ICs are useful for determining intended directions of movement [14]; sensorimotor ICs can be used as important features for the task of motion imagery EEG classification [15], and IC that is as-sociated with event-related potentials can be used to construct P300-BCI [16]. However, the proper operation of most of BCIs requires manual intervention on selecting these ICs of interest followed by ICA. First, most existing ICA-based models use a predefined IC. Combining task-related brain processes to char-acterize complex human behaviors intuitively appears to be a more reasonable method than using only a few specific sig-nals. Second, the order of ICs cannot be determined. Therefore, an automatic IC selection method is required after ICA is per-formed. One well-developed method is template matching [17], [18]. Constructing templates of the desired IC has been proven to be effective in selecting relevant ICs and discarding ICs with artifacts [17]. Third, nonstationarity in measured EEG signals can produce different results of ICA analysis [19]. ICs obtained from different subjects might vary widely. That is, some ICs can be found in recordings from one subject but not from an-other. Most ICA-based BCI systems that use only one or two specific ICs fail if none of the resultant ICs matches the targeted ones. To solve these problems, this work proposes the incorpo-ration of a multiple-classifier system [20] into the ICA-based BCI.
The goal of this work is twofold. First, this study proposes a multiple-classifier system, called an independent component ensemble, with an automatic procedure for selecting ICs of in-terest (ICi), a parallel learning pipeline for training classifiers, and a fusion method for combining decisions. Second, this work
1534-4320 © 2013 IEEE. Personal use is permitted, but republication/redistribution requires IEEE permission. See http://www.ieee.org/publications_standards/publications/rights/index.html for more information.
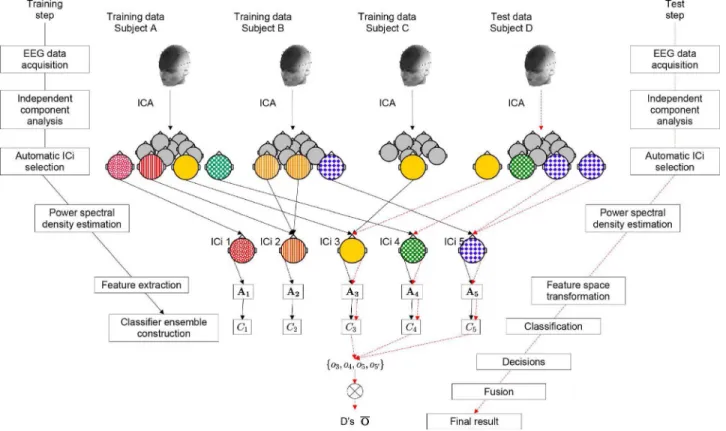
Fig. 1. Schematic diagram of independent component ensemble. Black and red lines indicate training and testing procedures, respectively.
tests the feasibility of the proposed model on drowsy driving de-tection.
II. INDEPENDENTCOMPONENTENSEMBLE
A. System Diagram of Independent Component Ensemble
Fig. 1 shows the schematic diagram of the independent com-ponent ensemble. Following ICA decomposition, an automatic method selects ICs of interest by measuring the similarity of spatial maps between the extracted ICs and the reference ICi. Then, the spectral profiles of the extracted ICs are extracted by fast Fourier transformation and feature extraction. Finally, the proposed ensemble embeds the spectral features of ICi into the multiple-classifier system [20]. In Fig. 1, for example, the EEG data from three subjects (Subjects A, B, and C) were used to train a 5-ICi ensemble to test the remaining subject (Subject D). In this example, four ICs from Subject D were found to resemble three reference ICs (ICi 3, 4, and 5). Three classifiers yielded the output decision . A decision fusion method was then applied to obtain a final result. The parallel processing can be conducted in the proposed ensemble to reduce the computing time. Notably, the ensemble size varies with the number of ex-tracted ICi. The following sections present the details.
B. Independent Component of Interest
The multi-channel EEG recordings are regarded as mixtures of underlying brain sources and artificial sig-nals. To obtain source components, -channel EEG data
were firstly decomposed into
tem-porally independent components by
independent component analysis (EEGLAB toolbox [21]). The relationship between and can be expressed as , where is a mixing matrix. The column of the mixing matrix [Fig. 2(b)], representing the strengths of projections of ICs onto each EEG sensor [Fig. 2(c)], can be rendered as a 2-D spatial map to identify sources of independent brain processes [21].
To design an ICA-based BCI to monitor the cognitive state of a subject, five scalp maps [Fig. 2(d)] were predefined as the
spatial templates of ICi. These
selected maps of the frontal, central, motor, parietal, and oc-cipital components, were strongly related to the changes in the cognitive state [9], [22]–[24]. However, the ICA, applied to an -channel EEG, generated an unordered set of ICs. Addition-ally, slight difference across subjects in the orientation of equiv-alent dipoles for a set of equivequiv-alent ICs can produce different IC scalp maps. To select ICi automatically, the similarity of the scalp maps between the observed ICs
and the predefined ICi was calculated using Pearson’s cor-relation, where . The th observed IC was clas-sified as th ICi if , where 0.8 is the empirical threshold. Notably, the absolute value of the correlation coeffi-cient must be considered in selecting the ICi that may have a reverse polarity [25]. Additionally, and were scaled in the range of before the correlation coefficient was cal-culated. Fig. 2(e) and (f) shows the ICi selection, in which the numbers of frontal, central, motor, parietal, and occipital com-ponents are one, one, two, two, and three, respectively.
232 IEEE TRANSACTIONS ON NEURAL SYSTEMS AND REHABILITATION ENGINEERING, VOL. 22, NO. 2, MARCH 2014
Fig. 2. Creation of templates of scalp maps for ICi. (A) Channel locations of 30 electrodes; (B) inverse of unmixing matrix; (C) ICi weights; (D) left panel: scalp topographies of five ICi; right panel: strengths of projections of frontal, central, motor, parietal, and occipital components onto 30 electrodes. (E) Result of ICi selection for subject 01. Similarity (correlation coefficient, ) between IC and ICi templates. (F) Nine components with high correlation coefficients abs are used as ICi.
C. Estimation of Power Spectral Density and Feature Extraction
The time courses of the activations of all ICi were trans-formed to the frequency domain by fast Fourier transforma-tion (FFT). The resultant features of each spectrum were dis-tributed into frequency bins. To improve the efficiency of the ensemble classification, a feature extraction (FE) procedure was performed before the classifier was constructed. The informa-tive features were extracted from the original space into a reduced space , where . Given a transformation matrix for the th ICi, the FE performed a linear mapping on such that the transformed data preserved the rel-evant information about task-related activity. The optimal could be assessed using many approaches and measurements, such as a heuristic search [26], the statistical variability of the data [27], or class separability [27]. This study evaluated many fea-ture extraction algorithms, including sequential forward selec-tion (SFS) [26], principal component analysis (PCA) [27], linear discriminate analysis (LDA) [27], and nonparametric weighting feature extraction (NWFE) [28] to identify the optimal one.
To reduce the computing time, the feature that guaranteed the optimal subset in SFS or the eigenvector had the largest
eigen-Fig. 3. Driving simulator and experimental paradigm. (A) High-fidelity VR-based driving environment. (B) nighttime driving scenario. (C) 30-channel EEG cap with sintered Ag/AgCl electrode. (D) Event-related lane-departure paradigm [1]. Deviation onset: time when car begins to deviate from center of cruising lane; Response onset: time when subjects first use steering wheel to compensate for driving error; Response offset: time when car returns to center of cruising lane. (E) EEG segments of 1 s and 90 s of ICi data were used to characterize task performance and vigilance state, respectively, in -trial.
value in PCA, LDA, and NWFE was applied to train the classi-fier.
D. Classifier Ensemble and Decision Fusion
The dimension-reduced data with a class-label was used to train the parameters of the classifier. Notably, the ensemble size , which is the number of the classifiers, equals the number of ICi. This study used Gaussian classifier (GC), support vector machine (SVM), and radial basis function neural network (RBFNN) as a component classifier. PRTools [29] was utilized to construct the GC, SVM with a radial basis function, and RBFNN. In the decision fusion step, the ensemble system yielded a final result from a simple majority vote. Notably, the decision-making process randomly selects one of the classes to break a tie if no class received the most votes.
III. EXPERIMENTALDESIGN ANDMATERIALS
This work demonstrated the feasibility of the proposed inde-pendent component ensemble by using it in a BCI for moni-toring the cognitive state of subjects who performed a realistic sustained-attention driving task [9], [13].
A. Virtual Reality-Based Driving Simulator
Neurophysiological activity in response to complex driving behaviors was studied in a virtual reality-based immersive driving environment [24]. At the center of the laboratory, a real car was mounted on a six-degree-of-freedom Steward motion platform that simulated the movements of the vehicle [Fig. 3(a)]. Seven personal computers rendered a synchronized animation of a four-lane highway scenario [Fig. 3(b)] that was projected onto the surrounding screens by seven projectors at various viewing angles.
B. Experimental Paradigm
The event-related lane-departure paradigm [1] [Fig. 3(d)] was implemented on the driving simulator to measure objectively
C. Subjects and Acquisition of EEG Data
Ten subjects with normal or corrected-to-normal vision par-ticipated in a 90 min driving experiment. None of them had a history of psychiatric or sleep disorders. The EEG data were recorded at a sampling rate of 500 Hz with 16-bit quantiza-tion using a Scan NuAmp Express system (Compumedics Ltd., VIC, Australia). Thirty electrodes were arranged on a quick-cap [Fig. 3(c)] consistent with a modified version of the interna-tional 10–20 system (standard electrode positioning nomencla-ture, American Encephalographic Association). The impedance of each electrode was kept under during the experiment. To reduce the data size and remove noise, the EEG data were down-sampled to 250 Hz and filtered using a band-pass FIR filter (1–50 Hz) before further analysis.
D. Categorization of EEG Trials
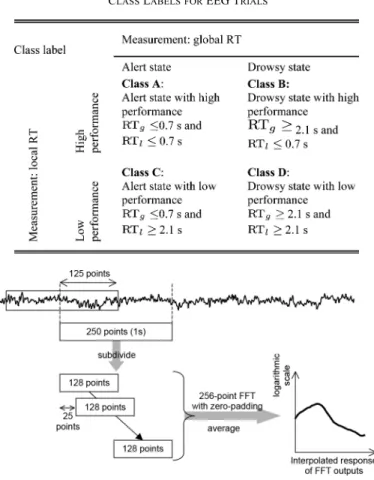
As presented in Table I, in each trial two measures of the subject’s reaction time (RT)—local RT and global RT —were used to quantify momentary task performance (high or low) and a putative cognitive state (alert or drowsy), respectively. was defined as the time between the onset of deviation and the onset of response. The task performance was high when the subject could minimize the deviation distance and keep the car cruising in the original lane . In con-trast, if the subject did not respond promptly and allowed the ve-hicle to hit a curb , the performance was low. was used to evaluate the arousal state as a relatively long-term change, calculated as the mean of all of the trials in a 90-s
window. Long periods of high and low
task performance were interpreted as states of relative alertness and relative drowsiness, respectively. The results of the EEG trials were assigned to one of four classes—“alert state with high performance,” “drowsy state with low performance,” “alert state with low performance,” and “drowsy state with high performance”—based on both and . Class A and Class D represent two typical types of behavior, revealing that an alert state is associated with high task performance and a drowsy state is associated with low task performance. Class B and Class C represent an alert subject with low task performance and a drowsy subject with high task performance, respectively. Pre-sumably, the former class is associated with momentary distrac-tion of subject’s attendistrac-tion from driving task while subject never-theless remains alert. The latter may be associated with sudden rousing of a drowsy subject by sensing of vehicle motion, and his or her quick response to such an event. The total number of
Fig. 4. Block diagram for EEG power spectrum analysis.
trials in Classes A, B, C, and D are 681, 323, 283, and 334, re-spectively.
E. EEG Spectral Features
As shown in Fig. 4, the frequency responses of IC activa-tions were calculated using a 250-point moving window with 125 overlapping points. Each 250 points (1 s) of data were fur-ther subdivided into several 128-point sub-windows advanced in a 25-point step. Windowed 128-point epochs were extended to 256 points by zero-padding to calculate the power spectra using a 256-point FFT (Welch’s method), yielding an estimate of the power spectral density with 30 frequency bins from 0.98 to 30.3 Hz (an interpolated frequency resolution: Hz). The power spectra of these sub-windows were then averaged and converted to a logarithmic scale to form a log power spectrum for each 250-point epoch of the data. Since the periods of the cyclic fluctuations of drowsiness exceeded four minutes [31], the resulting EEG power time series were smoothed using a 90 s square moving-average filter that advanced in a step of 1 s to eliminate variance at cycle lengths of shorter than 1 min.
Following the EEG categorization, the frequency responses of ICi activations within a 1-s window before the onset of the deviation [9] [Fig. 3(e)] were averaged to yield a power spectral density which captured the momentary state of the brain in response to events. Additionally, the frequency responses of ICi activations within a 90-s window (from 45 s before to 45 s after the onset of the deviation) [Fig. 3(e)] were averaged to
234 IEEE TRANSACTIONS ON NEURAL SYSTEMS AND REHABILITATION ENGINEERING, VOL. 22, NO. 2, MARCH 2014
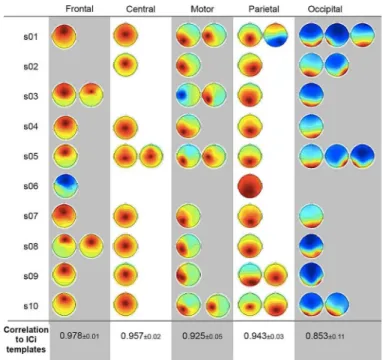
Fig. 5. Results of ICi selection for ten subjects. Notably, the polarity of the spatial map and the activation may oppose those of the ICi template.
yield a power spectral density which described gradually changing brain dynamics. Then, these two power spectra were averaged to generate an input dataset for the
ICi-ensemble, where .
F. Performance Validation
The leave-one-subject-out cross-validation method was used to obtain reliable accuracy (Fig. 1). In each step of the cross-validation, the classifier was trained using EEG data from nine subjects and tested on the remaining subject. This procedure was repeated such that every subject provided the test dataset. All of the parameters of the FE and the classifiers were calculated from the training data and applied to the testing data. Equal amounts of data were sampled from all of the classes for cross-validation to prevent performance bias.
IV. RESULTS
A. Ensemble Size
Fig. 5 presents the results of the selected ICi across ten sub-jects. The averaged correlation coefficients between selected maps and template maps were 0.978, 0.957, 0.925, 0.943, and 0.853 for the frontal, central, motor, parietal, and occipital com-ponents, respectively. The results for the occipital component exhibited the largest standard deviation (0.11) because the ICi included left-, right-, middle-, and bilaterally oriented maps. Additionally, different subjects returned different numbers of components, as expected. Therefore, the sizes of the ensembles for the ten subjects were nine, five, six, five, nine, two, five, six, six, and eight, respectively.
B. Spectral Characteristics of ICi
Fig. 6 presents the ICi spectral dynamics in response to changes in the global RT. The power spectra of all of the ICi increased as the degree of arousal declined. The spectral powers
Fig. 6. Spectral dynamics of five ICi co-varied with arousal state, as measured by the global RT, in (A) frontal component, (B) central component, (C) motor component, (D) parietal component, and (E) occipital component. Blue and red traces represent mean power spectra in alert and drowsy states. Asterisk indi-cates a statistically significant difference between two traces (Mann–Whitney test, ). (E) Difference between two power spectra (red trace minus blue trace in A, B, C, D, and E).
of the drowsy group were significantly higher (Mann–Whitney test, ) than those of the alert group over the frequency range of 1-12 Hz across five ICi; moreover, the central and motor components revealed a significant difference between the beta-band (20–30 Hz) activities in the two states. Fig. 6(f) plots the power differences between the alert and drowsy trials: the delta and theta powers in the frontal, central and motor components were larger in the drowsy state than that in the alert state, and the delta, theta and alpha powers in the parietal and occipital components were larger in the drowsy state than that in the alert state. This evidence reveals that the spectral power from various regions of the brain can be used to estimate the cognitive states of a subject.
C. Accuracy of Classification
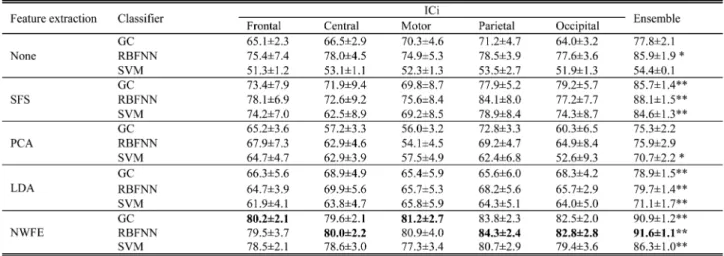
Table II presents the comparative classification results (av-erage and standard deviation of accuracy) obtained using dif-ferent FE processes and difdif-ferent classifiers. The final column in the table presents the classification results that were obtained using the ICi-ensemble. An asterisk indicates significant
im-provement ( : , : in
the Mann–Whitney test) over the highest accuracy obtained using the single classifier. The best accuracies achieved using spectral information from the frontal, central, motor, parietal,
and occipital components were ,
, ,
, and
, respectively. Statistical analysis reveals that the pro-posed ensemble system significantly outperformed the use of single ICi in most cases. For example, when NWFE with SVM was used, the accuracy increased from 79.5% (frontal), 80.0% (central), 80.9% (motor), 84.3% (parietal), and 82.8% (occip-ital) to 91.6% (ensemble), and the standard deviation decreased from 2.2-4.0% to 1.1%. Table III presents the average confu-sion matrix and average sensitivity and specificity of each class, obtained using the best single-ICi method (parietal component)
TABLE III
AVERAGECONFUSIONMATRIX, SENSITIVITY,ANDSPECIFICITYOBTAINEDUSINGNWFEANDSVMBYSINGLE-ICIMETHOD ANDICI-ENSEMBLE
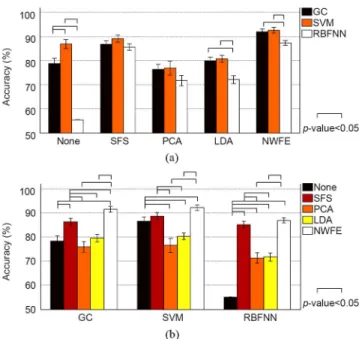
and the proposed ICi-ensemble. The single-ICi method yielded average of sensitivities (specificities) of Classes A, B, C, and D of 80.7% (72.7%), 59.3% (80.2%), 78.4% (75.5%), and 80.7% (74.8%), respectively. For the proposed ICi-ensemble, the av-erage sensitivities (specificities) of Classes A, B, C, and D were 92.6% (87.4%), 78.8% (92.1%), 83.3% (90.2%), and 98.2% (87. 2%), respectively. The proposed ICi-ensemble evidently out-performed the single-ICi model for all classes. Fig. 7(a) shows the classification accuracies of GC, SVM, and RBFNN, ob-tained by SFS-based and PCA-based features in the proposed ICi-ensemble, which were not significantly different from each other. When the original, LDA-based, or NWFE-based features were used, GC and SVM significantly outperformed RBFNN. In Fig. 7(b), FE improved the accuracy by 10%–20%, particularly in GC and RBFNN (as determined by ANOVA with post-hoc
multiple comparison tests, ). Overall, using
NWFE maximized the accuracy from to . A
max-imal classification accuracy of over 90% was achieved using the proposed ICi ensemble with NWFE and GC or SVM.
V. DISCUSSION
A. Multiple Brain Regions and Cognitive States
This work demonstrates that the EEG activities in multiple brain regions correlated with human cognitive states in a sus-tained-attention driving task. The frontal component is located close to both the anterior cingulate cortex and the prefrontal cortex, which are the regions that typically perform executive
functions, attention, and decision-making [32], [33]. The sig-nificantly increasing delta and theta powers of the frontal com-ponent associated with poor performance [Fig. 6(a)] are con-sistent with the results of earlier studies that involve reduced levels of attention [34], severe driving errors [8], and sleep-de-prived driving [35]. The central and motor components are lo-cated across the motor and sensory cortices, which are the re-gions widely used for motion-imagery BCI [36]. The results that are presented in Fig. 6(b) and (c) provide physiological evi-dence of the correlation between increases in EEG power (1–12 Hz) and worsening motor performance [8], [37]. The parietal and occipital components are located in the posterior cingulate cortex and the occipital cortex, respectively. Increasing powers in the delta, theta, and alpha ranges [Fig. 6(d) and (e)] have been shown to be highly correlated with poor task performance, fa-tigue, or drowsiness [38]. This physiological evidence verifies that complex human behaviors involve a large cortical region that spans frontal, central, motor, parietal, and occipital areas. Thus, it is reasonable to develop an ensemble technique that in-tegrates the informative features from distributed brain regions for real-world applications.
B. Ensemble Classification
This study demonstrates that the independent component en-semble system (Fig. 1) more effectively than the conventional BCI classifies a subject’s cognitive states. Most importantly, the proposed method can solve the inherent problems of ICA for
236 IEEE TRANSACTIONS ON NEURAL SYSTEMS AND REHABILITATION ENGINEERING, VOL. 22, NO. 2, MARCH 2014
Fig. 7. Statistical comparison of accuracies of classification achieved using various combinations of feature extraction and classifiers in proposed ICi-en-semble (ANOVA and post-hoc multiple comparison tests, ). (A) Comparison of performance of classifiers using various feature extractions. (B) Comparison of performance of feature extractions using various classifiers.
BCIs. The advantages of this proposed system are summarized as follows.
Artifact-free and independent brain signals: Ensemble
learning has been proven to improve EEG signal classification in a mental imagery task [39] and a motor imagery task [40]. However, these channel-based frameworks may be unsuitable for the ICA-processed data, which varied among EEG record-ings (Fig. 5). Additionally, the EEG signals often accompany pervasive motion artifacts in an operating environment. Using the informative ICi might mitigate artifact contamination and thereby improve classification performance. The diversity of the members of an ensemble is an important concept in ensemble classification theory [41]. Using the ICs to build classifiers can guarantee high diversity among the classifiers [42].
Automatic ICi selection: There are several reasons to
de-velop an automatic ICi selection for ICA-based BCIs. First, ICs are usually ordered in decreasing order of variance accounted for by their projections onto the scalp. However, the order of the components cannot be known in advance and the random weight matrix used in repeated ICA trainings may lead to a different ICA result. Second, EEG is inherently nonstationary because the properties of the underlying independent processes vary over time. Some low-frequency contributions , caused by sweating artifacts etc., may add spatially nonsta-tionary signals to the EEG and consequently have an adverse effect on outcome of ICA [43]. Due to EEG’s nonstationarity, ICs obtained from different subjects and sessions may vary widely [19]. Third, the spatial maps of ICA provide spatial information concerning source localization and reconstruction [21], but slight difference across subjects in the orientation of equivalent dipoles for a set of equivalent ICs can produce different IC scalp maps. Users can define the spatial templates
of ICi based on their current knowledge of the target problem. Although the threshold of the correlation coefficient was set to 0.8 herein, an empirical analysis reveals that it can be increased to 0.9 for frontal, central, motor, and parietal components. The absolute value of the correlation coefficient is used to select the ICi that may have a reverse polarity [25]. However, ICi and artifact component may have reverse polarity, causing the model to misclassify some ICs. To minimize this selection bias, the location of a 3-D equivalent dipole [21] must be included in the automatic ICi selection.
Multi-ICi strategy: The authors’ previous ICA-based
sys-tems [13], [23], [24] and most ICA-based algorithms [14]–[16] search only for a single component of interest in the building of BCIs. However, not every subject (EEG dataset) is assumed to have the target ICi (as revealed by the results in Fig. 5). The proposed ICi-ensemble seeks components that match any of the user-defined ICi in the training step, and automatically constructs a subject-dependent model (Fig. 1) to combine the decisions. The multi-ICi strategy therefore ensures that the BCI system works even when only a single ICi can be extracted. Constructing ICi-ensemble classifiers and then combining their outputs seems to be a viable means of reducing the risk of failing to obtain any desired component or of selecting an irrelevant component. Additionally, the spectral dynamics and the classi-fication results that are presented in Fig. 6 and Table II support the idea that using an ensemble system to capture information from multiple brain regions can markedly improve classification performance. Such a scheme will be useful in many studies that depend on the fusing multiple brain activities from distributed regions, such as brain imaging [44], monitoring of motivated natural behavior [45] and the diagnosis of brain disorders [46]. If none of the observed ICs matches any of the templates of ICi, the BCI system can be easily changed from an ICA-based en-semble to a channel-based enen-semble.
Learning in parallel: Each classifier can be regarded as a
BCI subsystem that can learn the unique patterns of brain ac-tivities from distributed regions. A fusion method based on ma-jority voting herein integrates all the decisions made by all clas-sifiers to yield a final result. Instead of using separate classifica-tions, some methods [47], [48] concatenate data from all brain regions to form a high-dimensional dataset and use it to con-struct a single classifier. However, the number and type of ICi vary among subjects and EEG data (Fig. 5), reducing the appli-cability of BCI to real world. Additionally, a potential problem of high-dimensional data is that finding the optimal solution of the learning model is difficult, particularly in a problem with a small sample [28]. Improperly setting the initial values or using improper search methods can cause the learning algorithm to find local optima [20]. Based on this computational reasoning, an ensemble method can yield a better approximation to the op-timal solution than any individual classifier [20]. A real-time ICA processing system is expected to be useful for further im-proving the practical applicability of an online ICA-based BCI.
VI. CONCLUSION
This work proposed an independent component ensemble that integrates informative features identified from multiple
power spectra during simulated driving,” in Foundations of Aug-mented Cognition. Neuroergonomics and Operational Neuroscience, D. Schmorrow, I. Estabrooke, and M. Grootjen, Eds. Berlin, Ger-many: Springer, 2009, vol. 5638, Lecture Notes Comput. Sci., pp. 394–403.
[2] F. Lotte, M. Congedo, A. Lecuyer, F. Lamarche, and B. Arnaldi, “A review of classification algorithms for EEG-based bracomputer in-terfaces,” J. Neural Eng., vol. 4, no. 2, pp. R1–R13, Jun. 2007. [3] S. Machado, F. Araujo, F. Paes, B. Velasques, M. Cunha, H. Budde,
L. F. Basile, R. Anghinah, O. Arias-Carrion, M. Cagy, R. Piedade, T. A. de Graaf, A. T. Sack, and P. Ribeiro, “EEG-based brain-computer interfaces: An overview of basic concepts and clinical applications in neurorehabilitation,” Rev. Neurosci., vol. 21, no. 6, pp. 451–468, May 2010.
[4] S. Marcel and J. D. R. Millan, “Person authentication using brainwaves (EEG) and maximum a posteriori model adaptation,” IEEE Trans. Pat-tern Anal. Mach. Intell., vol. 29, no. 4, pp. 743–752, Apr. 2007. [5] R. Palaniappan and D. P. Mandic, “Biometrics from brain electrical
ac-tivity: A machine learning approach,” IEEE Trans. Pattern Anal. Mach. Intell., vol. 29, no. 4, pp. 738–742, Apr. 2007.
[6] R. Sitaram, S. Lee, S. Ruiz, M. Rana, R. Veit, and N. Birbaumer, “Real-time support vector classification and feedback of multiple emotional brain states,” NeuroImage, vol. 56, no. 2, pp. 753–765, May 2011. [7] L.-D. Liao, C.-Y. Chen, I.-J. Wang, S.-F. Chen, S.-Y Li, B.-W. Chen,
J.-Y. Chang, and C.-T. Lin, “Gaming control using a wearable and wireless EEG-based brain-computer interface device with novel dry foam-based sensors,” J. Neuroeng. Rehabil., vol. 9, no. 5, pp. 1–11, Jan. 2012.
[8] C. Papadelis, Z. Chen, C. Kourtidou-Papadeli, P. D. Bamidis, I. Chouvarda, E. Bekiaris, and N. Maglaveras, “Monitoring sleepi-ness with on-board electrophysiological recordings for preventing sleep-deprived traffic accidents,” Clin. Neurophysiol., vol. 118, no. 9, pp. 1906–1922, Sep. 2007.
[9] F.-C. Lin, L.-W. Ko, C.-H. Chuang, T.-P. Su, and C.-T. Lin, “Gener-alized EEG-based drowsiness prediction system by using a self-orga-nizing neural fuzzy system,” IEEE Trans. Circuits Syst. I, Reg. Papers, vol. 59, no. 9, pp. 2044–2055, Sep. 2012.
[10] R. N. Khushaba, S. Kodagoda, S. Lal, and G. Dissanayake, “Driver drowsiness classification using fuzzy wavelet-packet-based fea-ture-extraction algorithm,” IEEE Trans. Biomed. Eng., vol. 58, no. 1, pp. 121–131, Jan. 2011.
[11] A. J. Bell and T. J. Sejnowski, “An information-maximization ap-proach to blind separation and blind deconvolution,” Neural Comput., vol. 7, no. 6, pp. 1129–1159, Nov. 1995.
[12] T.-P. Jung, S. Makeig, M. J. McKeown, A. J. Bell, T. W. Lee, and T. J. Sejnowski, “Imaging brain dynamics using independent component analysis,” Proc. IEEE, vol. 89, no. 7, pp. 1107–1122, Jul. 2001.
[13] C.-T. Lin, L.-W. Ko, I.-F. Chung, T.-Y. Huang, Y.-C. Chen, T.-P. Jung, and S.-F. Liang, “Adaptive EEG-based alertness estimation system by using ICA-based fuzzy neural networks,” IEEE Trans. Circuits Syst. I, Reg. Papers, vol. 53, no. 11, pp. 2469–2476, Nov. 2006.
[14] Y. Wang and S. Makeig, D. Schmorrow, I. Estabrooke, and M. Grootjen, Eds., “Predicting intended movement direction using EEG from human posterior parietal cortex,” in Proc. HCII 2009, Berlin, 2009, pp. 437–446.
[15] C. I. Hung, P. L. Lee, Y. T. Wu, L. F. Chen, T. C. Yeh, and J. C. Hsieh, “Recognition of motor imagery electroencephalography using independent component analysis and machine classifier,” Ann. Biomed. Eng., vol. 33, no. 8, pp. 1053–1070, Aug. 2005.
Comput. Sci, pp. 1–15.
[21] A. Delorme and S. Makeig, “EEGLAB: An open source toolbox for analysis of single trial EEG dynamics including independent compo-nent analysis,” J. Neurosci. Methods, vol. 134, no. 1, pp. 9–21, Mar. 2004.
[22] C.-T. Lin, C.-H. Chuang, Y.-K. Wang, S.-F. Tsai, T.-C. Chiu, and L.-W. Ko, “Neurocognitive characteristics of the driver: A review on drowsi-ness, distraction, navigation, and motion sickdrowsi-ness,” J. Neurosci. Neu-roeng., vol. 1, no. 1, pp. 61–81, Jun. 2012.
[23] C.-T. Lin, K.-C. Huang, C.-F. Chao, J.-A. Chen, T.-W. Chiu, L.-W. Ko, and T.-P. Jung, “Tonic and phasic EEG and behavioral changes induced by arousing feedback,” NeuroImage, vol. 52, no. 2, pp. 633–642, Aug. 2010.
[24] C.-T. Lin, I.-F. Chung, L.-W. Ko, Y.-C. Chen, S.-F. Liang, and J.-R. Duann, “EEG-based assessment of driver cognitive responses in a dy-namic virtual-reality driving environment,” IEEE Trans. Biomed. Eng., vol. 54, no. 7, pp. 1349–1352, Jul. 2007.
[25] J. Onton, M. Westerfield, J. Townsend, and S. Makeig, “Imaging human EEG dynamics using independent component analysis,” Neu-rosci. Biobehav. Rev., vol. 30, no. 6, pp. 808–822, 2006.
[26] A. Jain, “Feature selection: Evaluation, application, and small sample performance,” IEEE Trans. Pattern Anal. Mach. Intell., vol. 19, no. 2, pp. 153–158, Feb. 1997.
[27] K. Fukunaga, Introduction to Statistical Pattern Recognition. San Diego, CA: Academic, 1990.
[28] B.-C. Kuo and D. A. Landgrebe, “Nonparametric weighted feature ex-traction for classification,” IEEE Trans. Geosci. Remote Sens., vol. 42, no. 5, pp. 1096–1105, May 2004.
[29] F. v. d. Heijden, R. Duin, D. d. Ridder, and D. M. J. Tax, Classification, Parameter Estimation and State Estimation: An Engineering Approach Using MATLAB. Hoboken, NJ: Wiley, 2004.
[30] M. Ferrara and L. D. Gennaro, “How much sleep do we need?,” Sleep Med. Rev., vol. 5, no. 2, pp. 155–179, Apr. 2001.
[31] S. Makeig and M. Inlow, “Lapses in alertness: Coherence of fluctua-tions in performance and EEG spectrum,” Electroencephalogr. Clin. Neurophysiol., vol. 86, no. 1, pp. 23–35, Jan. 1993.
[32] K. Jones and Y. Harrison, “Frontal lobe function, sleep loss and frag-mented sleep,” Sleep Med. Rev., vol. 5, no. 6, pp. 463–475, 2001. [33] M. S. Gazzaniga, R. B. Ivry, and G. R. Mangun, Cognitive
Neuro-science: The Biology of the Mind, 2 ed. New York: W. W. Norton, 2008.
[34] S. Makeig, T.-P. Jung, and T. Sejnowski, “Awareness during drowsi-ness: Dynamics and electrophysiological correlates,” Can. J. Exp. Psy-chol., vol. 54, no. 4, pp. 266–273, 2000.
[35] H. J. Eoh, M. K. Chung, and S.-H. Kim, “Electroencephalographic study of drowsiness in simulated driving with sleep deprivation,” Int. J. Ind. Ergonom., vol. 35, no. 4, pp. 307–320, 2005.
[36] B. Blankertz, G. Curio, and K. R. Müller, “Classifying single trial EEG: Towards brain computer interfacing,” in Advances in Neural Inf. Proc. Systems (NIPS 01). Cambridge, MA: MIT Press, 2002, pp. 157–164.
[37] S. D. Baulk, L. A. Reyner, and J. A. Horne, “Driver sleepiness—Eval-uation of reaction time measurement as a secondary task,” Sleep, vol. 24, no. 6, pp. 695–698, 2001.
[38] P. R. Davidson, R. D. Jones, and M. T. R. Peiris, “EEG-based lapse detection with high temporal resolution,” IEEE Trans. Biomed. Eng., vol. 54, no. 5, pp. 832–839, May 2007.
[39] S. Sun, C. Zhang, and Y. Lu, “The random electrode selection ensemble for EEG signal classification,” Pattern Recognit., vol. 41, no. 5, pp. 1663–1675, May 2008.
238 IEEE TRANSACTIONS ON NEURAL SYSTEMS AND REHABILITATION ENGINEERING, VOL. 22, NO. 2, MARCH 2014
[40] A. Ahangi, M. Karamnejad, N. Mohammadi, R. Ebrahimpour, and N. Bagheri, “Multiple classifier system for EEG signal classification with application to brain-computer interfaces,” Neural Comput. Appl., pp. 1–9, Jul. 2012.
[41] L. Kuncheva and C. Whitaker, “Measures of diversity in classifier en-sembles and their relationship with the ensemble accuracy,” Mach. Learn., vol. 51, no. 2, pp. 181–207, May 2003.
[42] K. H. Liu, B. Li, Q. Q. Wu, J. Zhang, J. X. Du, and G. Y. Liu, “Mi-croarray data classification based on ensemble independent component selection,” Comput. Biol. Med., vol. 39, no. 11, pp. 953–960, Nov. 2009.
[43] M. Ullsperger and S. Debener, Simultaneous EEG and fMRI: Recording, Analysis, and Application. New York: Oxford Univ. Press, 2010.
[44] T. M. Lau, J. T. Gwin, and D. P. Ferris, “How many electrodes are really needed for EEG-based mobile brain imaging?,” J. Behav. Brain Sci., vol. 2, pp. 387–393, Aug. 2012.
[45] S. Makeig, K. Gramann, T. P. Jung, T. J. Sejnowski, and H. Poizner, “Linking brain, mind and behavior,” Int. J. Psychophysiol., vol. 73, no. 2, pp. 95–100, Aug. 2009.
[46] F. B. Vialatte, J. Dauwels, T. Musha, and A. Cichocki, “Audio rep-resentations of multi-channel EEG: A new tool for diagnosis of brain disorders,” Am. J. Neurodegenerat. Disease, vol. 1, no. 3, pp. 292–304, Nov. 2012.
[47] T. Lan, D. Erdogmus, A. Adami, S. Mathan, and M. Pavel, “Channel selection and feature projection for cognitive load estimation using am-bulatory EEG,” Computat. Intell. Neurosci., vol. 2007, pp. 1–12, Aug. 2007.
[48] Y. Wang and T.-P. Jung, “A collaborative brain-computer interface for improving human performance,” PLoS ONE, vol. 6, no. 5, pp. 1–11, May 2011.
Chun-Hsiang Chuang received the B.S. degree
from Taipei Municipal Teachers College, Taipei, Taiwan, in 2004, and the M.S. degree from the National Taichung University, Taichung, Taiwan, in 2009. He is currently working toward the Ph.D. degree at the Institute of Electrical and Control Engi-neering, National Chiao Tung University, Hsinchu, Taiwan.
Li-Wei Ko (M’08) received the B.S. degree in
mathematics from National Chung Cheng Univer-sity, Minxiong, Taiwan, in 2001, the M.S. degree in educational measurement and statistics from National Taichung University, Taichung, Taiwan, in 2004, and the Ph.D. degrees in electrical engineering from National Chiao Tung University, Hsinchu, Taiwan, in 2007.
He is currently an Executive Officer of the Brain Research Center, and an Assistant Professor in De-partment of Biological Science and Technology, Na-tional Chiao Tung University, Hsinchu, Taiwan.
Yuan-Pin Lin (M’13) received the B.S. degree in
biomedical engineering from Chung Yuan Christian University, Chung Li, Taiwan, in 2003, and the M.S. and Ph.D. degrees in electrical engineering from Na-tional Taiwan University, Taipei, Taiwan, in 2005 and 2011, respectively.
He is currently a postdoctoral researcher at the Swartz Center for Computational Neuroscience, University of California, San Diego, CA, USA. His research interests include affective computing, brain–computer interface, biomedical signal pro-cessing, and machine learning.
Tzyy-Ping Jung received the B.S. degree in
elec-tronics engineering from National Chiao Tung University, Hsinchu, Taiwan, in 1984, and the M.S. and Ph.D. degrees in electrical engineering from The Ohio State University, Columbus, OH, USA, in 1989 and 1993, respectively.
He is currently a Research Scientist and the Co-Di-rector of the Center for Advanced Neurological En-gineering, Institute of Engineering in Medicine, Uni-versity of California-San Diego (UCSD), La Jolla, CA, USA. He is also an Associate Director of the Swartz Center for Computational Neuroscience, Institute for Neural Compu-tation, and an Adjunct Professor of Bioengineering at UCSD.
Chin-Teng Lin (F’05) received the B.S. degree from
National Chiao Tung University, Hsinchu, Taiwan, in 1986, and the M.Sc. and Ph.D. degrees in electrical engineering from Purdue University, West Lafayette, IN, USA, in 1989 and 1992, respectively.
Currently, he is the Provost, Chair Professor of Electrical and Computer Engineering, Professor of the Institute of Imaging and Biomedical Photonics, and Director of Brain Research Center at the National Chiao Tung University, Hsinchu, Taiwan.
Dr. Lin is the Editor-in-Chief of the IEEE TRANSACTIONS ONFUZZYSYSTEMS.