Experimental and Theoretical Studies of the Rate Coefficients of the Reaction O(
3P) + HCl
at High Temperatures
Chih-Chang Hsiao and Yuan-Pern Lee*,†
Department of Chemistry, National Tsing Hua UniVersity, 101, Section 2, Kuang Fu Road, Hsinchu 30013, Taiwan
Niann S. Wang
Department of Applied Chemistry, National Chiao Tung UniVersity, 1001, Ta Hsueh Road, Hsinchu 30010, Taiwan
J. H. Wang and M. C. Lin*,‡
Department of Chemistry, Emory UniVersity, Atlanta, Georgia 30322 ReceiVed: April 8, 2002; In Final Form: July 23, 2002
Rate coefficients of the reaction O(3P) + HCl in the temperature range 1093-3197 K were determined using a diaphragmless shock tube. O atoms in the ground electronic3P states were generated either by photolysis of SO2with a KrF excimer laser at 248 nm or by pyrolysis of N2O with the shock wave. Their concentrations were monitored via atomic resonance absorption excited by emission from a microwave-discharged mixture of O2and He. Rate coefficients determined in this work show non-Arrhenius behavior, with values consistent with previously reported measurements for T < 1486 K; they fit well with the equation k1(T) ) (9.27 ( 0.03) × 10-24T3.67(0.18exp[-(1030 ( 160)/T] cm3molecule-1s-1; listed errors represent one standard deviation in fitting. Theoretical calculations at the CCSD(T)/6-311+G(d, p) level locate a bent3A′′(TS1) and a linear 3A′ (TS3) transition state characterized previously. On the basis of the results computed by CCSD(T)/ 6-311+G(3df,2p)//CCSD(T)/6-311+G(d,p), the rate coefficients predicted with conventional transition-state theory, including Eckart-tunneling corrections and with variational transition-state theory including zero- and small-curvature tunneling corrections, all agree satisfactorily with experimental observations.
1. Introduction
The reaction
is important because it converts stable HCl into reactive Cl atoms that can catalytically destroy O3in the atmosphere.1In combustion systems at elevated temperature, this reaction is the most fundamental that involves Cl atoms; it plays an important role in the combustion of ammonium perchlorate propellants,2 incineration of toxic waste, inhibition of flames, and formation of soot.3,4
Rate coefficients of reaction 1 were determined in the temperature range 290-1486 K by several groups.5-11 All measurements below 720 K show, within experimental uncer-tainties, consistent Arrhenius behavior. Mahmud et al.11 deter-mined the rate coefficient of reaction 1 in the temperature range 350-1486 K with two types of high-temperature photochemical
reactors and reported rate coefficients with a slight positive deviation from Arrhenius behavior at high temperature. Com-bining the then-available data, they reported
for 350 K < T < 1486 K with an error limit (2σ) of 23%. The title reaction has been subjected to extensive theoretical investigation by many research groups. It is an example of a heavy-light-heavy reaction with a small skew angle and is therefore expected to manifest important quantum effects. The system, with only one H, one O, and one Cl atom, is simple enough to allow accurate theoretical calculations. Characteriza-tion of the potential energy surface (PES) of this system12-20 and, on the basis of this PES, predictions of thermal and state-specific rate coefficients21-31 using various methods have improved significantly and show satisfactory agreement with experiments. Excellent reviews of previous theoretical work can be found in several articles.16,26,30
Because of the importance of this reaction in combustion, kinetic data at higher temperatures are needed. We have constructed a diaphragmless shock tube and determined rate coefficients of the title reaction up to 3197 K. Because previous theoretical predictions of k1 are limited to 1000 K, we also
* Corresponding authors. Y.-P. Lee: E-mail: [email protected]; Fax: 886-3-5722892. M.C. Lin: E-mail: [email protected]; Fax: 1-404-727-6586.
†Jointly appointed by the Institute of the Atomic and Molecular Sciences,
Academia Sinica, Taipei, Taiwan.
‡National Science Council Distinguished Visiting Professor in the
Department of Applied Chemistry, Chiao Tung University, Taiwan.
O(3P) + HCl f OH + Cl (1) k
1(T) )
5.6× 10⁻²¹T2.87exp[-(1766/T)] cm3molecule-1s-1 (2)
10.1021/jp020916n CCC: $22.00 © 2002 American Chemical Society Published on Web 09/28/2002
performed theoretical calculations and found excellent agreement between theory and experiments throughout the temperature range of study.
2. Experiments
Details of the diaphragmless shock tube apparatus can be found in ref 32. The shock tube, of length 5.9 m and i.d. 7.6 cm, is coupled to a detection system using atomic resonance absorption. Four pressure sensors were installed at 3, 18, 28, and 38 cm from the end of the tube to monitor the shock wave. Three time-frequency counters (Tabor Electronics, model 6010) were employed to determine the time intervals for arrival of the shock wave between each sensor; the speed of the shock wave is thus determined. A microwave-discharged lamp with a flowing gas mixture of∼10% O2in He served as a lamp for the atomic absorption of O atoms. Emission of the lamp at 130.23, 130.49, and 130.60 nm, corresponding to atomic transitions of O(3S) f O (3P
2, 1, 0), passes perpendicularly near the end of the shock tube and a vacuum UV monochromator (ARC, VM502, focal length 20 cm, reciprocal linear dispersion 4.0 nm mm-1, slit width 500µm) before being detected with a solar-blind photomultiplier tube (Hamamatsu, R972). Variation of the signal from the photomultiplier was monitored with a digital storage oscilloscope and transferred to a computer for further processing.
When needed, a KrF excimer laser (248 nm) was employed for photolysis. Light from the laser enters the shock tube from the quartz end-plate and passes along the tube. A delayed pulse generator (Stanford Research Systems, DG535) was employed to trigger the laser about 200µs after the arrival of the incident shock wave at the last pressure sensor.
Before each experiment, the system was pumped below 5.0 × 10⁻⁷Torr. The temperature (T
5), density (F5), and pressure (P5) in the reflected shock regime were calculated from the measured velocity of the incident shock, the composition of the test gas, the initial pressure, and the temperature using the ideal shock-wave theory33 with Mirels’ boundary-layer correc-tions.34,35
We calibrated the concentration of O atoms in the shock tube with N2O, assuming a 100% yield of O atoms from the pyrolysis of N2O. For kinetic measurements, O atoms were generated from the laser photolysis of SO2at 248 nm. In some experiments, O atoms were generated from the pyrolysis of N2O for comparison. At 248 nm, the absorption cross section of SO2is 7.7× 10⁻²⁰ cm2at 1100 K and 5.3× 10⁻¹⁹cm2at 2000 K.36
He (99.9995%, AGA Specialty Gases), O2(99.999%, Scott Specialty Gases), SO2(99.98%, Matheson), and HCl (99.999%, AGA Specialty Gases) were used without further purification. Mixtures of HCl in Ar (23.4-202 ppm), SO2in Ar (292-971 ppm), and N2O in Ar (11.6 ppm) were used.
3. Computational Methods
The geometry of reactants, intermediates, transition states, and products of the O-H-Cl system were optimized at the B3LYP/6-311G(d,p) level of theory with Becke’s three-parameter nonlocal exchange functional37 and the nonlocal correlation functional of Lee et al.38Energies of all species were calculated by the G2M39 method, which makes a series of calculations with geometries optimized with the B3LYP method to approximate the CCSD(T)/6-311+G(3df,2p) level of theory, including a “higher-level correction” (HLC) based on the number of paired and unpaired electrons. The total G2M energy
(in units of mhartree) corrected with the zero-point energy (ZPE) is calculated as follows:39
with
in which nRand nβare the number of valence electrons, nRg
nβ.
Because the present system is relatively small, we have also calculated the energies of all species at the CCSD(T)/ 6-311++G(3df,2p) level of theory using the B3LYP/6-311+G-(3df,2p) optimized geometries. For comparison, we have also carried out similar calculations using the geometries optimized at the CCSD(T)/6-311+G(d,p) of theory. All calculations were carried out with the Gaussian 9840and MOLPRO 9641programs. Rate coefficients for various reaction channels were calculated with conventional transition-state theory (TST) with Eckart-tunneling corrections using the program previously employed for the reaction C6H5+ CH4.42We employed also the Polyrate program of Truhlar et al.43based on variational TST including zero- or small-curvature tunneling corrections.
Rate coefficients were computed on the basis of results using the G2M and the CCSD(T)/6-311+G(3df,2p)//CCSD(T)/ 6-311+G(d,p) methods. In the calculation using the latter method, we performed the IRCMax calculation44to stimulate the IRC curves at the level IRCMax{energy[CCSD(T)/ 6-311+G(d,p)]}//IRC{geometry[B3LYP/6-311+G(d,p)]}. The first and second derivatives of the points on the IRC curves for zero- or small-curvature tunneling treatments were calculated at the CCSD(T)/6-311+G(d,p) level.
4. Results and Discussion
4.1. Calibration of [O]. Figure 1A shows a typical temporal
profile of the signal intensity of the photomultiplier observed for the thermal decomposition of N2O in the reflected shock regime. The calibration of [O] using the thermal decomposition of N2O has become a standard procedure to account for deviation from the Beer-Lambert law.45The calibration curve of [O] for our system is shown in Figure 2. Absorbance A is calculated with the equation
in which the light intensity before and after the production of O atoms is denoted as I0and I, respectively. The concentration of O atoms is fitted with the equation
E[(G2M, CC2)] ) Ebas+ ∆E(+) + ∆E(2df) + ∆E(CC) +
∆′+ ∆E(HLC, CC2) + ZPE (3)
Ebas) E[PMP4/6-311G(d,p)]
∆E(+) ) E[PMP4/6-311+G(d,p)] - Ebas ∆E(2df) ) E[PMP4/6-311G(2df,p)] - Ebas ∆E(CC) ) E[CCSD(T)/6-311G(d,p)] - Ebas ∆′) [UMP2/6311+G(3df,2p)] E[UMP2/6311+G(2df,p)]
-E[UMP2/6-311+G(d,p)] + E[UMP2/6-311(d,p)]
∆E(HLC, CC2) ) -5.78nβ- 0.19nR
A ) ln(I0/I) (4)
[O]/1013molecule cm-3) 4.4233A - 0.0336A2+
4.2. Rate Coefficient k1of the Reaction O + HCl. Figure
1B shows a typical temporal profile of the signal intensity of the photomultiplier observed when the gas mixture contained only SO2 and Ar. The first stepwise decrease in intensity (upward direction in Figure 1B) corresponds to variation in the absorbance of SO2upon arrival of the incident wave; SO2has a nonnegligible absorption cross section of∼1.1 × 10⁻¹⁷cm2 near 130 nm at 300 K.46 The second stepwise change is associated with the arrival of the reflected shock wave, and the third step is due to the production of O atoms upon laser irradiation at 248 nm. Figure 1C shows a typical temporal profile recorded similarly except that the mixture contains SO2and HCl. Because O atoms reacted with HCl, the light intensity detected by the photomultiplier increased with time as [O] reacted. The concentration of O atoms at reaction period t, [O]t, is derived according to eqs 4 and 5, with the light intensity before photolysis taken as I0. Experiments were carried out under pseudo-first-order conditions with [HCl] . [O]. If there were no interference reaction, the temporal profile of [O]tcould be
fitted to a first-order decay curve to yield a pseudo-first-order rate coefficient kI. The apparent bimolecular rate coefficient, k1′, is thus derived from
At high temperatures, interference from reactions of O atoms with precursor SO2 and with reaction products SO and OH should be considered,
with these reported temperature dependences of the rate coef-ficients:
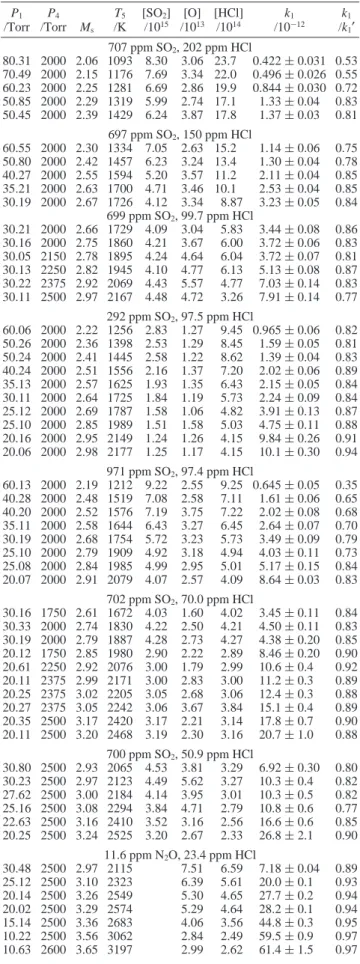
Although recent experimental data51show a nearly constant rate coefficient of (1.54 ( 0.14)× 10-11cm3molecule-1s-1 for reaction 9 in the temperature range 1850-3550 K, we used a previously recommended value (eq 13) that is about 40% greater at 3000 K for the worst-case scenario. We modeled an observed temporal profile of [O] with reactions 1, 7-9 with the commercial kinetic modeling program FACSIMILE;52literature values of rate coefficients of reactions 7-9 were held constant, and the bimolecular rate coefficient of the title reaction, k1, was varied to yield the best fit. Experimental conditions and values of k1for 50 measurements in the temperature range 1093-2525 K using mixtures with various concentrations of HCl and SO2 are summarized in Table 1. Values of k1′obtained with eq 6 from pseudo-first-order decays are slightly greater than k1, indicating that interference reactions play a minor role; we list
k1/k1′in Table 1 for comparison. For experiments with large concentrations, [HCl] > 1× 10¹⁵molecule cm-3and [SO
2] > 6 × 10¹⁵ molecule cm-3, the deviation is as much as 65%. Detailed modeling shows that reaction 9 is more important than reaction 7 at low temperatures but vice versa at high temper-atures.
Complementary experiments at high temperatures were carried out with O atoms produced from the thermal decomposi-tion of N2O. Under such conditions, reaction 14 replaces reactions 7 and 8 in the kinetic model
with a temperature-dependent rate coefficient of53,54 Figure 1. Temporal profiles of photomultiplier signals observed for
the (A) thermal decomposition of N2O (30 ppm in Ar), (B)
laser-irradiated Ar sample containing SO2(697 ppm), and (C) laser-irradiated
Ar sample containing SO2(697 ppm) and HCl (150 ppm).
Figure 2. Calibration curve of [O] versus absorbance of O atoms.
k1′) kI/[HCl] (6) O + SO2f SO3 (7a) f SO + O2 (7b) O + SO f SO2 (8) O + OH f H + O2 (9) k7a(T) ) 1.21× 10⁻³³exp(3163/T) cm6molecule-2s-1 (ref 47) (10) k7b(T) ) 8.3× 10⁻¹²exp(-9800/T) cm3molecule-1s-1 (ref 48) (11) k8(T) ) 3.3× 10⁻²⁶T-1.84cm6molecule-2s-1 (ref 49) (12) k9(T) ) 2.41× 10⁻¹¹exp(-350/T) cm3molecule-1s-1 (ref 50) (13) O + N2O f NO + NO (14a) f N2+ O2 (14b)
k14a(T) ) 1.52× 10⁻¹⁰exp(-13930/T) cm3molecule-1s-1 (15)
k14b(T) ) 6.13× 10⁻¹²exp(-8020/T) cm3molecule-1s-1 (16) Rate Coefficients of O(P) + HCl at High T J. Phys. Chem. A, Vol. 106, No. 43, 2002 10233
At low concentrations of [N2O] and [HCl], reactions 9 and 14 have negligible effects on k1, as shown in Table 1.
Values of k1at various temperatures are plotted in Figure 3; data by Mahmud et al.11(b) are included for comparison; our data agree well with theirs in the region of overlapping temperature, 1093-1486 K. We extended the temperature range from 1486 to 3197 K and show clearly the non-Arrhenius behavior of k1.
Fitting our results combined with previous data yields the expression
in which the listed errors represent one standard deviation of the fit. By comparing with the equation reported by Mahmud et al.11
we find that eq 17 describes the rate coefficients at high temperature better.
4.3. Potential Energy Surfaces and Reaction Mechanism.
The reaction O + HCl may proceed via the following two paths, producing OH and ClO, respectively:
However, as will be shown later, reaction 1b plays an insignificant role even at a temperature as high as 3000 K because it has a large barrier and is significantly more endothermic.
The geometries of all of the transition states (TS) and local minima (van der Waals complexes) identified by searching with the intrinsic reaction coordinate (IRC)55at the B3LYP/6-311+G-(3df,2p) level of theory are presented in Figure 4; potential energy diagrams for reaction paths 1a and 1b are shown in Figure 5. Three local minima, LM1, LM2, and LM3, were found. The linear LM1, OHCl (3A′′), formed by the association
TABLE 1: Experimental Conditions and Rate Coefficient k1
for the Reaction O + HCla
P1 /Torr P4 /Torr Ms T5 /K [SO2] /1015 [O] /1013 [HCl] /1014 k1 /10-12 k1 /k1′ 707 ppm SO2, 202 ppm HCl 80.31 2000 2.06 1093 8.30 3.06 23.7 0.422 ( 0.031 0.53 70.49 2000 2.15 1176 7.69 3.34 22.0 0.496 ( 0.026 0.55 60.23 2000 2.25 1281 6.69 2.86 19.9 0.844 ( 0.030 0.72 50.85 2000 2.29 1319 5.99 2.74 17.1 1.33 ( 0.04 0.83 50.45 2000 2.39 1429 6.24 3.87 17.8 1.37 ( 0.03 0.81 697 ppm SO2, 150 ppm HCl 60.55 2000 2.30 1334 7.05 2.63 15.2 1.14 ( 0.06 0.75 50.80 2000 2.42 1457 6.23 3.24 13.4 1.30 ( 0.04 0.78 40.27 2000 2.55 1594 5.20 3.57 11.2 2.11 ( 0.04 0.85 35.21 2000 2.63 1700 4.71 3.46 10.1 2.53 ( 0.04 0.85 30.19 2000 2.67 1726 4.12 3.34 8.87 3.23 ( 0.05 0.84 699 ppm SO2, 99.7 ppm HCl 30.21 2000 2.66 1729 4.09 3.04 5.83 3.44 ( 0.08 0.86 30.16 2000 2.75 1860 4.21 3.67 6.00 3.72 ( 0.06 0.83 30.05 2150 2.78 1895 4.24 4.64 6.04 3.72 ( 0.07 0.81 30.13 2250 2.82 1945 4.10 4.77 6.13 5.13 ( 0.08 0.87 30.22 2375 2.92 2069 4.43 5.57 4.77 7.03 ( 0.14 0.83 30.11 2500 2.97 2167 4.48 4.72 3.26 7.91 ( 0.14 0.77 292 ppm SO2, 97.5 ppm HCl 60.06 2000 2.22 1256 2.83 1.27 9.45 0.965 ( 0.06 0.82 50.26 2000 2.36 1398 2.53 1.29 8.45 1.59 ( 0.05 0.81 50.24 2000 2.41 1445 2.58 1.22 8.62 1.39 ( 0.04 0.83 40.24 2000 2.51 1556 2.16 1.37 7.20 2.02 ( 0.06 0.89 35.13 2000 2.57 1625 1.93 1.35 6.43 2.15 ( 0.05 0.84 30.11 2000 2.64 1725 1.84 1.19 5.73 2.24 ( 0.09 0.84 25.12 2000 2.69 1787 1.58 1.06 4.82 3.91 ( 0.13 0.87 25.10 2000 2.85 1989 1.51 1.58 5.03 4.75 ( 0.11 0.88 20.16 2000 2.95 2149 1.24 1.26 4.15 9.84 ( 0.26 0.91 20.06 2000 2.98 2177 1.25 1.17 4.15 10.1 ( 0.30 0.94 971 ppm SO2, 97.4 ppm HCl 60.13 2000 2.19 1212 9.22 2.55 9.25 0.645 ( 0.05 0.35 40.28 2000 2.48 1519 7.08 2.58 7.11 1.61 ( 0.06 0.65 40.20 2000 2.52 1576 7.19 3.75 7.22 2.02 ( 0.08 0.68 35.11 2000 2.58 1644 6.43 3.27 6.45 2.64 ( 0.07 0.70 30.19 2000 2.68 1754 5.72 3.23 5.73 3.49 ( 0.09 0.79 25.10 2000 2.79 1909 4.92 3.18 4.94 4.03 ( 0.11 0.73 25.08 2000 2.84 1985 4.99 2.95 5.01 5.17 ( 0.15 0.84 20.07 2000 2.91 2079 4.07 2.57 4.09 8.64 ( 0.03 0.83 702 ppm SO2, 70.0 ppm HCl 30.16 1750 2.61 1672 4.03 1.60 4.02 3.45 ( 0.11 0.84 30.33 2000 2.74 1830 4.22 2.50 4.21 4.50 ( 0.11 0.83 30.19 2000 2.79 1887 4.28 2.73 4.27 4.38 ( 0.20 0.85 20.12 1750 2.85 1980 2.90 2.22 2.89 8.46 ( 0.20 0.90 20.61 2250 2.92 2076 3.00 1.79 2.99 10.6 ( 0.4 0.92 20.11 2375 2.99 2171 3.00 2.83 3.00 11.2 ( 0.3 0.89 20.25 2375 3.02 2205 3.05 2.68 3.06 12.4 ( 0.3 0.88 20.27 2375 3.05 2242 3.06 3.67 3.84 15.1 ( 0.4 0.89 20.35 2500 3.17 2420 3.17 2.21 3.14 17.8 ( 0.7 0.90 20.11 2500 3.20 2468 3.19 2.30 3.16 20.7 ( 1.0 0.88 700 ppm SO2, 50.9 ppm HCl 30.80 2500 2.93 2065 4.53 3.81 3.29 6.92 ( 0.30 0.80 30.23 2500 2.97 2123 4.49 5.62 3.27 10.3 ( 0.4 0.82 27.62 2500 3.00 2184 4.14 3.95 3.01 10.3 ( 0.5 0.82 25.16 2500 3.08 2294 3.84 4.71 2.79 10.8 ( 0.6 0.77 22.63 2500 3.16 2410 3.52 3.16 2.56 16.6 ( 0.6 0.85 20.25 2500 3.24 2525 3.20 2.67 2.33 26.8 ( 2.1 0.90 11.6 ppm N2O, 23.4 ppm HCl 30.48 2500 2.97 2115 7.51 6.59 7.18 ( 0.04 0.89 25.12 2500 3.10 2323 6.39 5.61 20.0 ( 0.1 0.93 20.14 2500 3.26 2549 5.30 4.65 27.7 ( 0.2 0.94 20.02 2500 3.29 2574 5.29 4.64 28.2 ( 0.1 0.94 15.14 2500 3.36 2683 4.06 3.56 44.8 ( 0.3 0.95 10.22 2500 3.56 3062 2.84 2.49 59.5 ( 0.9 0.97 10.63 2600 3.65 3197 2.99 2.62 61.4 ( 1.5 0.97 aP
1: pressure of reactant gas mixture; P4: pressure of driver gas;
Ms: Mach number; T5: temperature of reaction. Concentrations are in
units of molecule cm-3; k1values in cm3molecule-1s-1are fitted with
kinetic modeling, and k1′values are derived from pseudo-first-order
decays; see text.
Figure 3. Arrhenius plots of k1in the temperature range 1000-3197 K; Mahmud et al.11(b); this work (other symbols); our fitted equation
(solid line); equation of Mahmud et al. (dashed line).
k1) (9.27 ( 0.03)10-24× T3.67(0.18exp[-(1030 ( 160)/T] cm3molecule-1s-1 (17) k1) 5.6 × 10⁻²¹T2.87exp [-(1766/T)] cm3molecule-1s-1 (2) O(3P) + HCl(1Σ+) f OH(2Π) + Cl(2P) (1a) f ClO(2Π) + H(2S) (1b)
of reactants is not connected with any TS according to IRC analysis. A nonlinear LM2 with∠OHCl ) 63.3°, a complex of products OH and Cl, connects with the reactants O + HCl via TS1 and TS2. In contrast, TS3 connects directly with products OH + Cl according to IRC and IRCMax analyses. Both TS1 and TS2 belong to 3A′′ symmetry, whereas TS3 belongs to3A′symmetry. For reaction path 1b, LM3 is a linear complex of products H and ClO; it connects with the reactants via a linear transition state TS4.
Our search for transition states at the B3LYP/6-311+G-(3df,2p) level of theory located an additional transition state
TS2 with a nearly linear structure of3A′′symmetry and energy between TS1 and TS3 (see Table 2 and Figure 5); it was not confirmed by the CCSD(T)/6-311+G(d,p) calculation. Similarly, Ramachandran et al.16also failed to identify such a transition state at the MR-CI+Q/cc-pVTZ level of theory. Koizumi et al.13 identified a stationary point (with two imaginary frequencies) with an energy∼0.08 kcal mol-1above their TS1; this stationary point may be compared with our TS2. The disappearance of TS2 at higher levels of theory may result from differences in dynamic correlations at varied levels of theory.
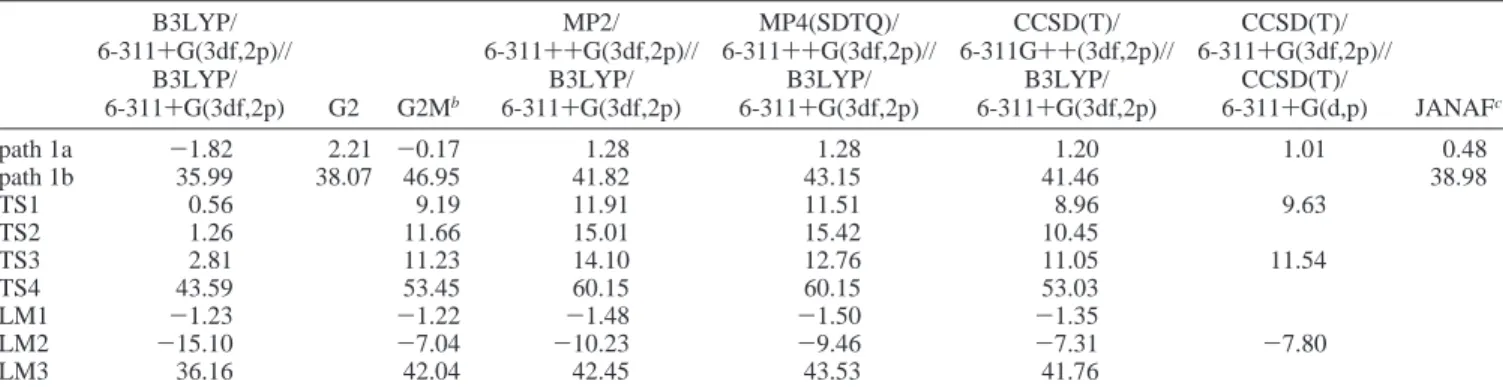
Predicted enthalpies of reaction for two reaction paths and enthalpies of formation of various species at various levels of theory are tabulated in Table 2. For reaction path 1a leading to products OH + Cl, barriers of 8.96, 10.45, and 11.05 kcal mol-1, respectively, for TS1, TS2, and TS3 were predicted at the CCSD(T)/6-311++G(3df,2p) level of theory on the basis of geometries optimized with the B3LYP/6-311+G(3df,2p) method. These values agree within∼1 kcal mol-1with those predicted by the G2M method that employs a series of corrections to expand the basis set from 6-311G(d,p) to 6-311++G(3df,2p) as previously mentioned. Although TS2 was not confirmed at the CCSD(T)/6-311+G(d,p) level of theory, the energies computed for TS1 and TS3 with CCSD(T)/6-311+G(3df,2p) using the geometry obtained at CCSD(T)/6-311+G(d,p) are in good accord with those predicted with the G2M and the CCSD(T)/6-311+G(3df,2p)//B3LYP/6-311+G(3df,2p) methods, as shown in Table 2.
TS1 has been studied the most extensively; our predicted structure agrees with those predicted by Koizumi et al.13and Ramachandran et al.,16 except that our value of ∠OHCl ) 139.5°is greater than these earlier predictions by about 6 and 8°, respectively. Our predicted barrier of 9.63 kcal mol-1 for TS1 by CCSD(T)/6-311+G(3df,2p)//CCSD(T)/6-311+G(d,p) is about 1.1 kcal mol-1 greater than a barrier (KSG) fitted by Koizumi et al. on the basis of MP2/6-31G(d,p) calculations but is about 0.2 kcal mol-1smaller than the scaled (S4) barrier of Ramachandran et al. that is based on calculations with MR-CI+Q/cc-pVTZ. Significant tunneling effects preclude direct comparison of the predicted barrier at 0 K with the experimental activation energy,∼8.7 kcal mol-1.
TS3 is predicted to be linear with3A′symmetry, lying 11.54 kcal mol-1above the reactants and 1.91 kcal mol-1above TS1 at the CCSD(T)/6-311+G(3df,2p)//CCSD(T)/6-311+G(d,p) level. Koizumi et al.13also reported the existence of a similar linear TS with3A′symmetry, which lies 11.9 kcal mol-1above their
TABLE 2: Predicted Enthalpies of Reaction for Two Reaction Paths and ZPE-Corrected Energies of Transition States and
Intermediates Relative to the Energy of the Reaction O + HCla
B3LYP/ 6-311+G(3df,2p)// B3LYP/ 6-311+G(3df,2p) G2 G2Mb MP2/ 6-311++G(3df,2p)// B3LYP/ 6-311+G(3df,2p) MP4(SDTQ)/ 6-311++G(3df,2p)// B3LYP/ 6-311+G(3df,2p) CCSD(T)/ 6-311G++(3df,2p)// B3LYP/ 6-311+G(3df,2p) CCSD(T)/ 6-311+G(3df,2p)// CCSD(T)/ 6-311+G(d,p) JANAFc path 1a -1.82 2.21 -0.17 1.28 1.28 1.20 1.01 0.48 path 1b 35.99 38.07 46.95 41.82 43.15 41.46 38.98 TS1 0.56 9.19 11.91 11.51 8.96 9.63 TS2 1.26 11.66 15.01 15.42 10.45 TS3 2.81 11.23 14.10 12.76 11.05 11.54 TS4 43.59 53.45 60.15 60.15 53.03 LM1 -1.23 -1.22 -1.48 -1.50 -1.35 LM2 -15.10 -7.04 -10.23 -9.46 -7.31 -7.80 LM3 36.16 42.04 42.45 43.53 41.76
aTotal energies in hartrees for O + HCl are B3LYP/6-311+G(3df,2p), -535.9188519; G2, -535.3222061; G2M, -535.3348626; MP2/
6-311++G(3df,2p), -535.2511837; MP4(SDTQ)/6-311++G(3df,2p), -535.2976216; CCSD(T), -535.2993457; and CCSD(T)/6-311++G(3df,2p),
-535.2993457 based on the geometry and frequencies computed at B3LYP/6-311+G(3df,2p); CCSD(T)/6-311+G(3df,2p)//CCSD(T)/6-311+G.(d,p), -535.2991418.bG2M results were calculated according to the G2M(RCC2) model.cUsing enthalpies of formation listed in the JANAF table57
and the revised value of OH58.
Figure 4. Optimized geometries of four transition states and three local
minima of the O-H-Cl system. Listed bond lengths are in Å, and bond angles are in degrees.
Figure 5. Potential energy diagram for reaction paths 1a and 1b
based on energies calculated with CCSD(T)/6-311+G(3df,2p)// B3LYP/6-311+G(3df,2p) and CCSD(T)/6-311+G(3df,2p)//CCSD(T)/ 6-311+G(d,p) (listed in parentheses). Listed energies are in kcal mol-1.
ground state. Calculated rate coefficients indicate that, at tem-peratures below 3000 K, contributions from the reaction channel via TS3 are small, as is discussed in the next section.
The transition state TS4 for reaction path 1b producing H + ClO is predicted to have a linear structure and3A′′symmetry (Figure 4); both the G2M(CC2) and CCSD(T)/6-311++G-(3df,2p) calculations predict a barrier height of∼53 kcal mol-1 for this path. This reaction path is therefore unimportant kinetically, as mentioned previously.
4.4. Calculation of Rate Coefficients. Rate coefficients of
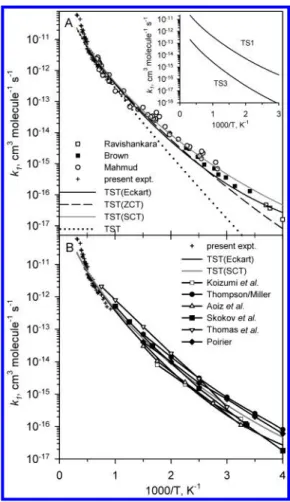
the reaction O + HCl, calculated for the lowest two reaction channels producing OH + Cl via TS1 and TS3 on the basis of the energies predicted at the CCSD(T)/6-311+G(3df,2p) level using the molecular parameters computed by CCSD(T)/ 6-311+G(d,p), are illustrated in Figure 7. Fitting results of calculated rate coefficients from 200 to 3200 K to an analytical form similar to eq 17 yield
in which ZCT and SCT represent zero- and small-curvature tunneling corrections, respectively. In Figure 7A, we compare the total rate coefficients for the formation of OH + Cl calculated by conventional TST, TST with Eckart-tunneling corrections,42and variational TST including corrections for zero-and small-curvature tunnelings43with the existing experimental data of Ravishankara et al.,1Brown and Smith,6 Mahmud et al.11 and the present work. Results from these three model calculations, although different to some extent at lower tem-peratures, all agree satisfactorily with experimental values. Overall, the variational TST calculation with zero- or small-curvature tunneling corrections appears to account for experi-mental data above room temperature slightly better. In the inset of Figure 7A, contributions from the two low-energy channels are compared. The major contribution stems from the channel involving TS1 with the smallest barrier, 9.63 kcal mol-1. It should be mentioned that similar calculations with the energies predicted by the G2M method based on the molecular param-eters computed at the B3LYP/6-311+G(3df,2p) level under-estimated the rate constant at lower temperatures (by about 40% at room temperature) primarily because of the much lower imaginary frequency (946 cm-1) and thus the effect of tunneling corrections (see Figure 6).
In Figure 7B, we compare our predicted results with those from previous theoretical calculations by Koizumi et al.,13 Thompson and Miller,21,22Aoiz et al.,26Skokov et al.,17Allison et al.,15and Poirier.25Koizumi et al.13derived the KSG PES by fitting the MP2/6-31G(d,p) results; they obtained the thermal rate constant from quantum scattering calculations. On the basis of this PES, Thompson and Miller21,22calculated the thermal rate constant from the time integral of the flux-flux auto-correlation function. Aoiz et al.26 calculated the quantum mechanical (QM) and quasi-classical trajectory(QCT) rate constants, and Poirier25 applied the helicity-conserving and
J-shifting approximations to carry out the thermal rate calcula-tions. Furthermore, Ramachandran et al.25constructed the S1, S1A, S2, and S4 potential energy surfaces, which were a series of fits to scaled ab inito data, and Allison et al.15applied these potential energy surfaces to calculate the thermal rate constant by variational TST. Recently, Skokov et al.17employed the S4 potential energy surface and calculated the thermal rate constants by QCT, TST, and variational TST with the improved canonical
kTST(Eckart)) (3.60 ( 0.08)10-23× T3.48(0.14exp[-(1390 ( 90)/T] cm3molecule-1s-1 (18) kTST(ZCT)) (3.56 ( 0.04)10-19× T2.35(0.06exp[-(2430 ( 40)/T] cm3molecule-1s-1 (19) kTST(SCT)) (1.66 ( 0.02)10-21× T2.99(0.08exp[-(1550 ( 50)/T] cm3molecule-1s-1 (20) kTST) (2.36 ( 0.01)10-15× T1.30(0.01exp[-(4160 ( 50)/T] cm3molecule-1s-1 (21)
Figure 6. Imaginary vibrational wavenumbers and associated
displace-ment vectors of transition states based on B3LYP/6-311+G(3df,2p) and CCSD(T)/6-311+G(d,p) (in parentheses).
Figure 7. (A) Comparison of predicted rate coefficient k1(solid line: conventional TST calculations including Eckart-tunneling corrections; dashed line: Polyrate program of Truhlar with zero-curvature tunneling corrections; gray line: Polyrate program with small-curvature tunneling corrections; dotted line: conventional TST calculations) with experi-mental data (0: Ravishankara et al.,5
9: Brown and Smith,6,7 O: Mahmud et al.,11+: this work); results from two different reaction
channels are shown in the inset. (B) Comparison of theoretical results in this work with those reported previously by Koizumi et al.,13
Thompson and Miller,21,22Aoiz et al.,26Skokov et al.,17Allison et al.,15
variational theory (ICVT). As a result, for T < 1000 K, quantum mechanical calculations17,21,26with the J-shifting approximation (QM/JS)56based on either the KSG or the S4 PES appear to agree with experimental data better than quasi-classical trajectory results.17,26A similar observation was reported by Aoiz et al.26
5. Conclusions
Rate coefficients of the reaction O(3P) + HCl in the temperature range 1093-3197 K were determined using a diaphragmless shock tube with atomic resonance absorption detection of O atoms. Our results are consistent with previous measurements with T < 1486 K but show a steep increase in the rate coefficients for T > 2000 K. Rate coefficients fit well with the equation k1(T) ) (9.27 ( 0.03)× 10-24T3.67(0.18 exp[-(1030 ( 160)/T] cm3molecule-1s-1, in which the listed errors represent one standard deviation. Theoretical calculations indicate that the reaction path leading to the formation of H + ClO is unimportant and that two channels lead to the formation of OH + Cl; the major contribution stems from the channel involving TS1 with the smallest barrier, 9.63 kcal mol-1. Calculated rate coefficients fit well with experimental observa-tions throughout the temperature range of investigation.
Acknowledgment. We thank Professors H. Matsui and A.
Tezaki for providing the driver of the shock tube and for helping us to set up the shock-tube system and Professor D. Truhlar for the use of the Polyrate program. Y.-P.L. thanks the National Science Council of Taiwan (grant nos. NSC89-2119-M-007-001 and NSC89-2113-M-009-010) for support. M.C.L. thanks the Office of Naval Research, US Navy (contract no. N00014-89-J1949) for support and the National Science Council of Taiwan for the distinguished visiting professorship.
References and Notes
(1) Ravishankara, A. R.; Smith, G.; Watson, R. T.; Davis, D. D. J.
Phys. Chem. 1977, 81, 2220.
(2) Brill, T. B.; Budenz, B. T. In Solid Propellant Chemistry,
Combustion, and Motor Interior Ballistics; Yang, V., Brill, T. B., Ren,
W.-Z., Eds.; Progress in Astronautics and Aeronautics; American Institute of Aeronautics and Astronautics: Reston, VA, 2001; Vol. 185, p 3.
(3) Karra, S. B.; Senkan, S. M. Combust. Sci. Technol. 1987, 54, 333. (4) Chang, W. D.; Karra, S. B.; Senkan, S. M. Combust. Flame 1987,
69, 113.
(5) Ravishankara, A. R.; Smith, G.; Watson, R. T.; Davis, D. D. J.
Phys. Chem. 1977, 81, 2220.
(6) Brown, R. D. H.; Smith, I. W. M. Int. J. Chem. Kinet. 1975, 7, 301. (7) Brown, R. D. H.; Smith, I. W. M. Int. J. Chem. Kinet. 1978, 10, 1. (8) Singleton, D. L.; Cvetanovic, R. J. Int. J. Chem. Kinet. 1981, 13, 945. (9) Hack, W.; Mex, G.; Wagner, H. Gg. Ber. Bunsen-Ges. Phys. Chem. 1977, 81, 677.
(10) Park, C. J. Phys. Chem. 1977, 81, 49.
(11) Mahmud, K.; Kim, J.-S.; Fontijn, A. J. Phys. Chem. 1990, 94, 2994. (12) Gordon, M. S.; Baldridge, K. K.; Bernhold, D. E.; Bartlett, R. J.
Chem. Phys. Lett. 1989, 158, 189.
(13) Koizumi, H.; Schatz, G. C.; Gordon, M. S. J. Chem. Phys. 1991,
95, 6421.
(14) Ramachandran, B.; Senekowitsch, J.; Wyatt, R. E. Chem. Phys.
Lett. 1997, 270, 387.
(15) Allison, T. C.; Ramachandran, B.; Senekowitsch, J.; Truhlar, D. G.; Wyatt, R. E. J. Mol. Struct.: THEOCHEM 1998, 454, 307.
(16) Ramachandran, B.; Schrader, E. A., III; Senekowitsch, J.; Wyatt, R. E. J. Chem. Phys. 1999, 111, 3862.
(17) Skokov, S.; Zou, S.; Bowman, J. M.; Allison, T. C.; Truhlar, D. G.; Lin, Y.; Ramachandran, B.; Garrett, B. C.; Lynch, B. J. J. Phys. Chem.
A 2001, 105, 2298.
(18) Peterson, K. A.; Ramachandran, B. To be submitted for publication. (19) Peterson, K. A.; Skokov, S.; Bowman, J. M. J. Chem. Phys. 1999,
111, 7446.
(20) Skokov, S.; Peterson, K. A.; Bowman, J. M. J. Chem. Phys. 1998,
109, 2662.
(21) Thompson, W. H.; Miller, W. H. J. Chem. Phys. 1997, 106, 142. (22) Thompson, W. H.; Miller, W. H. J. Chem. Phys. 1997, 107, 2164. (23) Tolstikhin, O. I.; Nakamura, H. J. Chem. Phys. 1998, 108, 8899. (24) Nobusada, K.; Nakamura, H. J. Phys. Chem. A 1999, 103, 6715. (25) Poirier, B. J. Chem. Phys. 1998, 108, 5216.
(26) Aoiz, F. J.; Banˇares, L.; Castillo, J. F.; Mene´ndez, M.; Verdasco, J. E. Phys. Chem. Chem. Phys. 1999, 1, 1149.
(27) Wang, L.; Kalyanaraman, C.; McCoy, A. B. J. Chem. Phys. 1999,
110, 11221.
(28) Matzkies, F.; Manthe, U. J. Chem. Phys. 1999, 110, 88. (29) Matzkies, F.; Manthe, U. J. Chem. Phys. 2000, 112, 130. (30) Skokov, S.; Tsuchida, T.; Nanbu, S.; Bowman, J. M.; Gray, S. K.
J. Chem. Phys. 2000, 113, 227.
(31) Ramachandran, B. J. Chem. Phys. 2000, 112, 3680.
(32) Koshi, M.; Yoshimura, M.; Fukuda, K.; Matsui, H.; Saito, K.; Watanabe, M.; Imamura, A.; Chen, C. J. Chem. Phys. 1990, 93, 8703.
(33) Greene, E. F.; Toennies, J. P. Chemical Reactions in Shock WaVes; Academic Press: New York, 1964.
(34) Michael, J. V. J. Chem. Phys. 1989, 90, 189.
(35) Michael, J. V.; Sutherland, J. W. Int. J. Chem. Kinet. 1986, 18, 409. (36) Tsuchiya, K.; Yokoyama, K.; Matsui, H.; Oya, M.; Dupre, G. J.
Phys. Chem. 1994, 98, 8419.
(37) Becke, A. D. J. Chem. Phys. 1993, 98, 5648. Becke, A. D. J. Chem.
Phys. 1992, 96, 2155. Becke, A. D. J. Chem. Phys. 1992, 97, 9173.
(38) Lee, C.; Yang, W.; Parr, R. G. Phys. ReV. B 1988, 37, 785. (39) Mebel, A. M.; Morokuma, K.; Lin, M. C. J. Chem. Phys. 1995,
103, 7414.
(40) Frisch, M. J.; Trucks, G. W.; Schlegel, H. B.; Scuseria, G. E.; Robb, M. A.; Cheeseman, J. R.; Zakrzewski, V. G.; Montgomery, J. A., Jr.; Stratmann, R. E.; Burant, J. C.; Dapprich, S.; Millam, J. M.; Daniels, A. D.; Kudin, K. N.; Strain, M. C.; Farkas, O.; Tomasi, J.; Barone, V.; Cossi, M.; Cammi, R.; Mennucci, B.; Pomelli, C.; Adamo, C.; Clifford, S.; Ochterski, J.; Petersson, G. A.; Ayala, P. Y.; Cui, Q.; Morokuma, K.; Malick, D. K.; Rabuck, A. D.; Raghavachari, K.; Foresman, J. B.; Cioslowski, J.; Ortiz, J. V.; Stefanov, B. B.; Liu, G.; Liashenko, A.; Piskorz, P.; Komaromi, I.; Gomperts, R.; Martin, R. L.; Fox, D. J.; Keith, T.; Al-Laham, M. A.; Peng, C. Y.; Nanayakkara, A.; Gonzalez, C.; Challacombe, M.; Gill, P. M. W.; Johnson, B. G.; Chen, W.; Wong, M. W.; Andres, J. L.; Head-Gordon, M.; Replogle, E. S.; Pople, J. A. Gaussian 98, revision A.1; Gaussian, Inc.: Pittsburgh, PA, 1998.
(41) MOLPRO is a package of ab initio programs written by Werner, H.-J.; Knowles, P. J. with contributions from Almlo¨f, J.; Amos, R. D.; Berning, A.; Cooper, D. L.; Deegan, M. J. O.; Dobbyn, A. J.; Eckert, F.; Elbert, S. T.; Hampel, C.; Lindh, R.; Lloyd, A. W.; Meyer, W.; Nicklass, A.; Peterson, K.; Pitzer, R.; St., A. J.
(42) Tokmakov, I. V.; Park, J.; Gheyas, S.; Lin, M. C. J. Phys. Chem.
A 1999, 103, 3636.
(43) Corchado, J. C.; Chuang, Y.-Y.; Fast, P. L.; Villa, J.; Hu, W.-P.; Liu, Y.-P.; Lynch, G. C.; Ngyuen, K. A.; Jackels, C. F.; Melissas, V. S.; Lynch, B. J.; Rossi, I.; Elena, L.; Coitino, E. L.; Fernandze-Ramos, A.; Pu, J.; Steckler, R.; Garrett, B. C.; Isaacson, A. D.; Truhlar, D. G. Polyrate, version 8.7; University of Minnesota: Minneapolis, MN, 2001.
(44) Malick, D. K.; Petersson, G. A.; Montgomery, J. A., Jr. J. Chem.
Phys. 1998, 108, 5704.
(45) Ross, S. K.; Sutherland, J. W.; Kuo, S.-C.; Klemm, R. B. J. Phys.
Chem. A 1997, 101, 1104.
(46) Manatt, S. L.; Lane, A. L. J. Quant. Spectrosc. Radiat. Transfer 1993, 50, 267.
(47) Smith, O. I.; Tseregounis, S.; Wang, S.-N. Int. J. Chem. Kinet. 1982, 14, 679.
(48) Singleton, D. L.; Cvetanovic, R. J. J. Phys. Chem. Ref. Data 1988,
17, 1377.
(49) Grillo, A.; Reed, R.; Slack, M. W. J. Chem. Phys. 1979, 70, 1634. (50) Baulch, D. L.; Cobos, C. J.; Cox, R. A.; Esser, C.; Frank, P.; Just, T.; Kerr, J. A.; Pilling, M. J.; Troe, J.; Walker, R. W.; Warnatz, J. J. Phys.
Chem. Ref. Data 1992, 21, 411.
(51) Yang, H.; Gardiner, W. C.; Shin, K. S.; Fujii, N. Chem. Phys. Lett. 1994, 231, 449.
(52) FACSIMILE is computer software for modeling process and chemical reaction kinetics released by AEA Technology, Oxfordshire, U.K. (53) Fontijn, A.; Goumri, A.; Fernandez, A.; Anderson, W. R.; Meagher, N. E. J. Phys. Chem. A 2000, 104, 6003.
(54) Meagher, N. E.; Anderson, W. R. J. Phys. Chem. A 2000, 104, 6013. (55) Gonzalez, C.; Schlegel, H. B. J. Chem. Phys. 1989, 90, 2154. (56) Bowman, J. M. J. Phys. Chem. 1991, 95, 4960.
(57) Chase, M. W., Jr.; Davies, C. A., Jr.; Downey, J. R.; Frurip, D. J.; McDonald, A. A.; Syverud, A. N. J. Phys. Chem. Ref. Data 1985, 14, Supplement 1.
(58) Ruscic, B.; Feller, D.; Dixon, D. A.; Peterson, K. A.; Harding, L. B.; Asher, R. L.; Wagner, A. F. J. Phys. Chem A 2001, 105, 1.
![Figure 2. Calibration curve of [O] versus absorbance of O atoms.](https://thumb-ap.123doks.com/thumbv2/9libinfo/7619210.131444/3.918.134.389.69.407/figure-calibration-curve-of-versus-absorbance-of-atoms.webp)