國立交通大學
運輸科技與管理學系
博士論文
鐵路司機員對工作壓力之感認及
持續駕駛對事故風險影響之研究
Exploring the Perception of Job Stress and the Effect of Consecutive
Driving on Accident Risk for Train Drivers
研 究 生:朱來順
指導教授:張新立 教授
鐵路司機員對工作壓力之感認及持續駕駛對事故風
險影響之研究
Exploring the Perception of Job Stress and the Effect of Consecutive
Driving on Accident Risk for Train Drivers
研 究 生:朱來順 Student:Lai-Shun Ju
指導教授:張新立 Advisor:Hsin-Li Chang
國 立 交 通 大 學
運 輸 科 技 與 管 理 學 系
博 士 論 文
A DissertationSubmitted to Department of Transportation Technology and Management College of Management
National Chiao Tung University in partial Fulfillment of the Requirements
for the Degree of
DOCTOR OF PHILOSOPHY
In
Transportation Technology and Management By
Lai-Shun Ju
Hsinchu, Taiwan, Republic of China
鐵路司機員對工作壓力之感認及持續駕駛對事故風險影響
之研究
研究生:朱來順 指導教授:張新立博士
國立交通大學運輸科技與管理學系
摘要
本研究主要是探討鐵路司機員在駕駛中面臨的不同壓力源時,對這些壓力源的難易 度的感認,及持續駕駛對事故風險影響的研究。 本研究第一部份是發展一套鐵路司機員面臨不同壓力源的量表,再經過模式的分 析,而量測出司機員對不同壓力源感受不同難度順序。研究程序是收集鐵路司機員不同 的壓力源,經由與鐵路員工進行焦點團體法的討論及鐵路專家質與量的分析,產生本研 究的問卷即是司機員覺得較難克服的壓力源,再將此問卷對台鐵局的司機員進行普查, 將回收資料進行檢定後,再利用Rasch 模式進行分析,經信、效度檢定,而得到司機員 面臨駕駛中不同壓力源時,感受的不同難度。從本研究中,發現台鐵司機員覺得外在環 境的壓力源最難克服,本研究也提供了減輕司機員壓力的策略,協助鐵路安全的管理。 第二部份是檢視駕駛時間與司機員責任事故的關係,進而分析持續駕駛與事故風險 的關係。首先收集1996 到 2006 年司機員駕駛時間及責任事故的資料,然後分別算出客車及貨車不同時段的事故率。本研究結果發現不論客車或貨車,事故風險隨著時駕駛時 間的增加而增加,且駕駛時間在4 小時後,其事故率為開始駕駛第 1 小時的 2 倍,且發 現貨物列車有額外的事故風險,可能的原因是第1 小時貨車在調車場從事調車工作,因 調車場路線配置較複雜且僅是半自動聯鎖控制,所以較容易發生事故。從研究中也發 現,火車駕駛比公路駕駛的事故風險隨著駕駛時間的增加上升較快,可能原因為火車駕 駛的工作壓力較大且較單調的駕駛環境所致。為了降低人為的事故風險,建議採取加強 安全設備及司機員訓練和建立嚴謹的稽核制度。 關鍵詞:壓力源、曝光量、事故率、持續駕駛、鐵路安全、Rasch 模式
Exploring the Perception of Job Stress and the Effect of Consecutive
Driving on Accident Risk for Train Drivers
Student: Lai-Shun Ju Advisor: Dr. Hsin-Li Chang
Department of Transportation Technology and Management
National Chiao Tung University
ABSTRACT
This study explores the difficulties of various stressors for train drivers, as well as to identify the relationship between hours of consecutive driving and train accident risk.
The first step was to develop an approach to measure the difficulties of various stressors for train drivers. Through focus group discussions and experts’ judgments, a questionnaire was designed to explore the stressors confronted by train drivers while driving. A census survey was used to collect responses of train drivers from the Taiwan Railway Administration (TRA), and the Rasch model, which can estimate values on an interval scale from ordinal responses, was then applied to explore the perceived difficulties of various stressors to be confronted while driving. The study results showed that most of the critical stressors come from the external driving environment. The study results provide valuable information about the stressors confronted by train drivers, and provide consultation assistance on railway safety management.
The second part of the study examined the relationship between driver responsible accidents and on-board driving hours to determine the effect of consecutive driving hours on accident risk. The data collected from the Taiwan Railway Administration for the period 1996-2006 was used to compute accident rates for varied accumulated driving hours for passenger and freight trains. The results showed that accident risk grew with increased consecutive driving hours for both passenger and freight trains, and doubled that of the first hour after four consecutive hours of driving. Additional accident risk was found for freight trains during the first hour due to required shunting in the marshalling yards where there are complex track layouts and semi-automatic traffic controls. Also, accident risk for train driving increased more quickly over consecutive driving hours than for automobile driving, and accumulated fatigue caused by high working pressure and monotony of the working environment are considered to be part of the reason. To prevent human error accidents, enhancing safety equipment, driver training programs, and establishing a sound auditing system are suggested and discussed.
Key words: Stressor, Exposure, Accident Rate, Consecutive Driving, Railway Safety, Rasch Model
誌 謝
感謝恩師張新立教授不厭其煩的指導,沒有張老師的辛苦的付出,就沒有今天的成 果。在這段與老師的相處時間下,才讓我領略到老師治學的嚴謹與其個人專業的淵博, 雖然過程中常受到老師嚴厲的指導,但是我知道這些都是為了增加我們的功力,所以回 想起來,心中便有無限的感謝,謝謝您老師。 感謝論文計畫書審查委員卓訓榮教授、任維廉教授的指正,使得論文內容更豐富; 更感謝博士學位口試委員陳武正院長、蔡明志教授、卓訓榮教授、任維廉教授的寶貴意 見,讓論文結構更臻完善。 在修課期間卓訓榮教授的智慧型運輸系統、許巧鶯教授的運輸系統分析、任維廉教 授的運輸組織與管理、高凱教授的運輸經濟學、張新立教授的運輸需求、高等統計學、 運輸安全與軌道運輸概論、謝尚行教授的最適化理論,讓我在交通運輸與管理領域獲益 匪淺,在此也致上最高敬意。 論文撰寫過程中,才充分瞭解團隊的力量大的道理。成功大學的鄭永祥老師,給我 相當大的幫助,雖然常去請益,但鄭老師依然不厭其煩的教導,還有運輸研究所的葉祖 宏博士,也是因為他傾全力幫助,才讓我文章建立起基本的架構,進而指導如何寫作, 然後又在投稿上不斷的給我幫助,而吳舜丞博士教導我操作模式,解決相關統計的問 題,更隨時提供我各種諮詢,還有張馨文博士從學校一起參加meeting 且互相鼓勵,又 介紹Richard 幫助我修改英文,且在論文的寫作上給我相當大的幫忙,這些人都是我的 貴人。也要感謝晉光、忠漢、昌谷、東石等博士班同學以及SONY LAB 學弟妹們的鼎 力相助。所以可以說此篇文章是SONY LAB 的集體創造。 還要感謝鐵路局的長官允許我能在職進修,及同仁幫助我能夠盡力在學業上努力。 最後,要感謝家人的支持,尤其老婆靜圓能替我照顧家裡,讓我心無旁鶩的讀書。謹將 此論文獻給所有幫助我的人,告訴您們我沒有讓您們失望。 朱來順 謹誌 2008 年 12 月 31 日Contents
Abstract (Chinese) i
Abstract (English) iii
Acknowledgement v Contents vi List of Tables ix List of Figures X CHAPTER 1 INTRODUCTION 1 1.1 Research motivation 1 1.2 Research objectives 4 1.3 Overview of thesis 6
CHAPTER 2 LITERATURE REVIEW 9
2.1 Human factor for railway safety 9
2.2 Human factors research for train drivers 10
2.3 The major factors affecting accident risk by train drivers 12
2.3.1 Stress and railway safety 13
2.3.2 Consecutive driving and railway safety 19
CHAPTER 3 RESEARCH METHODOLOGY 23
3.1 The train driver’s stressors 23
3.2.1 Review of item response theory 24
3.2.2 Introduction of Rasch model 27
3.2.3 Parameter estimation of Rasch model 32
3.2.4 Reliability and validity statistics in the Rasch model 34
3.3 Accident rates for different timeslots consecutive train driving hours 35
3.3.1 Exposure data collection 35
3.2.2 Collection driver responsible accidents 38
3.2.3 Finding accident rates for different time slots of consecutive train driving hours
38
CHAPTER 4 EMPRIRICAL STUDY OF THE STRESSORS FOR TRAIN DRIVERS
40
4.1 Questionnaire design 40
4.2 Data collection 43
4.3 Application of Rasch analysis 45
4.4 Findings and interpretation 48
4.5 Discussion 50
CHAPTER 5 EMPIRICAL STUDY FOR THE EFFECTOF CONSECUTIVE DRIVING ON ACCIDENT RISK FOR TRAIN DRIVERS
54
5.1 The operations and work shift regulations of the TRA 54
5.2 Data collection 55
5.2.2 Driving exposure to the risk of accident 56
5.3 Accident rates for different time slots of consecutive train driving hours 58
5.4 Modeling the accident risk for consecutive driving 61
5.5 Discussion 66
5.5.1 Accelerating accident risk of train driving compared with truck driving 66
5.5.2 The early peak of accident risk for freight train driving 68
CHAPTER 6 CONCLUSIONS AND RECOMMENDATIONS 71
6.1 Conclusions 71
6.1.1 Exploring perceptions of stressors confronted by train drivers 71
6.1.2 Identifying the relationship between consecutive driving and train accident rates 73 6.2 Suggestions 74 6.3 Future research 77 6.4 Research Contributions 78 REFERENCES 81 VITA 88
List of Tables
Table 2-1 Stressors that influence driving safety 16 Table 3-1 Working items for different types of driver work shift pattern 38 Table 4-1 Content of the questionnaire for driver stressor 42 Table 4-2 The data analysis of survey 44 Table 4-3 Model estimation and fit statistics obtained from Rasch analysis 46 Table 4-4 Estimates of item measures and fit statistics from Rasch analysis 49 Table 5-1 Accident rates and relevant statistics for different types of regression
models
63
List of Figures
Figure 1-1 The flow chart of research 8 Figure 2-1 Three stages of one driver’s work shift under TRA operation 21 Figure 5-1 Passenger and freight train driving exposure for different consecutive
driving hours
57
Figure 5-2 The accident rate over consecutive driving hours for train driving 60 Figure5-3 The estimated accident rate model over consecutive driving hours for
passenger and freight train driving
CHAPTER 1 INTRODUCTION
Train driving is a job that entails many demands and responsibilities. A train driver is
responsible for both the safety and punctuality of train operations; a job that requires a high
level of concentration and alertness to react to oncoming signals, information, switches, and
the immediate environment (Kecklund et al., 1999). Train driving relies heavily on numerous
cognitive functions, including sustained attention, object detection and recognition, memory,
planning, decision-making, and workload management (Reinach and Raslear, 2001).
Although driving the train on an exclusive track, a train driver is required to maintain a high
degree of vigilance, often over a prolonged period of time, while responding to stimuli
throughout the entire journey. Interpreting signs is a constant requirement in order to
recognize malfunctions, conflicts, or the need for clarification. Moreover, because of the low
coefficient of friction between wheels and rails, and also the delay in braking response, trains
cannot stop quickly when encountering obstacles or dangerous signs. An error in any area
may have serious consequences for the safety of passengers and train crews. Given this,
reducing possible errors of train drivers is an urgent topic for railway safety.
Train drivers are exposed to a demanding psychosocial working environment, which
includes solitary work, limited opportunities for socializing with colleagues, and a heavy
responsibility for operation of the train. Those factors give rise to an enormous workload and
restrict a driver’s ability to decide how the job should be done. Hence, train drivers have a
high risk of accidents and driver error. The empirical data shows that driver-responsible
accidents made up 31 % of the total from 1996 to 2004. Those accidents were determined by
the Accident Investigation Prevention Committee of the Taiwan Railway Administration
(TRA) to be caused by driver error. Similarly, train driver-error accidents totaled 38% of all
accidents that occurred during the period of 1970-1998 in Norway (Jernbaneverket, 1999).
The extremely serious problem of driver error should not only be noticed but also explored for
possible causes.
The relevant research on driver error is categorized as a field of driver human-factors
analysis. There is still a dearth of human factors studies in the train driver sector, particularly
in comparison with research on safety used in aviation, road transportation, and process
industries. There is a great need to perform more scientific studies of human factors for
railway safety (Kecklund et. al., 2001; Wilson, 2006). According to previous human factor
studies of train drivers, there are many factors that cause train driver error. Those include
al., 1981); fatigue (Beruskens, 2000; Kristal-Boneh, 1996); stress (Gaillard, 1993);
consecutive driving (Gouin et al, 2001) and mental workload (Meijman, 1997). Moreover,
Kecklund et al. (1999) studied eighty accident reports from the period 1980-1997 in Sweden
and found that in about one-third of the accidents stress and fatigue seem to have been
contributing factors. These finding are consistent with other previous studies that found stress
and fatigue to be important traffic accidents risk factor (e.g., Connor et al., 2002, Hanowski et
al., 2003; Helmereich et al., 1990; Horne and Reyner, 1995; Hudoklin, 1996, Philip et al.,
2001). But fatigue have direct relation with the consecutive driving, driving behavior is
exemplified as information management (Shinar, 1978), driving and working for a sustained
period of time can generate fatigue (Okogbaa et al., 1994; Smiley, 1998; Sussman and Coplen,
2000) so drivers would not be able to maintain the level of driving safety under conditions of
continuous driving (Dinges, 1995; Horne and Reyner, 1995).
Efficient railway management needs to find train drivers’ stressors and ways to reduce
them, as well as fatigue happen. Hence, this study will try to identify the critical human
factors associated with various stressors for train driver during driving, and identify the
relationship between consecutive driving and train accident risk. Then, suggestions will be
offered to reduce stress and to arrange reasonable working shift in order to increase railway
1.2 Research Objectives
A railway traffic system is a complex man-machine system. Human unreliability can
seriously affect system functioning; therefore, an investigation of possible human errors in the
system is worthwhile. This study develops an effective approach to exploring drivers’ job
stressors, and explores the relationship between hours of consecutive driving and accident
risk.
The first purpose of this study was to develop an approach to measure various train
drivers’ job stressors difficulty for safe driving. Variables can be ‘manifest’ or ‘latent’.
Manifest variables can be observed and measured publicly. Most physical variables (e.g.,
length, weight, force, etc.) are manifest. Latent variables, on the other hand, are inferred from
judgments. Most psychological variables are latent; they are inferred from subjects’ reports or
observer judgments of subjects’ behavior. The job stressors in this study are all latent
variables, which are inferred subjective judgments by the respondents. This study will first
identify possible train driver job stressors, and then develop an approach to measure the
different difficulties of various stressors for train drivers. Based on the findings of the study,
various problem areas serving as job stressors for train drivers will be understood. It offers
consultative assistance regarding railway safety management. The results will also provide
guidance in how to distribute limit resources in accordance with the different conditions. The
optimal benefit of safety policy is suggested.
This study’s other purpose is to explore the effect of consecutive driving on accident
risk, as well as to examine the difference in accident rates over time between passenger and
freight train driving. This helps to identify the relationship between consecutive driving and
accident risk for train drivers. Since, different work requirements exist between passenger and
freight train driving, the results may also reveal some important insights regarding accident
risk in these two areas. For example, freight train drivers usually have irregular work
schedules, boredom during operations (Sussman and Coplen, 2000), and a higher proportion
of night operation problems (Jackson, 2005). Hence, passenger and freight train accident risks
were analyzed separately. In undertaking a study of this type, exposure should be
operationally defined and data collected. In the context of this type of study, Chapman (1973)
defined the concept of exposure as the amount of opportunity to be involved in an accident
that a driver or traffic system experienced. The purpose of using exposure as an independent
variable is to equalize differences in “intensity of use” so as to make reasonable safety
comparisons between different entities or time periods. Then, the accidents caused by train
variable. Based on the collected data, accident rates for each time slot could be measured by
dividing the number of accidents that occurred in one time slot by its exposure, indicating the
accident risk for each time slot. The results of the study will be beneficial in making decisions
regarding what constitutes a reasonable and safe working shift, as well as contributing to
suggestions regarding strategies to improve railway safety.
1.3 Overview of thesis
This thesis contains six chapters, which are organized as follows. Chapter 1 introduces
our research motivations, objectives, and contributions. Chapter 2 presents the results of a
literature review on previous human factors analyses of train drivers, the relationship between
human factors and railway accidents, the relationship between stress and railway safety, and
examines consecutive driving as a contributing risk factor in train accidents. Chapter 3
illustrates our methodology to explore perceived stressors for train drivers and calculates
accident risk of driving in different time slots. Chapter 4 empirical study demonstrates the
different difficulties of various stressors’ during train driving. And, we discuss our findings
and draw conclusions. Chapter 5 empirical study demonstrates the accident rates for different
numbers of hours of consecutive driving of passenger and freight trains. And, we discuss our
regarding strategies to improve railway safety and propose suggestions for future study. A
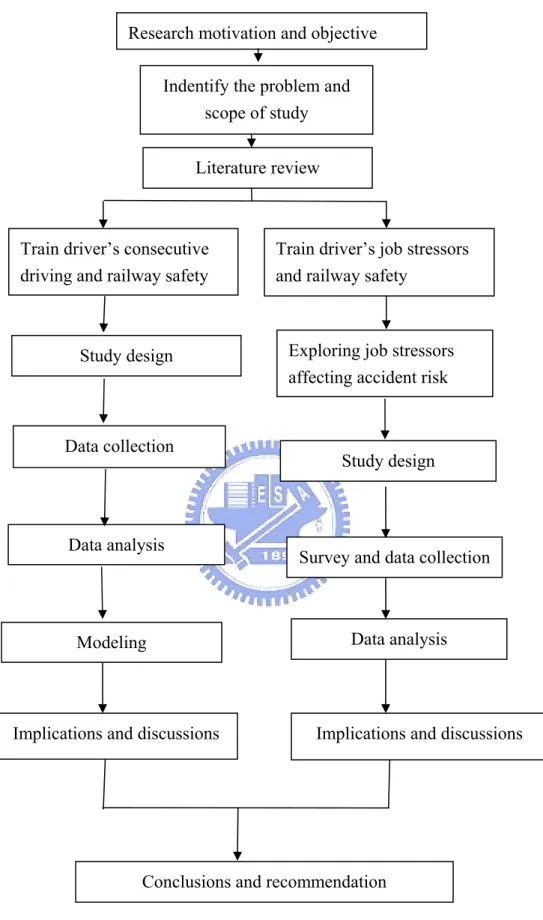
Research motivation and objective
Indentify the problem and scope of study
Literature review
Train driver’s consecutive driving and railway safety
Train driver’s job stressors and railway safety
Exploring job stressors affecting accident risk Study design
Data collection
Study design
Survey and data collection
Data analysis
Implications and discussions
Conclusions and recommendation
Fig. 1-1 The flow chart of research Data analysis
Modeling
CHAPTER 2 LITERATURE REVIEW
2.1 Human factor for railway safety
In every country with a rail network of any importance, the relevant operational,
regulatory, and government bodies are trying to achieve something similar. This is, to move
more people and goods, on time and safely, to satisfaction of their customers. Rail human
factors is not limited in its contribution in terms of providing dimensional and performance
information for design of equipment, interfaces, and workspaces (e.g., train cab design),
working environments (e.g., signal boxes), minimization of risk from manual handling (e.g.,
track working), and design of information display systems (e.g., lineside signage or train
movement displays). Rail human factors is increasingly working at a systems level, being
central to systems engineering. The drive behind this comes from contributions such as better
understanding of organizational failure in accidents (Reason, 1997), acceptance that cognitive
task performance is situated in a setting that it strongly influences (Nardi, 1993), and is spread
across people, places, and time (Hutchins, 1995).
Elms’ (2001) research certified that 1/3 of railway accidents and personnel casualties are
to 90% of accidents are caused by human factors, and the most important factor in railway
operation safety is human reliability (Dickens, 1992). The focus of rail human factors research
includes signalers and controllers; drivers; station and on-train staff; planners, engineers, and
managers; track (maintenance) workers; passengers and the general public. However, the
drivers are in a critical role for railway safety.
Treat’s (1977) study stated that more than 90% of human factor-related accidents are
related to drivers, which is also the leading cause of accidents. Ugajin (1999) investigated the
total number of railway accidents that occurred in Japan in 1997 and found that 40% of these
accidents were due to human factors on the part of drivers. According to Hall (1997), driver
errors accounted for approximately 46% (N = 18) of the registered accidents during period
1970-1997 in the U.K. During the period 1970-1998 in Norway, train drivers error accidents
accounted for 38% of all accidents that occurred (Jernbaneverket, 1999). In addition, driver
responsible accidents made up 31% of the total accidents in Taiwan Railway Administration
(TRA, 2006). It is our crucial on-going mission to keep accidents like these caused by human
factors of train drivers from occurring, and to contribute to establishing methods for
preventing them.
The current research addresses the fundamental elements of the train driver’s role and
performance, including route knowledge and the underlying psychological components of
train driving (Farring-Darby et al., 2005; Jansson et al., 2006; McLeod et al., 2005). Much
research in this area has investigated the potential causes of human error (Reason et al., 1994)
and the extent to which the in-cab environment supports the driver’s ability to maintain
situational awareness (Endsley et al., 2003). A part of reducing the potential for driver error
and increasing effective (on-time) performance lies in the design of jobs and job aids
(Kecklund et al., 2001) as well as understanding and optimizing – neither too high nor too
low–workloads.
There has been, in particular, a broad and relatively well-studied research field in the
area of train driver vigilance and perception, in terms of their recognition of and acting upon
signs and signals. This includes investigations into signals passed at danger (SPAD) and the
appropriate design of signage and signaling systems. Recently in the UK, motivated by the
Ladbroke Grove rail crash and by reports of incidents not leading to injury, there have been
various studies of SPADs (Pasquini et al., 2004; Turner et al., 2003), predictive tools (Wright
et al., 2007), and development of tools to identify the risk of SPADs at different signals
such incidents, there has been related research into the use of vigilance devices and reminder
appliances (McLeod et al., 2005; Whitlock et al., 2005). Modern observation techniques, such
as the measurement of eye movements and of direction of gaze, allow interpretation of
drivers’ behavior and of the possible reasons for it (Luke, 2006; Merat et al., 2002).
One use of eye tracking is as a technique to investigate the onset, manifestation, and
consequences of fatigue (e.g., dwell or fixation times will become longer as people get
fatigued). Studies have also examined the prevalence of sleep apnea (Hack et al., 2007).
Research related to fatigue has also examined the effects of driver work shift (Hawarth and
Tapas, 2001), used observation and self-report to study the effects of long (>6 h) journey
times (Gouin et al., 2001), run simulator studies (Dorrian et al., 2005), and developed
checklist tools such as the Fatigue Index (Cotterill and Jones, 2005), as well as prototypical
preferred roster patterns (Ashton and Fowler, 2005). Related to impairment through fatigue is
the incidence and effects of drugs and alcohol use on performance (Ervasti et al., 2007).
2.3 The major factors affecting accident risk by train drivers
Prolonged attention is the most significant factor influencing the occurrence of accidents
that result in the reduction of prolonged attention are fatigue, noise (Hancock, 1990),
particularly cold or hot temperatures (Davies and Parasuraman, 1981), time of day (Folkard
and Monk, 1997); alcohol effects (Horne and Gibbons, 1991), stress (Kecklund, 1999) and
differences in experience (Bisseret, 1988). It has been found that railway drivers’ negligence
of traffic signals is due to distraction, which is also the major cause of reductions in prolonged
attention (Haga, 1984). In addition, temperature, humidity, and noise within the driver’s
cabin are environment factors influencing prolonged attention (Smiley, 1990). Finally, most
of the evidence indicates that decreasing prolonged attention has an adverse effect on
performance and safety for train drivers.
Previous studies are confirmed that consecutive driving (Dinges, 1995; Horne and
Reyncr, 1995) and stress (Hockey and Hamilton, 1993; Kecklund et al., 1999; Zakay, 1993)
decrease prolonged attention. For improving railway safety, it is important to identify the
most critical human factors influencing job stressors while train driving. In so doing, it is
hoped the results will aid in mitigating job stress for train drivers. At the same time, it is also
important to understand the relationship between consecutive driving and train accident risk.
The concept of stress is built upon three principle components: the environment or the
demands of the situational context (the environment here is identified as the work situation);
the capacity and resources the individual has for dealing with these demands; the individual’s
physiological, psychological and behavioral reactions (Kalimo et al., 1998). Stress in its
negative sense implies an imbalance between the demands of the environment and the
capacity of the individual to cope, or that the individual’s expectations exceed what is offered
by the environment. If a stress situation cannot be controlled, negative reactions arise (e.g.,
discontent, worry, fear, frustration, and a lack of pleasure or motivation at work (Brown,
1980), or endocrine or physiological responses such as increased heart rate (Robertson,
1988)).
There are numerous factors and situations that can cause stress at work and some of the
most common are difficult social relationships, problems with the organization, poor career
opportunities, strenuous physical conditions, excessive workloads and time pressure, demands
are too low, little decision-making opportunity, no stimulation, lack of control and an inability
to exert influence on the job. But, stress conditions experienced by humans affect
performance and reliability (Dhillon, 1986). Zakay (1993) stated that increased stress can lead
to reduced productivity and performance, and performance is generally shown to deteriorate
One reason why performance is often impaired by stress is that, under favorable
conditions, many people are able to deal with moderate levels of stress by mobilizing extra
(mental) resources and focusing themselves on the task (Hockey and Wastell, 1998;
Schonflug, 1983; Meijman, 1997). There have been a number of studies that link highly
aroused stress states with impaired decision making capabilities (Baddeley, 1972), decreased
situational awareness (Vidulich et al., 1994), and degraded performance which impaired
driving ability (Helmereich et al., 1990). Hudoklin (1996) mentioned that stress levels above a
moderate level cause a decrease in human reliability, and lower driver reliability can cause
lower driver performance, which increases accident rates for railways. In order to improve
railway safety, it is necessary to measure train drivers’ conceptualization of stressors during
the driving process. However, very little is known about the strategies people use for coping
with stress and, in real situations, those coping mechanisms influence performance and safety.
Previous studies have explored different job stressor for train drivers. For example,
Chang (2005) applied Cooper’s Occupational Stress Indicator to explore job stress in train
drivers, and Yu (1998) examined the factors in job stress and strain using the National
Industry Safety and Healthy Research Institute’s generic job stress questionnaire. It should be
noted, those studies utilized only a general industry job stress questionnaire. Because the
railway is a specialized field, a specific questionnaire needs to be designed for measuring job
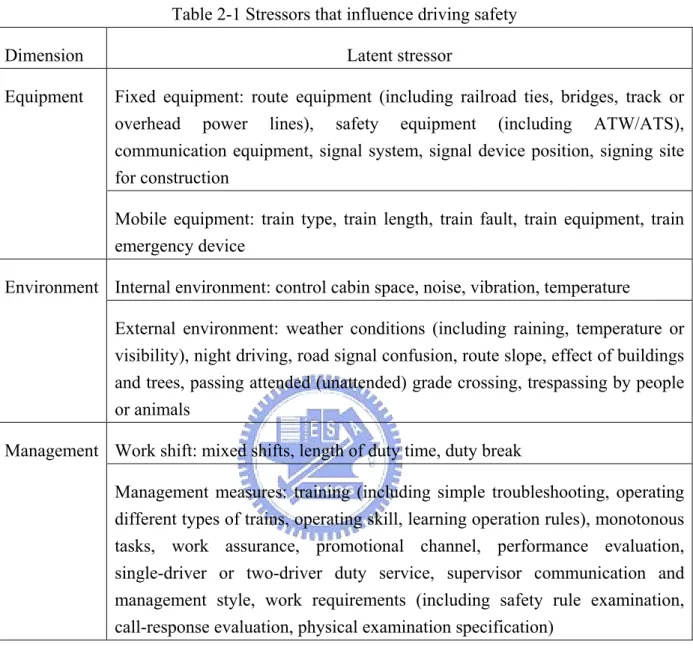
Table 2-1 Stressors that influence driving safety
Dimension Latent stressor
Fixed equipment: route equipment (including railroad ties, bridges, track or overhead power lines), safety equipment (including ATW/ATS), communication equipment, signal system, signal device position, signing site for construction
Equipment
Mobile equipment: train type, train length, train fault, train equipment, train emergency device
Internal environment: control cabin space, noise, vibration, temperature Environment
External environment: weather conditions (including raining, temperature or visibility), night driving, road signal confusion, route slope, effect of buildings and trees, passing attended (unattended) grade crossing, trespassing by people or animals
Work shift: mixed shifts, length of duty time, duty break Management
Management measures: training (including simple troubleshooting, operating different types of trains, operating skill, learning operation rules), monotonous tasks, work assurance, promotional channel, performance evaluation, single-driver or two-driver duty service, supervisor communication and management style, work requirements (including safety rule examination, call-response evaluation, physical examination specification)
As a first step in that direction, we apply rail system safety theory as proposed by Zhao
et al. (2003), which includes equipment, environment, management and driver as the four
dimensions of a railway safety system. Furthermore, based on relevant literature (e.g., Chang
well in Taiwan. The general key stressors that influence train driver safety are shown in Table
2-1.
Stressors related to equipment problems in railway systems during operation can be
divided into fixed equipment and mobile equipment. Stressors related to fixed equipment
include whether the railroad ties, track, and overhead power lines are functioning normally,
and whether the signal devices are mounted and functioning properly. Ohlsson (1990) pointed
out that, as drivers rely more on driving safety equipment, such as automatic train warning
(ATW) or automatic train stop (ATS), the availability of such safety equipment would affect a
driver’s response, thus causing huge work stress for a driver. The potential problems with
mobile equipment include locomotive or passenger car conditions. Since the train is operated
via many electronic devices, any malfunctioning equipment would affect the safety of the
train and drivers. Moreover, due to limited control cabin space and lack of toilets, drivers’
physiological needs cannot be met while on duty, thus bringing added stress to driving.
Apart from stress related to equipment, the environment inside and outside the
locomotive can also bring stress to drivers on duty. Internal environment refers to the work
environment in the control cabin. Akerstedt (1980) indicated that the space, noise,
temperature, and vibration of the control cabin could make drivers uncomfortable, and
drivers, and further jeopardized their driving safety (Edkins and Pollock, 1997). The external
environmental factors that bring driving safety stress include: (1) too cold, too hot, foggy, and
snowy days that hamper drivers’ responses and driving safety (Park, 1987); (2) weather or
environmental changes (e.g., growing trees along the railway) make it hard for drivers to
identify fixed signals, thus affecting their response speed; and (3) when a train is passing a
railway grade crossing and there are cars or pedestrians intruding. The external environment
poses a serious threat to train driving safety, and involves unexpected risks that are out of the
control of train drivers, which results in additional sources of stress for train drivers.
Besides tangible driving stressors, such as equipment and environment factors, drivers
also face intangible stress from management. Kolmodin-Hedman (1975), Akerstedt (1980),
and Netterstom (1981) suggested that mixed work shifts and irregular work timed are main
factors contributing to drivers’ work stress and affect their driving safety. Due to limitations
in work time and shift switch sites, train drivers often have to serve prolonged shifts, thus
facing more stress. In addition, as pointed out by Edkins (1997), without enough motivation
or aspiration, train drivers would be stressed about personal uncertainty of the future. Yu
(1998) also mentioned that uncertainty about work is an important source of stress for train
drivers. Therefore, reasonable supervision and promotional channels could cause stress on
beyond one’s capability, then higher work stress would be brought to drivers, leading to more
errors. Therefore, the availability of sufficient training so that drivers can drive various types
of locomotives, execute simple locomotive troubleshooting procedures, and master operating
skills to respond to driving needs, could also cause considerable work stress for drivers.
Finally, as drivers have to make immediate responses to various situations when driving (such
as signal identification or responding to obstacles), work stress for drivers in “single-driver
duty” service is naturally higher than for those in “two-driver duty” due to lack of warning
and aids.
2.3.2 Consecutive driving and railway safety
Driving behavior is exemplified as information management; the efficiency of
information management is closely related to the conscious status of driver. Driving and
working for a sustained period of time can generate fatigue (Okogbaa et al., 1994; Smiley,
1998; Sussman and Coplen, 2000) so drivers would not be able to maintain the level of
driving safety under conditions of continuous driving (Dinges, 1995; Horne and Reyncr,
1995). Consecutive driving can decrease vigilance, which is a major factor accounting for
driver error. Moreover, consecutive driving is one of the greatest causes of traffic accidents
number of consecutive driving hour increases for highway truck operations (Chang and
Hwang, 1991). According to a National Transportation Safety Board (NTSB) analysis of
railway accident research from 1990 to 1999 in America, it also shows that consecutive
driving is the major cause of train collisions and accident (Sussman and Coplen, 2000).
Therefore, the risk of being involved in a railway accident is expected to increase as the
number of hours of consecutive driving increases.
Few studies have examined the risk of train drivers’ accidents as a function of
consecutive driving time. Wharf (1993) analyzed the frequency of signals passed at danger
(SPAD) per million driving hours for British Rail train drivers and found a distinct peak
during the second and third hours of duty, followed by a relatively low level, which then
subsequently increased again. Based on an investigation of accident records from the Swedish
National Rail Administration during the period 1980–1997, Kecklund et al. (1999) also
indicated that a risk peak existed at the third hour of the shift, followed by a period of low risk,
which then showed an exponential increase in risk over hours on duty. Additionally, a Dutch
study (van der Flier and Schoonman, 1988) explored the relationship between driver errors
(missed signals) and working hours and found that the probability of error is at its peak during
the second and third hours of the shift. Kecklund (2001) and van der Flier (1988) also
fatigue accumulated from previous shifts or that drivers might relax too much during the start
of a shift.
However, little has been said about the definition of working time and types of train
drivers in the previous studies. Actually, given the work tasks and missions assigned to TRA
train drivers, a work shift can usually be divided into three sequential stages: pre-starting,
on-board driving, and post-arrival stages (Figure 2-1). Using the start and end times of shifts,
including the static pre-driving and post-arrival times mostly collected for payroll or other
reasons as the input, in most studies (Fletcher et al., 2001) may confound the time effect on
risk of accidents for actual on-board driving.
Figure 2-1 Three stages of one driver’s work shift under TRA operation.
In addition, ignoring differences between passenger and freight train drivers in accident
risk may result in the loss of some important implications due to their different working
environments and requirements. Freight train drivers usually have irregular work schedules,
boredom during operations (Sussman and Coplen, 2000), and a higher proportion of night
operation problems (Jackson, 2005). It is well-documented that irregular shift workers suffer
from restless sleep while undertaking early morning and night-time work (Akerstedt and Pre-starting stage On-board driving stage Post-arrival stage
Folkard, 1996; Pollard, 1996). Furthermore, shunting in marshalling yards by the starting
station is exclusively required for freight trains. Shunting is a notoriously unsafe activity
(Elms, 2001); therefore, freight train driving is expected to have more accident risk than
CHAPTER 3 METHODOLOGY
3.1 The train driver’s stressors
This study applied rail system safety theory proposed by Zhao et al. (2003) and designed
variables that fit particularly well in Taiwan. The different stressors for train driver as shown
Table 2-1 are all latent variables, which are inferred from subjective judgments by the
respondents. Researchers in transportation have directed their attention to the relationship
between one’s latent consideration and his/her response. After multiple related studies were
conducted, one was left to question: Were convincible and comparable measures on the
related latent constructs obtained? Such a challenge in the measurement is critical, especially
for those latent variables that have no normalized scales (the norms) to serve as a reference of
measurement. In practice, researchers usually measure such latent constructs by collecting
respondents’ opinions, and those opinions are mostly represented by items with ordinal scales
(e.g. the Likert-type scale) in questionnaires. If these ordinal categories in the items are
naively assigned some incremental integers, such integers can only represent the rank among
categories in a single item, which has limitations in statistical inference. For this reason, one
latent construct; especially for ensuring the results on the trait level can serve as reasonable
and effective factors for further statistical inference.
3.2 Methods for measuring a latent trait
To provide an objective and valid rating scales for solving such a problem, the item
response model has been developed and improved. Item response theory (IRT), which is a
model-based measurement in which trait level estimates depend on both persons’ responses
and on the properties of the item that were administered, has become the mainstream of
psychological measurement (Hambleton and Swaminathan, 1978). Among the various models
of IRT, the Rasch model is one that is widely applied for exploring psychological constructs.
A review of IRT and the Rasch model are provided in the following parts of this chapter.
3.2.1 Review of Item Response Theory
Psychological constructs are usually conceptualized as latent variables that underlie
behavior. Latent variables are assumed as unobservable entities that influence the manifest
variables (e.g., test scores or item responses). Thus the observation of these manifest variables
measurements of psychological constructs are usually indirect; that is, latent variables are
measured by observing behavior on relevant tasks or items. A measurement theory in
psychology must provide a rationale that both persons and items on a psychological
dimension should be inferred from behavior. Based on such a rationale, item response theory
has been elaborated to serve as a methodology in developing or executing a psychological
test.
Item response models are designed to estimate the values of latent variables on an
interval scale from item scores that form an ordinal scale. Items scores, or linear combinations
of item scores, are called “raw scores”. If the raw scores form a unidimensional ordinal scale,
then when the data are displayed with the items ordered according to item raw scores (the sum
of each subject’s responses to each item) and with the subjects ordered according to individual
raw scores (the sum of each subject’s responses across all items), the data matrix will conform
to a Guttman scale (Guttman, 1950).
A Guttman scale means that item raw scores are monotonic with item difficulty, and test
scores are monotonic with the subject’s ability. The sum of scores across items for each
person is the person’s raw score and the sum of scores across people for each item is item’s
person raw score and items are rank-ordered by item raw scores, the person rankings will be
the same for each item and item rankings will be the same for each person. There are likely to
be inconsistencies with this rigid rule, but the overall statistical pattern of responses should
agree with these expectations. The more closely the data agree with the Guttman scale, the
more likely it is that the raw scores represent at least an ordinal scale.
Item response theory begins with an explicit definition of the latent variable that the
instrument is supposed to measure, θ. This variable is an attribute of the respondent and will
have a unique value for each respondent , n θn. Each item of the instrument requires a
specific value (threshold) of θ to elicit a particular response from the respondent 50% (or
some other criterion percentage) of the time. The response threshold for item , , is in the
same units as
i bi
θ. The probability that respondent n will give a particular response to item
can be modeled with Birnbaum’s logistic:
i
( )
( ) 1 ai n bi ni e c d c P − − + − + = θθ
(1)where is the lower performance asymptote (c 0≤ c<1), is the upper performance
asymptote ( ), and controls the slope of item response function. The parameter
usually refers to chance performance, is controlled by the rate of careless response
errors, and is the discriminability of the item. In the case of our study, there is no “right”
or “wrong” answer. Therefore, is equal to 0 and is equal to 1 in Eq. (1). If
d 1 0< d ≤ ai c d a c d θ and
b are in the same units, then item-dependent variations in the slope of the item-response
function must indicate different levels of measurement noise for different items. Measurement
noise could be due to instability in θ, instability in , or instability in both. It also can be
attributed to variables not under study. The parameter of discriminability, , soaks up the
variability and creates the illusion of precise estimation of person and item values.
Furthermore, an item-dependent slope parameter is inconsistent to measurement theory
because it implies that the measurement units vary across items (Wright, 1977). Thus we
define , even the imprecise estimation might be made, however, the estimates of the
items can be interpreted as measurements of a single variable.
b
a
1 =
a
The simplified item response model (d = 1, c = 0, andai = 1) in our case is identical to
the probabilistic measurement model developed by Georg Rasch (Rasch, 1960). He deduced
his model from item response theory, and proved that the person and item parameters (θn
and ) are separable, and that item and person raw scores are sufficient statistics to estimate
the values of the item and person parameters. Since the 1980s, Rasch models have been
intensively used to estimate values on an interval scale from raw scores in psychometric
studies.
i b
From 1980s, Rasch models have been widely applied in analyzing data from assessing
instruments in rehabilitation medicine (Fisher, et al., 1995).To apply item response theory to
our assessment of the conceptualization of job stress ability for train drivers, we begin with an
explicit definition of the variable we hope to measure. Generally, the main interest of this
study is to explore the ability of train driving to overcome job stress for safe driving, θ. In
our hypothesis, this latent variable is constructed by the occupational stress indicators of the
train drivers. Each train drivers, , has a unique ability, n θn, that we try to measure (the
person parameter).
Depending on the conceptualization of the job stressors related to train driving, some
items (stressors) will seem easy to overcome and others will be perceived as more difficult. It
is reasonable to hypothesize then that train drivers with more ability will be able to overcome
a greater number of items (stressors) with ease than those with less the ability. Thus, we can
consider each item as requiring a specific level of ability of train driving in order to overcome
the stressor and be able to drive safely. The threshold value for overcoming a job stressor is
the ability required to perform item with ease, and is, thus, the item parameter . i bi
To simplify the review of the Rasch model, consider only dichotomous responses. If
train drivers respond that they can overcome an item with ease, we assign a score of 1 to that
can overcome item with ease is: i
(
)
i n i n b b i n e e b P − − + = θθ θ 1 , 1 (2)The probability that train drivers will report that he cannot overcome item with ease is: n i
(
n i)
(
n i)
n bi e b P b P − + = − =θ
θθ
1 1 , 1 1 , 0 (3)The odds that train driver will report that he overcame item with ease is: n i
(
)
(
)
n bi i n i n e b P b P − = θθ
θ
, 0 , 1 (4)and the log of the odds ratio, or “logit”, is:
(
)
(
)
n i i n i nb
b
P
b
P
−
=
θ
θ
θ
,
0
,
1
ln
(5)which isolates the parameters of interest.
The person and item parameters can be estimated from response odds ratios in the data
set using a constrained form of Eq. (5). Because there are no free model parameters, the Rasch
model is prescriptive rather than descriptive. That is, the data have to fit the model, or the
assumptions of the model must be rejected for the data set. The model assumptions are: (1)
the subjects used to test the model differ in their abilities to overcome job stressors related to
safe train driving, (2) the subjects’ responses to items depends only on their ability to
overcome the job stressors, (3) subjects’ response are probabilistic and conditional on their
monotonically with the difference between the subjects’ ability θn and the perceived item
difficulty bi.
In addition to dichotomous responses, the Rasch model is modified to be applicable in
polytomous rating scale instruments, such as the five point Likert scale used in our
questionnaire (Andrich, 1978; Masters, 1982). The modified Rasch model assumes as the
parameter of difficulty in rating category to item , and assumes that Eq. (2) refers to the
probability of subject responding with rating category rather than rating category
to item i. In other words, we can model the log odds of the probability a person
response in category of item i compared to category
ix b x i n x 1 − x
x x−1 as a linear function of latent
ability θn, and the relative difficulty of category bix:
ix n x ni nix b P P − = ⎟ ⎟ ⎠ ⎞ ⎜ ⎜ ⎝ ⎛ − θ ) 1 ( ln (6)
Following Andrich’s modification on polytomous responses in the Rasch model, there
are two types of formulations that are widely applied in assessing the value of item difficulty
and person ability, which are “Rating Scales Model” and “Partial Credit Model”. The Rating
Scales Model is used only for instruments in which the definition of the rating scale is the
same for all items and, in general, the Partial Credit Model should be used when the definition
each category (Wright and Masters, 1982). This is achieved by a re-parameterization from Eq. (6): x ix i ix
b
F
b
=
+
(7)and the Partial Credit Model becomes:
ix i n x ni nix b F P P − − = ⎟ ⎟ ⎠ ⎞ ⎜ ⎜ ⎝ ⎛ − θ ) 1 ( ln (8)
The Partial Credit Model addresses items where: (1) credit is given for partially correct
answers, (2) there is a hierarchy of cognitive demands on respondents in each item, (3) each
item requires a sequence of tasks to be completed, or (4) there is a batch of ordered response
items with individual thresholds for each item (Wright and Masters, 1982). In assessing the
perceived physical ability of the elderly travelers, we lose the limitation of the same rating
scale for all items, and adopt the Partial Credit Model for our measuring method.
The Rasch model provides estimates of the variable of interest on an interval scale, and
allows us to test the validity of any psychometric instrument with an objective set of criteria.
The tests of construct validity are the fit of person measures to the model, and the correlations
of person and item parameter values with other variables, compared with expected
correlations. The tests of content validity are the fit of individual items to the model, the
estimation errors of item parameter values, and the spacing and range of item parameter
3.2.3 Parameter estimation of the Rasch model
Based on different statistical assumptions, there are several approaches for estimating
the parameters of the Rasch model. Among them, the joint maximum likelihood (JML)
estimation is a relatively simple and effective way, which is also the core technique of the
related computer programs: WINSTEPS and FACETS (Linacre and Wright, 1997). A simple
introduction of JML estimation is given as follows.
In JML estimation, unknown construct levels are handled by using provisional trait level
estimates as known values. The provisional trait level estimates themselves are improved by
using subsequently estimated item parameters, which are successively improved. In other
words, JML estimation is an iterative procedure which typically involves sequential estimates
of person and item parameters. In the initial stage, person parameters are estimated.
The first iteration of the two-stage procedure involves specifying starting values for the
item parameters so that the maximum likelihood estimates of person parameters can be
obtained. Then the item parameters are estimated using the first person-parameter estimates.
improved person or item parameters respectively. The iterations continue until the item
parameters change very little between the successive iterations (the convergence status).
JML has been extensively applied in the estimation of many IRT models. It has several
advantages in applications. First, this algorithm is easily programmable. Second, JML is
applicable to many IRT models. Both the 1PL IRT (e.g. the Rasch model) and 2PL IRT (e.g.
the Multi-Facet Rasch Model) can be estimated with JML. Third, JML is efficient on
computation. One thing has to be noted in applying the JML estimation that there is a strong
limitation in applying the JML algorithm. In JML estimation, the items or persons with
perfect scores (all passed or all failed) provides no information about the parameters because
there are no constraints are placed on the solution.
Therefore, estimates of such items or persons with perfect scores are not available in the
JML estimation. In fact, such measures of items or persons with perfect scores mostly occur
in the data of educational tests but rarely in psychological exploration. the psychological
exploration, items with perfect scores are regarded as inappropriate items because they
provide no information on evaluating construct levels of the respondents; person with perfect
comparable. It is generally suggested to exclude these items or persons from the original data,
or to withdraw the data and redesign the whole investigation program.
3.2.4 Reliability and validity statistics in the Rasch model
If any of items are sensitive to more than one variable distributed in the train driver
sample, then the pattern of responses to those items will appear noisy or outlying relative to
model expectations. Noise is assessed with the information-weighted fit statistic (‘infit’)
which is the ratio of the mean (across train drivers) squared response residuals (relative to
response expected by the model) to the mean squared residuals expected by the model.
Outlying items are detected with the outlier-sensitive fit statistic (‘outfit’), which is the mean
ratio of the squared train driver response residuals to the expected squared train driver
response residuals. These two weighted mean-squared fit statistics can be normalized and
expressed in model standard deviation units (Smith, 1991; Wright and Masters, 1982). The
expected values are 0, with a tolerance of ±2 standard deviation units. Positive zstd values
indicate that response residuals exceed the expectations of the model, which means that the
responses to the item are inconsistent with the assumptions of the model. Negative values
some strong source of covariance that is shepherding item responses toward the expected
value.
3.3 Accident rates for different timeslots of consecutive train driving hours
3.3.1 Exposure data collection
Chapman (1973) defined the concept of exposure as the amount of opportunity to be
involved in an accident that a driver or traffic system experiences. In practice, exposure is the
denominator when the accident rate is calculated. Dividing the accident frequency by
exposure serves an important purpose; that is, equalizing differences in “intensity of use” so
as to make reasonable safety comparisons between different entities or time periods. Different
exposure measures have been used depending on the type of accident under investigation.
Examples include vehicle miles of travel, ton-miles, passenger miles, vehicle registrations,
driving hours, and number of vehicles passed. Applications of exposure vary with discussed
subjects, and the good or bad of exposure design and collection usually are the decisive
factors of research success. How to define exposure is critical step to find reasonable accident
Throughout the literature, “distance traveled” and “time traveled” are the two most
widely used measures of driving exposure to accident risk. Since different types of trains (e.g.,
passenger train and freight train) have different traveling speeds, distance-based exposure
may not provide a fair basis for assessing the effect of fatigue generated by consecutive
driving on accident risk. As such, driving hours is commonly recognized as an appropriate
measure to gauge its effect on fatigue, which might influence accident risk. Therefore, “time
traveled” is selected as the exposure measure in this study.
According to the jobs assigned to TRA drivers, a work shift can be divided into three
sequential stages: pre-starting, on-board driving, and post-arrival (Fig. 2-1). At the
pre-starting stage, a driver is required to pass an alcohol test, receive shift instructions,
conduct a carriage check (e.g., brake tests, automatic train protection system, etc.), and drive
the train from the origin depot to the starting station. Generally, completing all of the tasks at
this stage takes about 40-60 minutes depending on different types of work shift patterns.
Trains are usually required to run to the depot at the destination station after finishing
the mission. Also, drivers must go to the destination dispatching units and complete reports
before going off duty. Tasks completed by drivers from destination station to destination
Only, the on-board driving stage is the operating duration from the starting station to the
ending station. The driving task at this stage is relatively continuous and a driver needs more
concentration and alertness to operate safely. Therefore, fatigue caused by consecutive driving
is expected to develop gradually and significantly influence accident risk. Shunting is
exclusive to freight train driving before leaving the starting station and, since it requires
continuous driving, that period is included in the on-board driving time in this study.
In addition, a complete train trip starts at the origin depot and ends at the destination
depot. Hence, a shift can be classified into one of four types based on starting and ending
points and different work tasks (see Table 3-1). A Type I shift means the driver departs from
the origin depot and completes the shift midway in the train trip. In a Type II shift a driver
initiates the shift midway in a train trip and finishes at the destination depot. In Type III, a
driver initiates and completes the shift at a midpoint owing to a long train trip. When a trip is
short, a driver completes the trip and is classified into the Type IV shift.
For these four shift patterns, we can identify the pre-starting instructions, trunk line
driving (including shunting for freight trains), and job reporting, which are the three common
tasks required for each pattern. “Trunk line driving and shunting” at the on-board driving
stage is a relatively continuous job for drivers, that influences operations, occupies the main
tracks, and yields available driving records. Therefore, the time spent doing on-board driving
which provides valuable information to explore the effect of consecutive driving on the risk of
being involved in an accident.
Table 3-1 Working items for different types of driver work shift pattern
Pre-starting stage On-board
driving stage Post-arrival stage
Driver work
shift pattern
Pre-starting
instruction Pre-starting check Driving from depot to
starting station
Trunk line driving (including shunting
for freight train)
Driving from ending station to depot Job reporting Type I ˇ ˇ ˇ ˇ ˇ Type II ˇ ˇ ˇ ˇ Type III ˇ ˇ ˇ Type IV ˇ ˇ ˇ ˇ ˇ ˇ
3.3.2 Collection driver responsible accidents
According to the TRA’s operation rules, a train accident is defined as an event that
causes more than 10 minutes delay in operation, and the related personnel are responsible for
reporting the accident to the Accident Investigation Prevention Committee (AIPC). Thereafter,
the accidents will be further classified into human error or non-human error accidents based
on APIC’s judgment. Based on this study’s purpose, only the driver-responsible accidents are
counted.
3.3.3 Finding accident rates for different time slots of consecutive train driving hours
observed in this study. To determine whether the accident rate rises as driving hours increase,
the study’s length of on-board driving time was further divided into several time slots; 15
minutes for each slot and 18 time slots total. According to the length of on-board driving for
different shifts, they could be distributed into the 18 different time slots. A longer shift would
cover more consecutive slots compared with a shorter shift. Taking 3 hours and 10 minutes of
on-board driving as an example, the 3 hours were assigned to the first 12 time slots (i.e., 4
(15-minute slots per hour) × 3 = 12 slots) and the last 10 minutes were assigned to the 13th
time slot. Finally, the accumulated on-board driving hours within each time slot could then be
calculated.
Based on the collected data, the accident rates for each time slot could be measured by
dividing the number of accidents that occurred in one time slot by its corresponding driving
exposure (i.e., the on-board driving hours in the same time slot), indicating the accident risk
for that time slot. That is, the accident rate for the ith time slot can be expressed as
ARi=Ai/Hi (1)
where ARi is the accident rate for the ith time slot, Ai is the number of accidents that occurred
in the ith time slot, and Hi is the accumulated driving hours in the ith time slot.
According to the above definition, the accident rates for different time slots for the
CHAPTER 4 EMPIRICAL STUDY OF THE STRESSORS FOR TRAIN
DRIVERS
As was noted earlier, drivers’ perceptions of stressors are all latent variables. As such,
designing a questionnaire that could effectively assess the drivers’ perceptions regarding those
stressors was a very important step in the study.
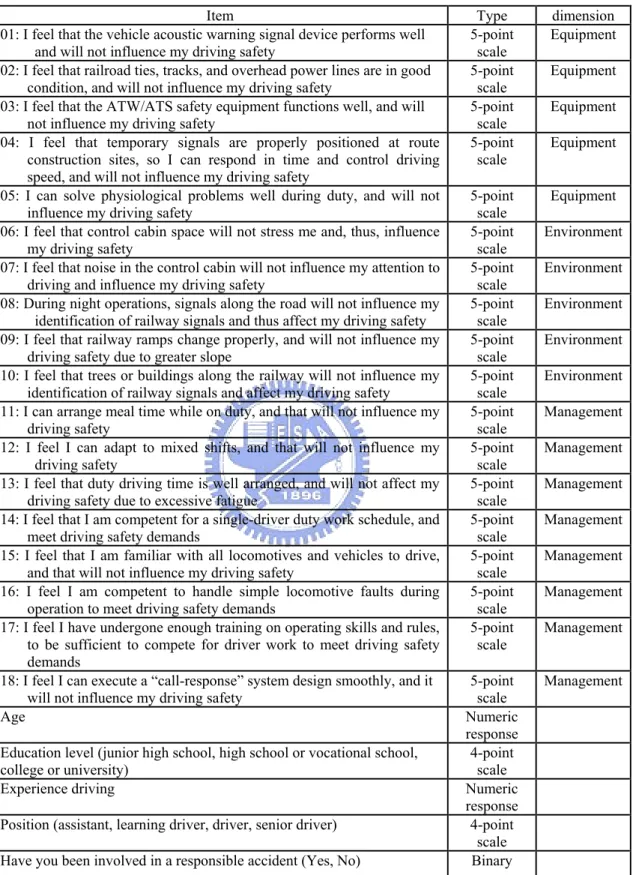
4.1 Questionnaire design
Based on the framework of rail system safety theory (Zhao et al., 2003), as was
discussed above, 43 stressors that could possibly effects driving safety were identified. After
three focus group discussions with drivers at the Taipei, Changhua, and Hsinchu dispatching
units, the initial list of 43 stressors was narrowed down to 28. Since this study gathered
self-report data from drivers, subject matter experts (SMEs) in the areas of qualitative and
quantitative research methodologies were used to ensure the questionnaire would reflect the
respondents’ perceptions. The qualitative method asked the SMEs to modify the items so
drivers could better understand their meaning. In the quantitative method 30 SMEs from the
dispatching units were asked to respond to the items, and those results were examined to
ensure questionnaire fitness, as was proposed by Aiken (1996). A total of 18 stressors were
Of those items, five concerned the equipment dimension, five concerned the
environment dimension, and eight concerned the management dimension.
In order for drivers to express their personal feelings fully, this questionnaire utilized a
5-point Likert-type scale, with (1) Strongly disagree; (2) Disagree; (3) Fair; (4) Agree; and (5)
Strongly agree, representing the variation in drivers’ perceptive difficulty of each driving
stressor. A choice of “Strongly agree” indicates the driver feels this stressor is very easy to
overcome, while “Strongly disagree” indicates the driver feels the stressor is very difficulty to
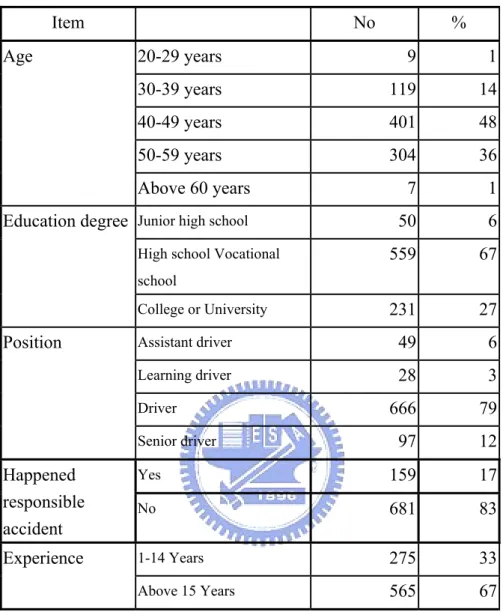
overcome. The survey also collected data regarding age, educational level, driving experience,
position, and occurrence of driver-responsible accidents. Age and driving experience are to be
filled out in numbers; educational level and position are classified in 4-point categorical scales;
and occurrence of driver-responsible accident has a dichotomous “Yes” or “No” response
option. This study also explores whether the competency of drivers of various years of
experience, ages, educational levels, job grades, and occurrence of driver-responsible
accidents would vary, so as to facilitate future planning and implementation of driving safety