Principal Component Analysis of Multi-Pigment
Scenario in Full-Color Electrophoretic Display
Yen-Hsing Lu and Chung-Hao Tien
Abstract—In this paper, we present a methodology to charac-terize the colorimetric performance of a full-color electrophoretic display (EPD) with multiple pigment formation. We use the prin-cipal component analysis to formulate the composite hybrid color-mixing system by using a single eigen-spectral component for each sub-pixel channel. Proposed model was validated to predict the chromatic features with high accuracy
for both micro-cup type and micro-encapsulated type EPD samples. This study is effective to uncover the underlying physical features from only colorant-mixture information in a novel color system.
Index Terms—Full-color electrophoretic display (EPD), principal component analysis, colorant-mixture.
I. INTRODUCTION
T
ECHNOLOGIES in reflective display (or also known as electronic-paper, e-Paper) have made a rapid progress in the last decade. E-Paper is a direct view electronic display that is either bi-stable or nearly bi-stable with the benefit of extremely low power consumption. Generally, there are several scenarios to implement the bi-stability (or nearly bi-stability), including electrophoretic [1]–[7], electrofluidic [8], [9], bi-stable liquid crystal display (LCD) [10], [11], electrowetting [12], [13] and other emerging approaches [14]. Despite jeopardized by the great success of emissive displays and their accompanying PC devices, e-Paper still has potential to leverage its strongest advantages which emissive counter-parts are hard to achieve, such as superior energy saving, fine contrast under sunlight, continuous roll-to-roll manufacturing, flexible format, or even paper-like reading comfort. One major goal of such non-self-luminous media is to retain many of the desirable characteristics of color printed paper, while keeping ubiquitous communication via different electronic interfaces. The unique feature containing both hard copy rendering and soft copy operation has drawn enormous attention to the public, thus drive many studies to pursue more suitable modes and manufacturing methods.Electrophoretic display (EPD) is one of the remarkable ap-proaches among e-Paper family, due to its successful technolo-gies such as micro-encapsulated type from E Ink, micro-cup type from SiPix in monochromatic, independently movable col-Manuscript received December 04, 2012; revised March 20, 2013; accepted April 23, 2013. Date of publication May 13, 2013; date of current version Oc-tober 09, 2013. This work was supported by the National Science Council of Taiwan under Contract NSC 99-2221-E-009-067-MY3.
The authors are with the Department of Photonics, National Chiao Tung Uni-versity, Hsinchu 30010, Taiwan (e-mail: [email protected]).
Color versions of one or more of the figures are available online at http:// ieeexplore.ieee.org.
Digital Object Identifier 10.1109/JDT.2013.2260527
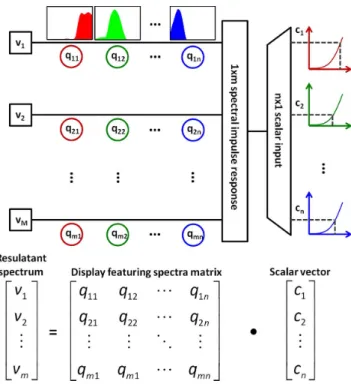
Fig. 1. The colorimetric characterization performs the matrix-vector multipli-cation of . System transfer matrix is composed of featuring spec-tral channels determining the significantly specspec-tral components in color system.
ored particles (IMCP) type from Fuji-Xerox [7], respectively. Electrophoresis is the motion of particles dispersed in solution or medium under the influence of an applied electric field in ei-ther vertical or horizontal direction. In terms of display or elec-tronic printing, the particles are embedded in thin-film layers. The color and gray level of the display can be determined by the reflective properties of the ink particles, or of a surface be-hind the fluid or their combination. The ink particles can move either in the plane of the panel or perpendicular to it in response to the applied field. Taking electrophoretic system as a case, if e-Paper can achieve adequate colored images, we are won-dering what is the underlying physical feature from only col-orant-mixture information? Since the amazing similarity with conventional print technology, by which the multicolor images are produced by placing small dots of ink with a specific spectral reflectance side-by-side, we are asked if there exists a unifying scheme to describe the nature of multi-pigment transposition in e-Paper, and if so, whether we can characterize it in a systematic way borrowed from well-established color print technology?
To help guide our investigation, a linear transformation be-tween device-dependent and colorimetric representations is in-troduced at first [15]. Fig. 1 illustrates the transformation mech-anism that executes a matrix-vector multiplication. Without loss 1551-319X © 2013 IEEE
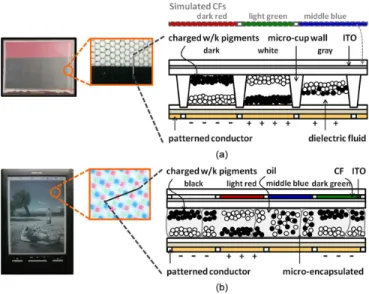
Fig. 2. Schematic diagram of (a) monochromatic micro-cup and (b) full-color micro-encapsulated electrophoretic display. A net of electric fields are applied across the cells to control the distributions of the charged multi-pigments. The spectral absorptance of dielectric fluid or oil, which is subject to the position of the multi-pigments, offers the sub-pixel the resulting lightness. Moreover, the EPD achieves full-color approach with the pixel layout of simulated RGB in (a) and practical RGBW in (b), respectively. Different amounts of absorbed light from sub-pixels are introduced into our eyes and mixed additively on retina ac-cordingly. Therefore, the color-mixing principle of the full-color EPD is a com-plex system which cannot be easily characterized by simple additive or subtrac-tive color mixing theorem.
of generality, the medium is assumed to be characterized by featuring spectral channels (e.g., for conventional emissive dis-play, , the matrix represents the spectral superposition of red/green/blue channels) sampled by wavelength points to form an linear transformation matrix . The system characteristic matrix determines which spectral components are significant in a color system. The -by-1 vector offers a set of scalar ratios, subject to input digital counts, to determine the intensity of individual channels. The resulted spectrum can be obtained via - multiplication accordingly.
In terms of EPD, its colorimetric performance is mainly de-termined by single (or multiple) pigment transposition. A pig-ment is a colorant that is usually not soluble in the medium in which it is applied and incorporated into the thin film in par-ticle form. Pixel technology involves the combination of pig-ment (single or multiple), dielectric fluid (monochrome or trans-parent), filter, and electrode layout. Fig. 2(b) illustrates a ver-tical colorant transposition with simplified micro-encapsulated architecture, whose pixel arrangement is a two-colorant mixing with RGBW filter. In this two particles system, the charged black or white pigments move perpendicular to the plane of panel, and the reflectance of each subpixel is determined by whether the particles are at the front or back.
In addition to the gray modulation by colorant transposition, color EPD shall equip red, green, and blue color filters to allow full-color rendering. Based on micro-cup architecture, SiPix also developed an alternative paradigm to create a full-color system called dual mode switching. In this approach, white colorant particles are embedded in red, green or blue colored dyes and a black layer of light absorbing material is placed behind each sub-pixel. The electric fields are arranged so that
the particles can move sideways as well as forward and back. According to Heikenfeld’s study, bi-primary mixing is very suited for colorant-transposition technologies. This is an advan-tage, because colorant transposition technologies exhibit some of the highest reflectance and color fraction [16]. Except for color filter and colored dyes approaches, Fuji-Xerox introduced a novel color EPD using independently movable colored parti-cles with different threshold fields [7]. The technique disperses second primary colored particles in identical cell to enable truly printing-like e-Paper. No matter what mixing scheme a color system use, obviously it is not possible to model such composite mixing scheme by a pure subtractive or additive theory. Instead, numerical regression and interpolation are the most practical approaches to characterize such complex color mechanism, but at an expense of huge measured efforts [17].
Principal component analysis, abbreviated PCA, has been widely used as a mathematical tool in color technology [18]–[20]. One major function of PCA is to find the principal directions that a set of data oriented. The major and minor axes imply that many physical significance hidden by a large amount of end-to-end measurement data. In this paper, we aim to employ PCA to uncover the underlying physical principles related to a complex color-mixing scheme. In case of EPD with composite mixing via micro-cup and micro-encapsulated structure, we expect to precisely reconstruct color model of a full-color EPD while extracting primary spectral features for multi-pigments transposition. The method is kind of learning-based reconstruction, i.e., a preliminary measured data set is used to build up the color model. In order to reduce the superfluous information, the spectral reflectances of the EPD samples are merely estimated from eigen-spectral components by using PCA and projection matrix. Color difference between sample spectra and their spectral estimation for a set of sam-ples will be discussed. Finally, we will examine the proposed PCA-based methodology by two case studies (micro-cup type and micro-encapsulated type color EPD).
II. METHODOLOGY
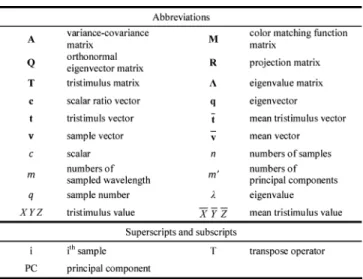
PCA is well described by means of vector–matrix lan-guage. All the scientific symbols and abbreviations utilized in following section are listed in Table I where scalars are repre-sented by italic characters. Vectors and matrices are denoted by bold-faced lower-case and upper-case letters, respectively. Here we merely make a quick review of the PCA in color technology. The complete matrix algebra will not be reviewed here, as detailed information can be found in many classical publications [21]–[23].
First of all, we analyze a variance-covariance or correlation structure of a spectral reflectance set in matrix form. As we described in Fig. 1, the column vectors of matrix constitute a vector space. For conventional liquid crystal displays, the column vectors are mainly determined by the spectral trans-mittance of the color filter. But those in EPD become more complicated because the spectral vectors arise from composite color mixing combination, including colorant-mixture, fluid, filter, or microstructure. Hence we must use a skill to simplify the matrix and uncover the spectral properties of each compo-nent channel from a set of measured data.
TABLE I NOMENCLATURE
Given a spectral reflectance set, , an matrix with sampled wavelengths and number of colors (e.g., spec-tral reflectance of color-ramp shown by EPD), denoted as a set
of column vectors of . As each sample color ,
is measured within the visible spectrum between 400 nm and 700 nm at 10-nm intervals; is a vector of 31 components. Similarly, as we have a set of 216 sample colors that EPD can achieve, the dimension of this characteristic matrix becomes
.
A mean vector, , is the average of the entire sample set. The physical significance of the mean spectrum is the colorant neu-tral (like the DC bias of a learning database) of an EPD sample. (1) The difference between the spectral reflectance and mean spec-trum presents the spectral variance. As we correlate the variance among spectral reflectance entry, a variance-covari-ance matrix can be obtained as following:
(2) where is the matrix-vector transpose operator. Notice that wavelengths confine the sample set in an -dimensional vector space. Each entry of , describes the data correlation be-tween th and th spectral channel where and . The higher absolute value of the term in is in response to the higher correlation between two spectral features. It also implies that when is zero, the th and th spectral features are totally uncorrelated. Since is a symmetric matrix based on the for-mation in (2), variance-covariance matrix can be factored into a
perfect form by change
of basis [24]:
(3) where is an -by- matrix constituted by a set of
or-thonormal eigenvectors of matrix . The
eigenvectors are linearly independent and indentify the prin-cipal directions that a set of reflectance spectra oriented. , a
diagonal matrix, is the eigenvalues of the corresponding
eigen-vectors. If we descend the diagonal terms of
, the reveals the most dominant variance along the new spectral axis (i.e., eigenvector ). The new axes (or bases) represent the directions with maximum variance and effec-tively reduce the scale of matrix. The total percentage variance defined by the first eigenvectors is shown as
(4)
Equation (4) can be utilized as an assessment to estimate the dimensionality of the given sample set. For example, if the first eigenvectors represent 99% of total variance , then the original matrix can be well approximated as a downsize form:
. .. ...
(5) where the subscript, , stands for principal component. Comparing (5) with (3), the dimensionality is reduced from column vectors to primary eigenvectors if the given sample set is re-distributed in a new eigenvector coordinate system.
To achieve the linear transformation, we introduce a projec-tion matrix, , which is an orthogonal projector, calculated from principal eigenvector matrix, :
(6) Accordingly, the sample value, , can be approximately recon-structed by mean vector, , and - multiplication as follows: (7) where is the scalar ratio vector whose entries indicate the projection along eigenvector direction. Now, (7) is further ex-pressed with matrix extension:
..
. ... ... ... . .. ... ...
(8) Recall the linear transformation employed to describe the ren-dering mechanism of a display system in Fig. 1, each column vector in the principal component matrix from the reduc-tion of the eigenvector matrix of the variance-covariance ma-trix can be regarded as the characteristic vector analysis of EPD. Until now, the physical features of the multi-pigment mix-ture for an EPD have been revealed by the PCA-based method. However, the spectral formation is not convenient for color re-production due to the redundant dimension [25].
In the perspective of color communication among multi-media, employing simplified quantification such as
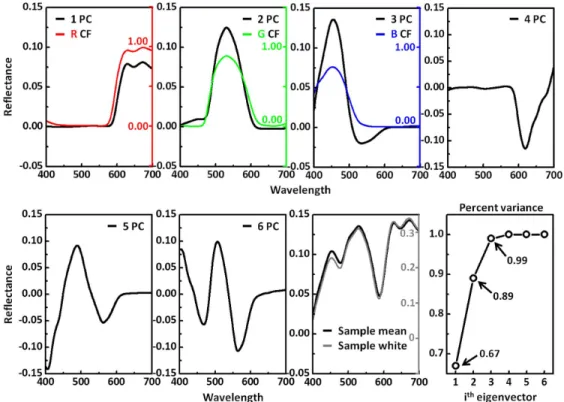
Fig. 3. The first six principal components (PCs) and the mean derived from the reflectance spectra of the micro-cup EPD sample set. The spectral tendencies of the first three PCs are consistent with the spectral transmittance of the RGB color filters, respectively. It implies that the spectral characteristics of color filters strongly dominant the significant directions in this case study.
tristimulus values or CIELAB values is more intuitive and more feasible. Therefore, turning (7) into a low dimension form containing three entries of each column vector is necessary for practicality. An -by-3 matrix, , where the three columns are color-matching functions is introduced to reduce dimension: (9) The -dimensional column vectors from (7) are now projected into three-dimensional human-visual-system subspace and transformed to the corresponding projection:
(10) where is the column vector of tristimulus values, and the 3-by- matrix, , uncovers the colorimetric features of the system characteristic matrix. We can see that the systematic description of the colorant-mixture for a multi-pigments EPD is from -dimensional spectral formation to three-dimensional colorimetric formation while the scalar vectors are identical in both equations. This colorimetric expression will benefit further applications such as evaluating model accuracy and communi-cating information across different electronic interfaces.
III. CASESSTUDY
In order to validate the characterizing technique, we adopt two full-color e-Papers, micro-cup EPD and micro-encapsu-lated EPD, to be our case studies. In measurement setup, the TOPCON® SR-UL1R spectroradiometer was used to measure the colorimetric information shown on the EPD. It features the working luminance range of 0.005–3000 cd/m with the reliable
accuracy of 2% and 0.002 in luminance and chromaticity, respectively. The 45 :0 setup, the SR-UL1R measured from the normal side of the EPD and the light source illuminated from the 45 position, was adopted. In addition, the spectra re-flectance of each color sample was measured for 2 observer under CIE illuminant F7. All the color data had been measured five times and then averaged in terms of accuracy and stability.
A. Micro-Cup Type Color EPD
Since the dual mode switching sample involving RGB col-ored dyes was not commercially available, a 9-inch monochro-matic micro-cup (MC) EPD sample combined with simulated RGB color filters was examined as the first case and shown in Fig. 2(a). Apart from the essential structures such as polymer micro-cup and transparent fluid, the EPD included white and black pigments with opposite polarity to enhance the intrinsic contrast ratio. Based on the simplest pixel layout, commercial RGB color filters (CFs) were placed side-by-side over the top of micro-cup. The well-known spectral transmittances of the CFs were employed to calculate the performance. Each individual RGB channel was capable of 16 substantial gray levels to ac-complish 4096 colors in total. The fundamental measurement of a set of 216 sampling grid colors created by 6 digit counts of red, green, and blue was displayed over the MC EPD as the learning database for principal component analysis.
The results of the principal directions changed from the set of sample pointed plotted in Fig. 3. The mean spectrum typi-cally represents spectral neutral of three RGB sub-pixels. Since the sample set comes from a uniform grid design, the mean is expected to be similar to a gray sample (e.g., the spectral re-flectance of the white color illustrated in the seventh subplot).
The eighth subplot highlights the relationship between the per-centage variance and eigenvector. The plot indicates that the first three principal directions have the spectral variance of 67%, 22%, and 10% that is able to contain 99% of sample data. Hence, these three eigenvectors explain a significant amount of the total variance and the new spectral axes uncover the color informa-tion of the sample set. The first eigenvector enlightens the most weighted direction along with samples distributed indicating an overall red cast of the sample set or the reflectance peaks in the long wavelength region. Similarly, the second and the third eigenvectors reveal the variations of the colors in middle and short wavelength regions pointing out the existence of greenish and bluish samples, respectively. If we compare the spectral transmittance of RGB color filters (CF curves show on the first three subplots) with the first three principal directions, the spec-tral tendencies between them are amazingly consistent while the absolute values exist difference. We acknowledge that the simu-lated full-color MC EPD is a special case, since its system char-acteristic matrix is associated with the RGB color filters like a counterpart, whereas the image of LCD is only achieved by the combination of RGB color filters. Clearly, the PCA-based anal-ysis is actually regarded as colorant estimation as Bern’s ex-pectation [15], even the colorant-mixture in full-color MC EPD is electrophoretic differentiated from traditional hard copy. As a consequence, the proposed methodology aims to construct a more complicated system such as dual mode switching MC EPD whose inherent physical features are dominated by the interac-tion of ink particles and colored dyes (RGB or CMY).
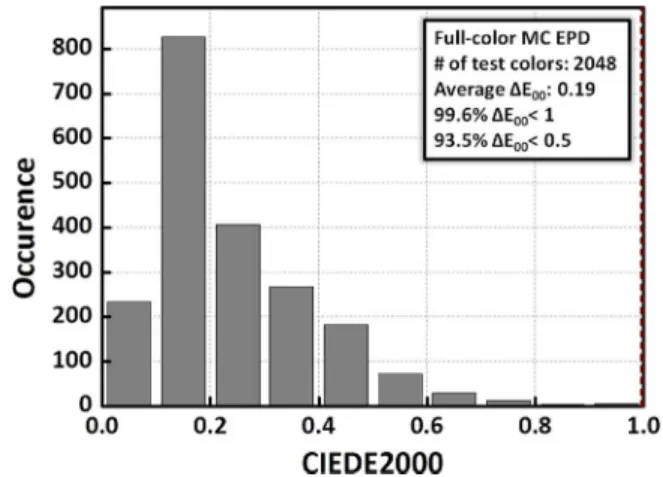
The randomly selected 2048 color samples were used to ex-amine the predicting accuracy of the proposed model in MC EPD. Two different sets of tristimulus values, one by sample spectra and the other by the estimated spectra via (8), were ap-plied to calculate the CIEDE2000 color differences for evalu-ation. If the value is less than one, the difference attributed to predicting error will be indistinguishable for human perception. The color difference values of the whole tested samples were calculated and plotted to build an occurrence chart in Fig. 4. According to the statistic, over 99% predicting results have reli-able accuracy and around 93% of predictions with high fidelity . As a result of the verification, the proposed model in Section II can precisely describe the colori-metric performance of MC EPD composed of multi-pigments and color filters.
B. Micro-Encapsulated Type Color EPD
Of all e-Paper products, micro-encapsulated (ME) EPD man-ufactured by E Ink has the largest market share due to its excel-lent and robust performance. In terms of the reliability, a com-mercial 9-inch full-color ME EPD sample was adopted to con-firm the viability of the proposed model. A schematic diagram of the tested sample is illustrated in Fig. 2(b). Unlike the first case whose pixel geometry was RGB side-by-side, full-color ME EPD included four sub-pixels, RGBW (W as white), with quadratic arrangement. Each RGB sub-pixel presented funda-mental colorimetric information with 16 intensity levels. The W channel benefited the enhancement of brightness but sacri-ficed color fraction simultaneously. A specific algorithm was
Fig. 4. Occurrence of CIEDE2000 color difference for tested 2048-color sam-ples of simulated full-color MC EPD.
involved to accomplish RGB-to-RGBW input signal-decompo-sition [26]. Similar change of basis was demonstrated by re-peating PCA-based analysis on the spectral reflectance of the identical sample colors used in the first case.
The percentage variance plot, the spectra of the mean and the first six eigenvectors are shown in Fig. 5. Comparing these plots with Fig. 3, the first three principal directions accounted for 99% of the total variance are no longer the spectral transmittance of color filters. The first eigenvector including 97% of the repre-sentation exhibits a neutral colorant in highly accordance with the spectral reflectance of sample white. It implies that the inten-sity of reflecting light is a dominant factor mainly resulted from the boosting W channel in signal controlled algorithm. To have a further discussion, the 1st principal component is regarded as a weighted DC value attributing to the W channel plus the mutual portion of the RGB sub-pixels (e.g., for an input signal , the DC bias can be consid-ered as ). Except for the significant neutral representa-tion, the variations of chromatic amounts are explained by two complimentary primary spectra (colors) in the next three eigen-vectors. For example, the second spectral axis uncovers colors varying along the long wavelength regions (marked as R) and the corresponding complementary spectral regions (marked as C) describing the existence of reddish and cyan-ish samples in the data set. Similarly, the last GB primaries are matched up with their MY compliments in the third and forth eigenvectors, respectively. We are aware of that these three principal compo-nents are bipolar since the modulated eigen-spectra can either be added to or subtracted from the DC bias. As a consequence, four major axes reveal the momentous directions of the color render-ings according to the spectral characteristics of the ME EPD. The linear projections onto the rest of eigenvectors are negli-gible due to the almost zero contribution of the eigenvalues.
In this case, two sets of sample colors were particularly se-lected to evaluate the predicting performance of the PCA-based model. One set was made up of a 5 5 5 grid sampling the entire color-gamut with all the combinations of intensity levels ranked in 3, 6, 9, 12, and 15 (full color-gamut data). The other set included 27 dark colors from all the changes of the least three intensity levels in each RGB channels (dark image data). The measured spectra and tristimulus of both sample sets were introduced to analyze the influence of the numbers of principal
Fig. 5. The first six eigenvectors and the mean derived from the reflectance spectra of the micro-encapsuled EPD sample set. The first eigenvector including 97% total variance represents the neutral colorant spectrum due to the RGBW pixel layout and driving algorithm. The physical features of chromatic spectra are explained in the second to the forth components by a pair of complimentary primary color.
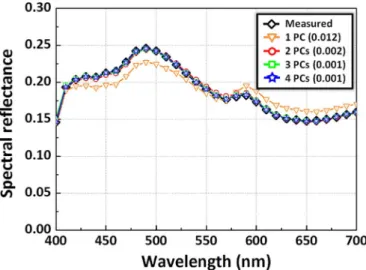
Fig. 6. Comparison of measured spectral reflectance (black line with diamond symbol) with predicted ones from utilizing different numbers of the principal components (from one to four marked with the symbol order of triangle, circle, square and star). The spectral performances evaluated by RMS are listed in the figure as well.
components whose optimal results depend on the spectral and colorimetric accuracy. The spectral accuracy was quantified by the root-mean-square (RMS) error between measurement and estimation. Fig. 6 illustrates one of the measured reflecting spectra and its corresponding estimated spectra with different numbers of eigenvectors. Although one eigenvector is capable of offering 97% of total variance, the performed spectral fit (marked as triangle symbol, ) is obviously worse than those applied plural eigenvectors. In other words, the neu-tral colorant spectrum cannot represent the full result without
TABLE II
COMPARISON OFCOLORIMETRICPERFORMANCE(CIEDE2000 COLOR DIFFERENCE) AMONGDIFFERENTNUMBERS OFPRINCIPALCOMPONENTS FOR
FULL-COLORMICRO-CAPSULEEPD PREDICTED BYPCA-BASEDMODEL. TWOSETS OFTESTINGCOLORSWEREINVOLVED. ONESETIS125-COLORS SPANNING INFULLCOLOR-GAMUT OFME EPD,AND THEOTHERIS ASET OF
27 COLORS INDARKIMAGE
any chromatic information. The colorimetric performances specified by CIEDE2000 color difference formula are listed in Table II. The statistic results of predicting accuracies for the full color-gamut data are superior to those of the dark image data. The errors in the end are easily induced when estimating the samples with low input levels due to intrinsically bad reflectance of ME EPD. In addition, employing three or more PCs have even higher colorimetric performance
than two or less PCs despite excellent spectral
accuracy for a predicting model with two PCs .
The fact also implies that three principal components are suffi-cient in the ME EPD while the skipped forth eigenvector carries the existence of bluish and yellowish data. As a consequence, the proposed model has been proved to uncover the spectral behavior for the complex full-color ME EPD.
IV. CONCLUSION
In this work we introduced the principal component analysis to characterize the colorimetric performance by multiple
pig-ments scenario of an EPD. By factorization of a spectral re-flectance set into orthogonal eigenvector basis, we are able to identify the principal directions that a set of reflectance spectra oriented. The first few eigenvectors uncovers the reflectance and scattering features of a set of colorants from their combination. Taking a two-particle type micro-cup EPD with vertical elec-tric field as a case study, the first three eigenvectors closely re-semble the spectral transmittance of RGB color filter. In other words, if the profiles of spectral transmittance of color filters can be narrowed and sharpen, the EPD based on this structure will achieve more saturated color. For a case of full-color micro-en-capsulated EPD, the first four principal components reveal the correspondingly physical features based on driving algorithm: one neutral colorant spectrum and three chromatic spectra com-posed of complimentary pairs. Obviously, the EPD utilizing RGBW pixel layout exhibits the weakness of color saturation unless minimizing either the boosting signals or the pixel area of white channel. Subtracting from the mean causes the posi-tive and negaposi-tive values of the eigenvectors. The spectra mod-ulation about the mean exhibits a ripple effect in higher order eigenvectors.
The PCA-based analysis still leaves many opportunities open and clearly more research must be carried out to explore its potential in full. First of all, all the calculation mentioned here is based on the spectral reflectance. The reason is due to that most available e-Paper displays are monochrome integrated with color filter on top at this moment. As each subpixel is filled with dye fluid or with different color pigment, the discussion of spectral absorptance shall be involved. According to the prior study [27], spectral absorptance is more consistent with linear space for the pigments transposition system. Second, PCA makes a strong assumption that the new (i.e., eigenvector) coordinates are mutually orthogonal. Opponent spectral com-ponents are used to estimate the underlying features from the colorant-mixture information. However, neither RGB nor CMY colorant is absolutely orthogonal in spectral reflectance or ab-sorptance. Independent component analysis (ICA) seems to be more adequate in the spectral analysis in color characterization of a composite mixing system.
ACKNOWLEDGMENT
The authors would like to particularly appreciate P. Yang, J.-M. Hung, and B. Hsieh from SiPix Technology Inc., and S. Huang from E Ink for their technical supports and kind help.
REFERENCES
[1] I. Ota et al., “Electrophoretic image display (EPID) panel,” Proc. IEEE, vol. 61, no. , pp. 832–836, 1973.
[2] B. Comiskey et al., “An electrophoretic ink for all-printed reflective electronic displays,” Nature, vol. 394, pp. 253–255, 1998.
[3] M. T. Johnson et al., “High-quality images on electrophoretic dis-plays,” J. Soc. Inf. Display, vol. 14, p. 175, 2006.
[4] C.-M. Lu et al., “Performance active matrix micro-cup electrophoretic display,” in SID Symp. Dig., 2009, vol. 40, p. 1501.
[5] E. Kishi et al., “Development of in-plane EPD,” in SID Symp. Dig., 2000, vol. 31, p. 24.
[6] A. R. M. Verschueren et al., “Optical performance of in-plane elec-trophoretic color e-paper,” J. Soc. Inf. Display, vol. 18/1, p. 1, 2010.
[7] N. Hiji et al., “Novel color electrophoretic E-paper using independently movable colored particles,” in SID Symp. Dig., 2012, vol. 43, p. 85. [8] J. Heikenfeld et al., “Electrofluidic displays using Young-Laplace
transposition of brilliant pigment dispersions,” Nat. Photon., vol. 3, no. 5, pp. 292–296, 2009.
[9] S. Yang et al., “High reflectivity electrofluidic pixels with zero-power grayscale operation,” Appl. Phys. Lett., vol. 97, p. 143501, 2010. [10] J. C. Jones et al., “Novel configuration of the zenithal bistable nematic
liquid-crystal device,” in SID Symp. Dig., 1998, vol. 29, p. 858. [11] Y. Asaoka et al., “Polarizer-free reflective LCD combined with ultra
low-power driving technology,” in SID Symp. Dig., 2009, vol. 40, p. 395.
[12] R. A. Hayes et al., “Video-speed electronic paper based on electrowet-ting,” Nature, vol. 425, no. 6956, pp. 383–385, 2003.
[13] K. Zhou et al., “A full description of a simple and scalable fabrication process for electrowetting displays,” J. Micromechan. Microeng., vol. 19, no. 6, pp. 1–12, 2009.
[14] J. Heikenfeld et al., “Review paper: A critical review of the present and future prospects for electronic paper,” J. SID, vol. 19, no. 2, pp. 129–156, 2011.
[15] R. S. Berns, “A generic approach to color modeling,” Color Res. Appl., vol. 22, pp. 318–325, 1997.
[16] J. Heikenfeld, “A new bi-primary color system for doubling the re-flectance and colorfulness of e-paper,” in Proc. SPIE, 2011, Advances in Display Technologies; and E-papers and Flexible Displays, p. 795608.
[17] H. R. Kang, Color Technology for Electronic Imaging
De-vices. Bellingham, WA: SPIE Press, 1996.
[18] F. H. Imai et al., “Principal component analysis of skin color and its ap-plication to colorimetric color reproduction on CRT display and hard-copy,” J. Imag. Sci. Technol., vol. 40, pp. 422–430, 1998.
[19] D.-Y. Tzeng et al., “A review of principal component analysis and its applications to color technology,” Color Res. Appl., vol. 30, pp. 84–89, 2005.
[20] Q. Du et al., “Low-complexity principal component analysis for hyper-spectral image compression,” Int. J. High Performance Comput. Appl., vol. 22, no. 4, pp. 438–448, 2008.
[21] K. Pearson, “On lines and planes of closest fit to systems of points in space,” Phil. Mag. A, vol. 6, pp. 559–572, 1901.
[22] I. T. Jolliffe, Principal Component Analysis, 2nd ed. New York, NY, USA: Springer, 2002.
[23] B. Moore, “Principal component analysis in linear systems: Controlla-bility, observaControlla-bility, and model reduction,” IEEE Trans. Autom.
Con-trol, vol. AC-26, pp. 17–32, 1981.
[24] G. Strang, Introduction to Linear Algebra, 4th ed. Wellesley, MA, USA: Wellesley Cambridge, 2009.
[25] P. Green et al., Colour Engineering—Achieving Device Independent
Colour. Chichester, U.K.: Wiley, 2002.
[26] Y. Kwak et al., “Generating vivid colors on red-green-blue-white elec-tonic-paper display,” Appl. Opt., vol. 47, pp. 4491–4500, 2008. [27] Y.-H. Lu et al., “Colorimetric characterization of monochromatic
micro-cup electrophoretic display,” in SID Symp. Dig., 2011, vol. 42.
Yen-Hsing Lu received the B.S. degree in communication engineering from
National Chiao Tung University, Taiwan in 2004. He is currently a Ph.D. can-didate in the Institute of Electro-Optical Engineering at National Chiao Tung University. His current researches are the colorimetric characterization for novel electronic printing device.
Chung-Hao Tien received the B.S. degree in communication-engineering and
the Ph.D. degree in electro-optical engineering from National Chiao Tung Uni-versity (NCTU), Hsinchu, Taiwan, in 1997 and 2003, respectively.
After working as a research assistant at University of Arizona (2001) and a Post-Doctoral Fellow at Carnegie Mellon University (2003), he joined NCTU as an assistant professor in the Department of Photonics. His research work was in the area of computational imaging, free-form optics, display, and lighting optics.