行政院國家科學委員會專題研究計畫 成果報告
子計畫四:巨觀動態車流模型開發與驗證(II)
計畫類別: 整合型計畫
計畫編號: NSC94-2218-E-009-018-
執行期間: 94 年 08 月 01 日至 95 年 07 月 31 日
執行單位: 國立交通大學運輸科技與管理學系(所)
計畫主持人: 卓訓榮
報告類型: 精簡報告
處理方式: 本計畫可公開查詢
中 華 民 國 95 年 11 月 5 日
Ramp Metering Control on the Junction of Freeway
and Separated Connecting Collector-Distributor Roadway
HSUN-JUNG CHO and GEORGE C.P. TSAI
Department of Transportation Technology and Management
National Chiao Tung University,
1001 Ta Hsuch RD., Hsinchu
TAIWAN
hjcho@mail.nctu.edu.tw
Abstract: -Ramp metering has been emerged as an effective freeway control approach to ensure efficient
freeway operations. The performance of ramp metering depends on various factors, such as traffic flow, downstream traffic conditions, and queue override policy. This paper proposes a linear approach for designing local demand-capacity ramp controls using simulation model. This study investigates the macroscopic simulation equation models of ramp metering signal timing plan on the freeway and separated connecting collector-distributor roadway of the junction section on Taiwan National Freeway Systems. The main analysis will be based on these driver behaviors including compulsive lane-changing and about 50% weaving activities on the separated connecting collector-distributor roadway. The ramp metering control is to optimize freeway mainline traffic by providing metering rates for accesses within the control segments. The results of this study show that well-designed ramp metering control not only increase the freeway mainline traffic flows and speed, but also prevents traffic breakdown.
Key-words: Ramp metering control, Signal timing, Metering rates, Demand-capacity ramp control.
1 Introduction
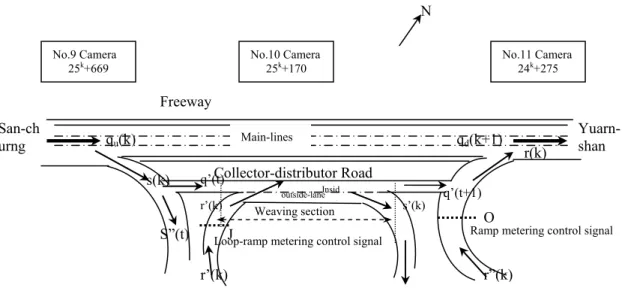
Ramp metering has been proved to be suitable as a tool for reducing or avoiding rat-running traffic in the adjacent road network [1], but in fact, it can also be used for reducing or avoiding congestion on freeways. A typical separated connecting collector-distributor (C-D) roadway weaving section is shown in Fig. 1 which is very common on Taiwan national freeway systems. The separated connecting C-D roadway weaving section has been defined in the 1965 HCM [2], and the benefits on this type of C-D roadway weaving sections are:
1. To reduce the weaving and lane-changing activity rates at main lanes on freeways.
2. To increase the traffic safety at main lanes on freeways.
3. To enhance the traffic speeds and traffic flows at main lanes on freeways.
The most widely implemented freeway traffic control is entrance ramp control. Its objective is to eliminate or to reduce the operational problems resulted from freeway congestion [3]. Wattleworth and Berry (1965) [4] applied linear programming method to achieve the control optimal.
The continuum traffic stream model of Payne (1971) [5], belonging to the macroscopic simulation, is a linear dynamic model with a quadratic objective function constructed for integrated-responsive
ramp-metering control. The purpose of studying freeway ramp metering control is beneficial to the system in terms of total timesaving, e.g., the ramp metering control applied dynamic optimal process to minimize the total travel time in the system [6].
This paper proposes a model includes dynamic traffic and linear approach to design demand-capacity ramp metering algorithms. The presented model is based on macroscopic simulation equation.
2 Traffic Dynamics
The local traffic dynamics of the location considered herein (Fig. 1) includes three parts: freeway traffic dynamics, separated connecting C-D roadway traffic dynamics, and queue dynamics on the ramps that link the separated connecting C-D roadway and the freeway. It is assumed that the traffic behavior follows Lighthill-Witham-Richard (LWR) theory [7], i.e.
0
/
/
∂
+
∂
∂
=
∂
q
x
k
t
)
(
)
(
k
f
k
u
k
q
=
∗
=
where x, t; q, u and k are denoted as space, time, flow rate per lane, space mean speed, and traffic density.
respectively. u(k) is defined by some empirical speed-density relationship that gives rise to an exposition the triangular flow-density relationship proposed by Newell (1991) [8]: c
k
k
if
k
vf
q
=
(
),
≤
c jam k if k k k c q = ( − ), ≥where v is the free flow travel speed, c is the wave speed traveling in a direction against the traffic stream, kc is the critical density, and kjam is the jam density.
2.1 Freeway Traffic Dynamics
Consider a multiple lane (λ) freeway section with a single entry and exit ramps, as shown in Figure 1. It is assumed that at time slice n, traffic flow from upstream boundary enters a given section with flow rate of qu(n), and some traffic flow from entry ramp also enter the given section with flow rate r(n). Then, traffic flow discharges at the downstream boundary with flow rate of qd(n), and traffic flow diverts to the exit ramp with flow rate s(n). According to the law of conservation, the number of vehicles in this freeway segment at time n+1, Q(n+1) follows the relation in equation (1): )) ( ) ( ) ( ) ( ( ) ( ) 1 (n Qn t q n q n rn sn Q + = +∆ λ u −λ d + − (1) Define vehicle concentration (section density) as
k(n) = Q(n) / (λ∆x) where ∆x is length of the road
segment. Equation (1) can now be written in terms of density:
λ
λ
(
)
/
/
)
(
)
(
/
)(
(
)
(
)
(
)
1
(
n
s
n
r
t
x
q
n
q
n
n
k
n
k
u d−
+
+
∆
∆
−
=
+
(2) implicit flow-density relationship. We assume in this relationship between traffic flow and density is q =f(k), which is generally referred to as the fundamental
diagram of traffic flow. If we substitute q = f(k) into equation (2), and define α = ∆t/∆x, we obtain:
k
(
n
1
)
(
/
k
(
n
)
r
(
n
)
f
(
/
k
))
s
(
n
)
q
u(
n
)
∗
−
∗
−
∗
+
∗
+
=
+
λ
α
λ
α
α
α
(3)With initial condition k(0) = k0 equation gives a complete description of the freeway flow process. Applying control system terminology, traffic density
k(n) is called a state variable. Ramp metering rate r(n)
is a control variable, and freeway boundary inflow qu is a disturbance input.
2
.2 Separated Connecting C-D Roadway
Traffic Dynamics Sub-subsection
It is assumed that the traffic flow of separated connecting C-D roadway conforms to LWR equation with appropriate flow-density relationship. Under this assumption, the traffic dynamics can be represented in discrete form:
)) ( ' ) ( ' '( ' '( ) ' '( ) ) ( ' ) 1 ( ' n s n r t q n q n n Q n Q u d − + +∆ − = + λ λ (4)
Fig. 1. The configuration of C-D road weaving
section on the Taipei junction
San-churng
J O
Loop-ramp metering control signal Ramp metering control signal
Yuarn-shan Weaving section outside-lane Insid t Main-lines Collector-distributor Road Freeway N No.9 Camera
25k+669 No.10 Camera 25k+170 No.11 Camera 24k+275
qu(k) qd(k+1) s(k) r(k) r’(k) s’(k) r”(k) S”(t) r’(k) q’(t) q’(t+1)
'
/
)
('
'
/
)
('
)
/'
('
'
(
)
'
(
)
('
)
1
('
λ
λ
s
n
n
r
n
t
x
q
n
q
n
k
n
k
u d−
+
+
∆
∆
−
=
+
(5)2.3 Ramp/Loop-ramp Traffic Dynamics
Traffic dynamics is influenced by two factors—drivers' diversion behavior, and queuing. It is assumed the portion of the demand q(n) diverted from ramp in time interval n, δq(n), is given by:
)
(
))
(
(
)
(
n
h
d
n
q
n
q
=
δ
(6) Whereh
(
d
(
n
))
=
d
(
n
)
/
dm
,0
≤
d
(
n
)
≤
dm
The second input to ramp traffic dynamics is queuing, which can be described by the following difference equation: )) ( ) ( ) ( ( ) ( ) 1 (n d n T q n r n q n d + = + − −δ (7)
Finally, the ramp metering rates of the controlled ramp cannot be more than the traffic demand or are negative, and this limitation condition is shown as equation (8): T n d n q n q n r( ) ( ) ( ) ( )/ 0≤ ≤ −
δ
+ (8)Equations (1) – (8) complete the governing equations of local traffic-responsive ramp metering control traffic dynamic.
3 Ramp Control Objectives
The objective of the presented local automatic ramp metering control is to keep the level of service of the controlled freeway segments at a desired level of service. In order to achieve the objective, density should be kept at a small range around a critical density. Since the traffic condition is dependent on the density, k(n) should follow a target kd ∈ [kc – ε,
kc + ε], where kc is the critical density and ε is a user-defined parameter [6].
3.1 Selected the Ramp Metering Control Law
If r(n) > λf(k(n)), traffic density k(n) will increase.
After some time, it will reach jam density and traffic will completely block. Congestion can be prevented if applying the following ramp metering law [6]:
)))
(
(
)
(
(
/
)
(
n
k
k
n
f
k
n
r
=
λ
α
∗
d−
+
α
∗
(9)When these inflow are known, a control similar to (6) can be used to keep traffic density
approximately the target density
kd.r(n)=λ/α∗(kd−k(n))+λ(f(k(n))−qu(n)) (10)
The ramp control objective in this study is to maintain traffic density around a desired target value, which is equivalent to minimizing the difference between the observed density and the target density:
∑
−
n dk
n
k
(
))
2(
2
1
min
(11) The density k(n) is generated by (3). The equation (9) is to place constraints on the minimization problem. To train the local ramp metering controllers, the following nonlinear optimization problems must be solved [6]:∑
−
n dk
n
k
(
))
2(
2
1
min
and∑
−
n dn
k
k
'
'
(
))
2(
2
1
min
Subject to:)
/
)
(
/
)
(
)
/
(
(
)
(
)
(
)
1
(
λ
λ
s
n
n
r
n
t
x
q
n
q
n
k
n
k
u d−
+
+
∆
∆
−
=
+
)'
/
)
('
'
/
)
('
)
/'
('
('
)
('
)
('
)
1
('
λ
λ
s
n
n
r
n
t
x
q
n
q
n
k
n
k
u d−
+
+
∆
∆
−
=
+
))
(
))
(
(
(
))
(
(
/
)
(
n
k
k
n
f
k
n
q
n
r
=
λ
α
d−
+
λ
−
u )) ('(' )) (' ( (' )) ' (' /' ) (' n qk n f k n k n r u d −− + =λ
α
λ
)) / ) ( ( ) ( ( ) ( 2 jam f u n v k n k n k q = − )) ' / ) ( ' ( ) ( ' ( ' ) ( ' 2 jam f u n v k n k n k q = −))
(
'
(
)
(
0n
f
r
n
C
=
0
))
(
(
)
(
n
=
f
C
n
≥
g
(12)where vf and vf’ are the speed of freely flowing traffic and kjam and kjam’ the jam density, on the freeway and C-D roadway, respectively. And the g(n) is the green time of ramp metering control signal, by second, in n time period. C0(n) is the optimum cycle time of ramp metering control signal, by second.
))
(
1
/(
)
5
5
.
1
(
)
(
0n
L
Y
n
C
=
+
−
(13) WhereL = is the total lost time in the cycle, assume 2
seconds with a 3 seconds amber period [9].
Y = is the ratio of ramp metering flow to mainline
flow capacity.
n = time intervals of ramp metering control, n=1,2,3,…….N.
The cycle time (C0) for the ramp metering rate, which determining the effective green time for the signal phase at the ramp, will be
))
(
)(
(
/
)
(
)
(
n
y
n
Y
n
C
0n
g
=
(14) Where y(n) is the ratios of ramp and loop-ramp entrance flow to mainline of freeway flow capacity and C-D roadway flow capacity. This study develops a demand-capacity ramp metering control simulation equation to perform quasi-on-line training of the local ramp metering controllers. The model is based equation (3) with a fundamental diagram proposed by Greenshields (1934) [10]: )) / ) ( ( ) ( ( ) ( 2 jam f u n v k n k n k q = − (15)where vf is the speed of freely flowing traffic, and kjam the jam density.
3.2 The Algorithm of Ramp Metering ontrol
Model
The details of this algorithm are described below: Step 1: Initialize r, r', k, k', g, and C.
Step 2: Use equation (9) to obtain ramp /loop-ramp inflow r(n) and r’(n).
Step 3: Get separated connecting C-D roadway and freeway inflow qu’(n) and qu(n), respectively, and calculate density k’(n+1) based on r’(n) and qu’(n).
Step 4: Calculate the C0(n) and g(n).
Step 5: Update according to (10) and set k’(n) =
k’(n+1) and k(n) = k(n+1). If n-1 = N, stop.
Otherwise, return to Step 2.
4 Application of Ramp Metering
Control Models
To investigate the impact of ramp metering on the separated connecting C-D roadway traffic conditions, it was decided to apply in weekly alternation ramp metering and no control, respectively over the period from the morning rush hour 07:00 to 09:00. Total 120 minutes on May 20, and November 22, 2002, and to perform subsequently a comparative evaluation of the corresponding traffic conditions.
Ramp metering was applied only to one on-ramp and one on-loop-ramp at the separated connecting C-D roadway and freeway on Taipei junction. Note, however, that the highest inflows into the considered stretch of Taipei originated from the local arterials, and from the upstream of the end of the stretch, and all of them remained uncontrollable in this study. Under these conditions the controllability level of traffic flow in the Taipei junction via ramp metering is fairly limited.
4.1 Demand-Capacity Metering
Demand-capacity control features the selection of metering rates on the basis of a real-time comparison of dynamic upstream demand flow and downstream capacity. The dynamic upstream demand flow is measured in real time and compared with either a dynamic value of downstream capacity determined from a real-time value computed from the downstream flow and gap measurements. To be most effective, the downstream capacity used should account for the effects on capacity of weather conditions, traffic composition, and incidents.
The difference between the dynamic upstream demand flow and the downstream capacity is then determined and used as the allowable entrance ramp demand flow. This ramp demand flow is expressed as a metering rate to be used during the next control interval (usually 1 minute). If the dynamic upstream demand flow is greater than the downstream capacity, a minimum metering rate is used. Of course, theoretically, if the dynamic upstream demand flow were greater than the downstream capacity, a zero metering rate, or ramp closure, should be used in order to prevent congestion [3].
4.2 Available Data and Numerical Case
Study Results
Parameters of this model are given in Table 1 [11,12]. The target densities are set as kd = 168.31 veh/km on freeway, and k’d = 75.75 veh/km on separated connecting C-D roadway. The traffic speed is chosen as vramp and vloop-ramp = 40 km/hr and capacity flow is
qm = 1750 veh/hr/ln on the ramp and loop-ramp roadway. The minimum ramp metering rate is rmin = 180 veh/h/r [13]. The outputs of this case are as follows: the optimal cycle time is 23 seconds, yellow time is 5 seconds, and green time on the loop-ramp and ramp signal are 14 seconds and 5 seconds, respectively. Other outputs of traffic flow variables are shown in the Table 2 and Fig. 2 and 3.
Table 1. The parameters of the ramp metering control model
Items Freeway C-D roadway Remark
Free-speed
(kilometers per hour) 110 60
ramp/Loop—ra mp speed is 40 mkph
Average speed
(kilometers per hour) 72.26 24.41 Average density
(vehicles per
kilometer) 76.04 80.18
Jam density (vehicles
per kilometer) 175.73 110.88 Critical density
(vehicles per
kilometer) 104.85 55.74
Capacity (pcu per
hour per lane) 2350 1750
Number of lanes 3 2 C-D roadway includes one auxiliary lane Noted: The value of parameters referred
Cho, Hsun-Jung and George C.P. Tsai (2002, 2004, and 2005).
Table 2. The traffic flow characteristics compare with vs. without ramp metering control on the study site Freeway C-D roadway Control items Flow items With control Without control Increase or decrease (%) With control Without control Increase or decrease (%) Average traffic flow (vph) 6532 4416 +47.92 2255 2494 -11.41 Average traffic density (vpkm) 127.05 147.27 -13.73 40.91 66.82 -38.77 Average traffic speed (kmph) 51.37 42.89 +19.77 55.71 27.39 +50.99 Noted: 1. vph = vehicles per hour.
2. vpkm = vehicles per kilometer. 3. kmph = kilometers per hour.
5 Conclusion
In this research, the primary objective is to present some general properties about the effectiveness of ramp metering along a congested freeway and separated connecting C-D roadway, which taking into account queuing, traffic entrance traffic dynamics. It is shown that optimal ramp/loop-ramp control policies depend on both of the traffic entrance propensities and the different traffic conditions constructed by freeway and C-D roadways. The simulation model may be considered highly efficient. The developed model has shown that under the right conditions, i.e., the traffic is heavy for the entrances of a freeway or a separated connecting C-D roadway, ramp metering can be very helpful to the freeway mainline traffic control. Although ramp metering may increase delays and queues to the ramp traffic, this can actually promote the use of the network efficiently.
Acknowledgement
This research was partially supported by the Ministry of Education, Taiwan, R.O.C. Program for Promoting Academic Excellent of Universities under grant number EX-91-E-FA06-4-4 and partially support by National Science Council, Taiwan, R.O.C. under grant numbers NSC-94-2218-E-009-014, and NSC-94-2218-E-009-018.
References:
[1]Habib Haj-Salem, and Marcos Papageorgiou, Ramp metering Impact on Urban Corridor Traffic: Field Results, Transportation Research, Vol. 29A, No. 4, 1995, pp.303-319.
With control Without control
Fig. 2 Traffic flow compare with vs. without ramp metering control on freeway mainline
Fig. 3 Traffic speed compare with vs. without ramp metering control on C-D roadway
With control Without control
[2]Highway Capacity Manual, Special Report 87, TRB National Research Council Washington D.C., Chapter 7, 1965, pp.160~186.
[3]Wilshire, R., R. Black, R. Grochoske, and J. Higinbotham, Traffic Control Systems Handbook, U.S. Department of Transportation, Federal Highway Administration Office of Implementation, Washington, D.C., 20590, 1985, pp. 4.11-4.31.
[4]Wattleworth, J. A. and D. S. Berry, Peak-Period Control of a Freeway System-Some Theoretical Investigations, Highway Res. Rec. Vol. 89, 1965, pp.1-25.
[5]Payne, H. J., Models of freeway traffic and control, Mathematical Models of Public Systems, No.28, Simulation Council Proc. Simulation Council, 1971, pp.51-61.
[6]Zhang, H. Michael, and Stephen G. Ritchie, Freeway Ramp Metering Using Artificial Neural Networks, Transportation Research, Vol. 5C, 1997, pp.273-286.
[7]Lighthill, M. J. and G. B. Whitham, On Kinematics Waves II. A Theory of Traffic Flow on Long Crowded Road, Proceeding of Royal
Society, Vol. A229, 1955, pp.317-345.
[8]Newell, G. F., A Simplified Theory of Kinematic waves: I General Theory; Ⅱ Queuing at Freeway Bottlenecks; Ⅲ Multi-Destination Flows,
Transportation Research, Vol. 27B, 1991,
pp.281-313.
[9]Webster, F. V. and B. M. Cobbe, Traffic Signals, Road Research Laboratory, Ministry of Transport, Road Research Technical Paper No. 56, 1966. [10]Greenshields B. D., A Study of Traffic Capacity.
Highway Research Board Proceedings, Vol.14,
1934, pp. 448-478.
[11]Cho, Hsun-Jung and Tsai, George C.P., The Behavior Analysis on a New Type Weaving Section, Journal of the Eastern Asia Society for
Transportation Studies, Vol. 6, 2005, pp.
1570~1081.
[12]Cho, Hsun-Jung and Tsai, George C.P., Capacity Analyzed on the New Weaving Sections, Submitted to Journal of the Chinese Institute of
Engineers, 2005.
[13]Blumentritt, C. W., C. Pinnell, W. R. Mccasland, D. W. Ross, and J. Glazer, Guidelines for Selection of Ramp Control Systems,
Transportation Research Board, National
Research Council, National Cooperative Highway research Program Report 232, 1981.