行政院國家科學委員會補助專題研究計畫成果報告
※※※※※※※※※※※※※※※※※※※※※※※※※
※ ※
※ 室內環境因素對二手菸之影響 ※
※ ※
※※※※※※※※※※※※※※※※※※※※※※※※※
計畫類別:
þ
個別型計畫 □整合型計畫
計畫編號:NSC 89-2320-B-039-017-
執行期間:88 年 08 月 01 日至 89 年 07 月 30 日
計畫主持人:郭憲文 教授
本成果報告包括以下應繳交之附件:
□赴國外出差或研習心得報告一份
□赴大陸地區出差或研習心得報告一份
□出席國際學術會議心得報告及發表之論文各一份
□國際合作研究計畫國外研究報告書一份
執行單位:中國醫藥學院 環境醫學研究所
中 華 民 國八十九年九月三十一日
行政院國家科學委員會專題研究計畫成果報告
室內環境因素對二手菸之影響
Effect of envir onmental factor s for exposur e to ETS in indoor air
計畫編號:NSC
89-2320-B-039-017-執行期限:88 年 8 月 1 日至 89 年 7 月 31 日
主持人:郭憲文 中國醫藥學院 環境醫學研究所
計畫參與人員:楊日昇 中國醫藥學院 環境醫學研究所
Abstr act
The objective of this study was to monitor the nicotine concentration and particulate size of twelve brands of cigarette using a smoking chamber that was used to simulate environmental tobacco smoke (ETS). All 12 brands of cigarette are commonly used in Taiwan: six are local brands and six are imported brands. Particulate size was monitored every minute using a QCM cascade impactor, which can measure a range of 0.05-25µm. XAD-4 absorbent was used to collect the gaseous nicotine. Measurements from each brand of cigarette were triplicated. Mean nicotine
among six local brands (mean = 19.79µg/m3
) had higher levels of nicotine than six
imported brands (mean = 12.15µg/m3
). Measured nicotine concentrations were consistent with levels indicated on the packet. Mass median diameter (MMD) of the particulates among local and imported brands ranged from 0.39-0.53µm and 0.33-0.41µm, respectively. Particulate concentrations for both local and imported brands peaked at 0.1µm and 0.4µm, but for sizes over 0.8µm, particulate concentration was negligible. Cigarettes were burned in the smoking
chamber for 20 minutes and particulate concentration was monitored every minute.
Generally, particulate concentration
decreased after seven minutes (with the exception of two local brands), and imported brands had higher particulate concentration than local brands. The authors conclude that nicotine concentration is dependent on brand and that cigarettes produce particulates which are easily inhaled and which may readily lodge in the alveoli.
Keywords: Nicotine concentration;
Particulate size; Environmental tobacco smoke (ETS)
1. Introduction
In 1997 the Taiwan government introduced a law prohibiting smoking in public buildings. There is a need, therefore, to evaluate the impact on health of ETS. According to the U.S. Environmental Protection Agency (U.S. EPA), ETS is a human lung carcinogen and was responsible for about 3000 lung cancer deaths among American non-smokers in 1992. Lung cancer is the most common form of cancer in Taiwan. However, there is no available data regarding exposure of ETS in Taiwan. With the legalization of importing foreign brands of cigarettes into Taiwan in 1987, tobacco consumption increased from 28.21% in 1986, to 32.5% in 1990. Kuo (2000) surveyed 1726 workers (randomly selected from a databank of 7,597,386 workers), and found that 47.5% of males and 6.0% of females were smokers. Also, males consumed an average of 13.6 cigarettes per day (female = 8.7). In 1990, Yang estimated the annual economic loss caused by smoking-related illness in Taiwan to be approximately $NT 145 billion ($US 4.5 billion). In addition, 11.5% of deaths among males was attributable to smoking. The
Department of Health (DOH) has enforced the regulation that every brand of cigarette sold in Taiwan must display levels of nicotine and tar on the packet.
Nicotine is a potential marker for ETS because it is unique to tobacco smoke and is a major constituent of the smoke (Hammond et al., 1987). Willemsen (1997) investigated airborne concentration of nicotine in an office where smoking was permitted.
Nicotine levels ranged from 0.4-37.3µg/m3.
In a similar study, Trout (1998) reported that the mean airborne concentration of nicotine
in a casino was 8µ g/m3. It is important to
note that airborne nicotine may be present in two forms: gaseous and particulate. Hager and Nissner (1996) reported that gas-particle mixtures of nicotine are generated in different ways. The characterization of these mixtures was accomplished using physical methods to measure particle concentration and size. Using different test systems, it was found that nicotine-containing aerosol was only formed when the carrier particle was of an acidic nature and the nicotine was attached as a salt. Ultraviolet absorbing
particulate matter (UVPM) and fluorescing particulate matter (FPM) may be used as particulate markers for ETS exposure (Carson and Erikson, 1988; Ogden et al.,
1996). LaKind (1999) investigated
distributions of doses of selected ETS-related chemicals among non-smoking workers. The MMD of the UVPM peaked at 0.2µm and 0.4µm, for smoking workplace and smoking home. Particulates of these sizes are readily inhaled and may become lodged in the alveoli, which presents a significant health hazard. In the current literature there is little data with regard to the concentrations of gaseous nicotine, particulate and MMD for different brands of cigarette. As such, the objective of the current study was to monitor
gaseous nicotine concentrations and
particulate sizes of twelve cigarette brands in a smoking chamber.
2. Mater ials and Methods
Twelve brands (six imported, six local) of the most popular cigarettes consumed in Taiwan were selected and data concerning nicotine and tar levels (from information provided on the labels shown in Table 1) was
recorded. Figure 1 shows the smoking chamber used. An air cylinder provided the air that was regulated using a rotameter. The humidity of the air entering the smoking chamber (containing a burning cigarette) was controlled using an impinger containing water. The resultant air was then monitored by a real time instrument (Model PC-2 Quartz Crystal Microbalance (QCM), pump flow rate = 0.24 l/m) which measured particulate size. Particulates were categorized into ten stages (0.05, 0.10, 0.20, 0.40, 0.80, 1.6, 3.2, 6.4, 12.5 and 25.0µm), using 50%
cut-off size (Dp50). At the same time, a
pump (flow rate = 1.7 l/m) drew air into a
PTFE filter (37mm, pore size of 1µm, Cat #
LZ0103750, Omega Specialty Inst. Co.) and
nicotine was collected using XAD-4
adsorbent. Each brand of cigarette was tested three times, each time for twenty minutes.
To assess levels of nicotine, placing the sample, after each measurement, into a vial containing 1ml of acetic ester pretreated the XAD-4 adsorbent. For the internal standard, 100µl of quinonine were then added and mixed thoroughly. GC-NPD was used to
determine nicotine levels. The column used
was DB-WAX (30m*0.25mmID). The
temperature gradient started at 110℃ (for 2 min.), increasing by 20℃ per minute up to 150℃ (for 6 min.) and a further increase of 30℃ per minute up to 240℃ (for 1 min.). A calibration curve of nicotine was set up, with a range from 0.002mg/ml to 0.231mg/ml. The correlation coefficient was 0.9999 and the relative predictive deviation (RPD) was <6.3. The detection limit of nicotine was 0.874ng. The reproducibility was <1.79% and <6.3% for measurements taken at high
(184.91µg/ml) and low (4.62µg/ml)
concentrations, respectively. The stability of the sample was tested at two concentrations (0.18mg and 0.06mg nicotine spiked into the XAD-4 adsorbent) at room temperature and 4 ℃, and was tested at four periods (days 1, 4, 7, 14) over a two week period. The average recovery rate of nicotine ranged from 88.39-103.33%. The desorption efficiency of the acetic ester was tested at high and low concentrations (0.18mg and 0.06mg spiked into the XAD-4 adsorbent) and was found to
be 94.4% and 97.3%, respectively.
Particulate nicotine from PTFE filter was desorbed by a liquid/liquid extraction into heptane by adding 25 ml ammoniate heptane and stirred for an additional minute (for detailed description, see Hammond et al., 1987).
3. Results
Table 1 shows the six local and imported brands with regard to nicotine concentration and particulate size from results obtained in the smoking chamber. Tar and nicotine levels from information on the packet are also shown. Each brand of cigarette was tested three times and was allowed to burn in the smoking chamber for twenty minutes. Using XAD-4 tube to collect
nicotine, imported brands (12.15µg/m3) had
lower nicotine concentration than the local
brands (19.79µ g/m3). Also, there was a
higher variation of concentrations among
local brands (13.67µg/m3
to 26.58µg/m3
)
than among imported brands (7.69µg/m3 to
17.88µg/m3
). For both local and imported brands there was a positive correlation between nicotine levels on the packet and measured nicotine concentration (r = 0.94
and r = 0.89). A PTFE filter was used to collect the particulate before the air from the smoking chamber passed through the XAD-4 adsorbent. Overall, the concentration of the particulate nicotine (collected by the PTFE filter) was lower than gaseous nicotine (collected by XAD-4 tube). Imported brands had lower concentrations of particulate
(0.30µg/m3) than local brands (0.48µg/m3).
MMD was higher among local brands (range = 0.39µm to 0.53µm) than imported brands (range = 0.33µm to 0.41µm). There was greater variability of particulate size among local brands than among imported brands. There was also higher variation within each of the local brands compared to the imported brands. There were no correlations between particulate sizes and airborne nicotine concentrations.
Figure 2a shows the concentration of particulate for ten size categories for each of the six imported brands. Each brand was burned in the smoking chamber three times, each time for twenty minutes. Except for brand A4, there were two peaks at 0.1µm and 0.4µm, although particulate concentrations
varied between brands. Most particulate sizes were lower than 0.8µm. For A4, there were two peaks at 0.05µm and 0.4µm. Figure 2b shows the concentration of particulate for ten size categories for each of the six local brands. Overall, particulate concentrations showed a similar distribution to the imported brands, but local brands had higher particulate concentrations in each of the size categories up to 0.8µm. However, brands A12 and A8 only had one peak (0.4µm).
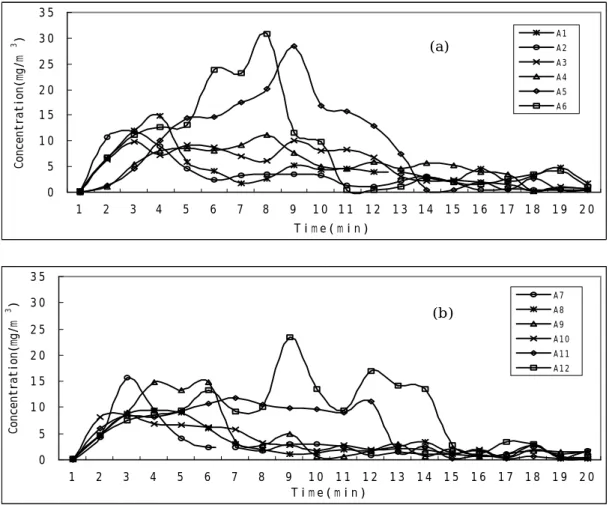
Figure 3a shows the particulate concentrations of imported brands measured every minute over a twenty-minute period. The size of all particulate measured was lower than 25µm. Generally, cigarettes burned out after about seven minutes. However, particulate concentration varied greatly between brands and over time. A5 and A6 peaked at 8 and 9 minutes, respectively, and decreased sharply after that. The other brands tended to peak around 4 minutes and decreased gradually over the remaining time. Figure 3b shows the particulate concentrations of local brands measured every minute over a twenty-minute
period. Particulate sizes were all lower than 25µm and cigarettes burned out after about seven minutes. As with imported brands, there was a high degree of variability between brands. A7, A8, A9 and A10 peaked before seven minutes and then decreased. However, A12 peaked several times and decreased at 15 minutes. A11 increased gradually until 12 minutes before decreasing sharply. For A11 and A12, particulate concentration was very similar to airborne nicotine vapor concentration.
4. Discussion
Exposure to environmental tobacco smoke (ETS) has been established as a risk factor for lung cancer and chronic obstructive pulmonary disease among non-smokers (Brownson et al., 1998). The risk that ETS poses to health is comprised of chemical
compounds, and minute particulates.
Hammond (1995) reported that almost 5000 of the compounds in cigarette smoke are known animal and human carcinogens, and that particulates are readily inhaled and may deposit in the alveoli. Hammond notes that the toxicity of compounds may vary in
relative concentrations in mainstream and sidestream smoke, the latter of which is a major compound of ETS and contributes to nearly all of the vapor phase and over half of the particulate matter. Other studies (Scherer et al., 1990; Siegel, 1993; Heloma et al., 2000) have measured gaseous nicotine concentrations in various locations such as the home, workplace and restaurant, but there is little data regarding nicotine and particulate levels between cigarette brands. Phillips (1997) used personal samplers to assess exposure of non-smokers to respirable suspended particles (RSP), ETS, nicotine and 3-ethenylpyridine (3-EP). Non-smokers who
worked with smokers in an office
environment were exposed to high levels of RSP, ETS particles, nicotine and 3-EP. However, the sizes of the particles were not measured. The cut-off point of RSP in the literature is generally less than 10um, which is inconsistent with the results of the current study, where most of the ETS particulates were below 0.8µm. The mechanism of ETS particulate production begins with the vapor phase, when the cigarette first starts to burn.
Then, as temperature decreases the vapor condenses and attaches to particulates. Hammond (1988, 1999) reported that the particle-phase nicotine levels converted to vapor-phase nicotine concentrations in two
stages. First, vapor phase nicotine
concentrations were converted to ETS particulate concentration by multiplying the concentration of the nicotine in the
composite samples by 92.4µg ETS
particles/µg particle-phase nicotine. Second, the concentrations of the ETS particles were divided by 8.6µg ETS particles/µg of vapor-phase ETS. UVPM, FPM and solanesol were used to represent particle-phase markers of ETS, and the ratios of the gravimetrically determined RSP to the surrogate standard concentrations of the UVPM, FPM and solanesol were 7.2, 42 and 38, respectively (Nelson, 1998). However, in the current study, there was no surrogate indicator of the ETS. Instead, particulate nicotine was directly measured using the PTFE filter. Particulate nicotine concentrations were considerably lower than gaseous nicotine concentrations. This may have been due to
the relatively large size of the pore in the PTFE filter (1um) which may have allowed some of the smaller nicotine particulates to go undetected.
Different brands of cigarette produced varying particulate concentrations over the duration of burning in the smoking chamber. Measurements were taken every minute for 20 minutes, and overall cigarettes burned out at 7 to 8 minutes. Four of the twelve brands produced high particulate concentration at 9 minutes, decreasing to low concentrations at 14 minutes. Possible reasons for these inter-brand differences include type of tobacco leaves used, the soil type in which the tobacco was grown and the additives with which the tobacco was treated. Also, Hager and Nissner (1996) reported that nicotine-containing aerosol was only formed when the carrier particle was acidic and the nicotine was attached as a salt. Furthermore, nicotine content in the aerosol remained unchanged when there were variations in the pH value of the surrounding atmosphere after particle generation. Nelson et al. (1998) compared the composition of ETS from nine countries.
Overall, per cigarette yields of RSP, CO, TVOC (total volatile organic compounds),
NO and NO2 were 14, 59, 41, 1.3 and 0.4
mg/cig., respectively. However, there were some significant differences between some countries. In the current study, imported brands had higher particulate concentrations than local brands, and this may have been due, in part, to the relative 'density' of the tobacco in the cigarettes: local brands tended to be loosely packed and may therefore have produced different particulate concentrations. Local brands' nicotine concentrations were higher than for imported brands. Nicotine concentrations displayed on the labels correlated significantly with the results from the collection of XAD-4 adsorbent for both imported (r = 0.94) and local brands (r = 0.89). The Taiwan DOH is currently encouraging local cigarette brands to decrease levels of nicotine. This may be achieved by cultivating species of tobacco with lower levels of nicotine and blending different species of tobacco in cigarettes. The Taiwan DOH has also implemented a ban on smoking in public buildings and has required
restaurants and bars to provide non-smoking areas for their customers. Since there is little data concerning the exposure of ETS in Taiwan, it is important to begin monitoring ETS levels and the effects of ETS exposure on health.
In conclusion, nicotine levels among local brands were higher than imported brands. Nicotine levels were consistent with levels indicated on the packet. MMD of the particulates among local and imported brands ranged from 0.39-0.53µm, and 0.33-0.41µm, respectively. Overall, ETS particulates were
under 0.8um. Particulate concentration
decreased after seven minutes and imported brands had higher particulate concentration than local brands. Nicotine concentration is brand-dependent and the sizes of the particulates produced can be easily inhaled and may present a health hazard if lodged in the alveoli.
5. References
Brownson, R.C., Alavanja, M.C.R.,
Caporaso, N., Simoes, E.J., Chang, J.C., 1998. Epidemiology and prevention of lung cancer in nonsmokers. Epidemiol. Rev. 20, 218-236.
Carson, J.R., Erikson, C.A., 1988. Results from survey of environmental tobacco smoke in offices in Ottawa, Ontario. Envrion. Technol. Lett. 9, 501-508. Hager, B., Niessner, R., 1996. On the
distribution of nicotine between the gas and particle phase and its measurement. Aero. Sci. and Technol. 26, 163-174. Hammond, S.K., 1999. Exposure of U.S.
workers to environmental tobacco smoke. Environ. Health Perspect.107/suppl, 329-340.
Hammond, S.K., Leaderer, B.P., Roche, A.C., Schenker, M., 1987. Collection and analysis of nicotine as a marker for environmental tobacco smoke. Atmos. Environ. 21, 457-462.
Hammond, S.K., Smith, T.J., Woskie, S.R., Leaderer, B.P., Bettinger, N., 1988. Markers of exposure to diesel exhaust and cigarette smoke in railroad workers. Am. Ind. Hyg. Assoc. J. 49, 516-522. Heloma, A., Kahkonen, E., Kaleva, S.,
Reijula, K., 2000. Smoking and exposure to tobacco smoke at medium-sized and large-scale workplace. Am. J. Ind. Med. 37, 214-220.
Kuo, H.W., Liang, W.M., Chen, C.F., 2000. Study on the demographic information and workplace among Taiwan workers.
Report on Taiwan Institute of
Occupational Safety and Health.
LaKind, J.S., Ginevan, M.E., Naiman, D.Q.,
M.L., Felter, S.P., Graves, C.G., Tardiff, R.G., 1999. Distribution of exposure concentration and doses for constituents of environmental tobacco smoke. Risk Analysis 19, 375-390.
Nelson, P.R., Conrad, F.W., Kelly, S.P., Maiolo, K.C., Richardson, J.D., Ogden,
M.W., 1998. Composition of
environmental tobacco smoke(ETS) from international cigarettes part Ⅱ :nine country follow-up. Environ. Inter. 24, 251-257.
Ogden, M.W., Heavner, D.L., Foster, T.L., 1996. Personal monitoring system for measuring environmental tobacco smoke exposure. Environ. Tech. 17, 239-250. Scherer, G., Conze, C., Van, Meyerinck, L.,
Sorsa, M., Adlkofer, F., 1990. Importance of exposure to gaseous and particulate phase compounds of tobacco smoke in active and passive smokers. Int. Arch. Environ. Occup. Health 62, 459-466. Sieger, M., 1993. Involuntary smoking in the
restaurant workplace. A review of employee exposure and health effects. JAMA 270, 490-493.
Trout, D., Decker, J., Mueller, C., Bernert, J.T., Pirkle, J., 1998. Exposure of casino employees to environmental tobacco smoke. JOEM 40, 270-276.
U.S Environmental protection Agency.
Respiratory health effects of passive smoking: lung cancer and other disorders.
Washington DC: Office of Health and Environmental, Office of Research and
Development. U.S. EPA. 1992
(Publicaton no. EPA/600/6-90/006F). Willemsen, M.C., Brug, J., Uges, Donald,
R.A., Vos, de, Wael, M.L., 1997. Validuty and reliability of self-reported exposure to environmental tobacco smoke in work offices. JOEM 39, 1111-1114.
Yang, M.C., Lee, Y.C., 1992. Study on the economic cost in Taiwan. Taiwan Department of Health, The Executive Yuan.
Table 1
Nicotine concentrations and mass median diameter (MMD) of 12 brands of cigarettes burned in smoking chamber for 20 minutes
Cig. brand Nicotine (mg) Tar (mg) Origin MMD (µm) Particulate Nicotine (µg/m3) Gaseous Nicotine (µg/m3) A1 0.6 7 Germany. 0.38±0.69 0.06±0.03 9.12±0.88 A2 0.6 8 U.S. 0.35±1.68 0.04±0.02 7.69±0.65 A3 0.8 9 U.K. 0.33±1.28 0.06±0.07 10.13±1.46 A4 0.9 13 U.S. 0.39±1.09 0.14±0.05 15.48±1.78 A5 0.9 13 Germany 0.33±0.96 0.18±0.06 12.62±2.69 A6 1.2 14 U.K. 0.41±1.01 0.32±0.05 17.88±1.17 Mean ± SD 0.13±0.11 12.15±3.93 A7 0.7 8 Local 0.41±0.90 0.06±0.04 13.67±2.23 A8 1.0 11 Local 0.53±0.97 0.32±0.07 18.10±0.71 A9 1.2 14 Local 0.39±1.54 0.28±0.09 18.47±1.23 A10 1.2 13 Local 0.49±1.51 0.42±0.08 17.69±1.49 A11 1.4 15 Local 0.49±2.35 0.44±0.09 24.21±2.27 A12 1.4 15 Local 0.43±1.08 0.50±0.07 26.58±1.73 Mean ± SD 0.34±0.16 19.79±4.74
Figure 2. Concentration of particulate for ten size categories for six imported (a) and six local brands (b) (a ) 0 2 0 4 0 6 0 8 0 1 0 0 1 2 0 1 4 0 0 . 0 5 0 . 1 0 . 2 0 . 4 0 . 8 1 . 6 3 . 2 6 . 4 1 2 2 5 d a ( u m ) Concentration(mg/m 3 ) A 1 A 2 A 3 A 4 A 5 A 6 (b ) 0 2 0 4 0 6 0 8 0 1 0 0 1 2 0 1 4 0 0 . 0 5 0 . 1 0 . 2 0 . 4 0 . 8 1 . 6 3 . 2 6 . 4 1 2 2 5 d a ( u m ) Concentration(mg/m 3 ) A 7 A 8 A 9 A 1 0 A 1 1 A 1 2
Figure 3. Concentration of particulate for ten size categories for six imported brands (a) and six local brands (b)
(a ) 0 5 1 0 1 5 2 0 2 5 3 0 3 5 1 2 3 4 5 6 7 8 9 1 0 1 1 1 2 1 3 1 4 1 5 1 6 1 7 1 8 1 9 2 0 T i m e ( m i n ) Concentration(mg/m 3 ) A 1 A 2 A 3 A 4 A 5 A 6 (b ) 0 5 1 0 1 5 2 0 2 5 3 0 3 5 1 2 3 4 5 6 7 8 9 1 0 1 1 1 2 1 3 1 4 1 5 1 6 1 7 1 8 1 9 2 0 T i m e ( m i n ) Concentration(mg/m 3 ) A 7 A 8 A 9 A 1 0 A 1 1 A 1 2