Journal of Chemical Crystallography, Vol. 24. No. 2, 1994
Synthesis and crystal structures of aluminum and iron
phosphites
Damodara M. Poojary, l Yiping Zhang, l David E. Cox, 2 Philip R. Rudolf, 3 Soofin Cheng, 4
and Abraham Clearfield*'l
Received June 28, 1993
The hydrated forms of aluminum and iron phosphite were prepared and their structure was solved using X-ray powder diffraction data. The diffraction data for the aluminum phosphite powder sample was collected using synchrotron radiation (~. = 1.3087 A,) while that for iron phosphite was obtained from a rotating anode X-ray source. Both compounds crystallize in the monoclinic space group, P2~. Unit ceil parameters for the AI compound: a = 8.0941(1), b = 9.9137(1), c = 7.6254(1) A., ~ = 111.95~ Fe compound: a = 8.2548(1), b = 10.1814(1), c = 7.7964(1) (A,), fl = 111.94(1)". The Rietveld refined formula is M2(PO3H)3"4H20 (M=AI, Fe). There are two independent metal atoms in the structure and both are six-coordinated. One of them is coor- dinated by two water molecules and four phosphite oxygens. The other atom is surrounded by one water molecule and five phosphite oxygens. All the phosphite oxygens are involved in bridging the AI atoms. The geometry about AI, Fe, and P atoms is normal and they display expected bond parameters. The Lattice water is located in the cavity and is hydrogen bonded to phosphite'oxygen and water molecules.
Introduction
Recently, there has been a growing interest in the chemistry o f metal phosphates, metal phosphites, metal phosphonates, and their derivatives (Clearfield, 1989). These compounds can provide porous structures which may have applications in catalysis, sorption and ion ex- change. Our research in this field is mainly focused on the synthesis and structural studies of these materials. We have prepared a number o f metal phosphite com- pounds and their structures were solved using single crystal data (Zhang et a l . , 1992; Ortiz-Avila et al., 1989). The AI and the Fe phosphites were found to be isostructural on the basis of their powder diffraction data, but attempts to grow them in the single crystal form were Department of Chemistry, Texas A&M University, College Station, Texas 77843.
2National Synchrotron Light Source. Brookhaven National Labora- tory.
3Analytical Sciences, Dow Chemical Company, Midland, Michigan 48667.
a National Taiwan University, Taipei, Taiwan.
unsuccessful. The powder patterns o f these samples showed good quality Bragg reflections with high reso- lution. Although these compounds consist o f 18 non- hydrogen atoms in the asymmetric unit which is a rela- tively difficult problem to be attempted by powder methods, we were encouraged by our previous results (Rudolf et al., 1986) in which a 26 atom problem was solved by ab initio methods. Therefore it was decided to undertake the structure solution o f these compounds to demonstrate the power o f powder diffraction data in resolving the structure o f compounds containing a large number of atoms. Further incentive for obtaining the structure was to round out our knowledge o f metal phos- phites. In particular, several lanthanide phosphite struc- tures have been solved (Zhang et al., 1992; Loukili et al., 1988; Tijani et al., 1988) and it is o f in'terest to compare these structures with those o f trivalent transi- tion elements. The only known structures o f trivalent transition elements are those o f anhydrous Fe2(O3PH) 3 (Sghyar et al., 1991b) and Fe(HOaPH)3 (Sghyar et al.,
1991a). The powder data for the A1 sample was col- lected using synchrotron radiation and its structure was 155
solved without any prior knowledge of the structure. When this manuscript was in preparation we came to know that this compound is isostructural to that of gal- lium phosphite whose structure was determined using neutron and synchrotron powder data (Morries et al., 1992).
Experimental
Solid-state MAS NMR spectra were obtained on a Bruker MSL-300 solid state NMR spectrometer. The 3 ] p
chemical shifts are referenced to 85 % H 3 P O 4 aqueous solution. The aluminum chemical shifts were referred to external Al(H20)36 + as derived from an AI(NO3) 3 aqueous solution. Thermogravimetric analysis(TGA) was carried out with a Du Pont Model 951 unit at a rate of 10~ Infrared spectra were recorded on a Digilab Model FTS-40 FTIR unit by the KBr method. Preparation o f the Aluminum phosphite
8.45 g of Al(NO3)3"9H20(MCB) was dissolved in deionized water which was added to 60 ml aqueous so- lution of 1.0M H3PO 3. The pH of this mixture was then raised to 1.8 by the addition of NaOH. One third of this solution was kept at 65~ in an oil bath for 24 hr. A white solid (1, 14 g, 81% yield) was obtained after filtration, washing with water and air drying. Ana- lytical data: A1, 13.9%; P 25.0%. Calculated for AI2(O3PH)3.4H20: A1, 14.7%; P 25.4%.
Preparation o f the iron phosphite
Fe(NO3)3.9H20 (Baker) (14.40 g) was dissolved in 25 ml of an aqueous solution of 1.0 M H3PO 3. The re- suiting red brown clear solution was then refluxed for 24 hr. 5.8 g (77% yield) of a slightly pink solid was recovered by filtration, washed, and then air dried.
Data collection
Powder diffraction data for the aluminum sample were obtained at the National Synchrotron Light Source on beam line X7A using a wavelength of 1.3087 A, from a Ge (111) monochromator using a Ge (220) analyzer crystal. The sample was contained in a capillary and the data were collected every 0.01 ~ 20 from 5 to 88.8 ~ 20 with a count time of 1 s per step. The raw data were transferred to the GRAPH (Rudolf et al., 1985) format and the peaks were indexed. The unit cell parameters were refined by least-squares procedures (Rudolf, 1982).
Step scanned X-ray powder data for the iron sam- ple (packed on a flat aluminum sample holder) were col- lected on the finely ground sample by means of a Rigaku RU200 computer automated diffractometer. The X-ray source was a rotating anode operating at 50 KV and 180 mA with a copper target and graphite monochromated radiation. Data were collected between 10 and 90 ~ in 20 with a step size of 0.01 ~ and a count time of 6 s per step. The data were transferred to a DEC microVAX II computer and the pattern processed as described earlier (Rudolf et al., 1985). Indexing was carried out by trial and error methods (Werner, 1965) and refined by least- squares procedures. Crystallographic data are given in Table 1.
Structure solution and refinement
Aluminum phosphiteThe pattern was indexed by the trial and error method. The systematic absences indicated the space group to be either P2t or P2~/m. There were 60 singly indexed reflections up to a 20 limit of 57 ~ correspond- ing to a d-spacing of 1.38A,. Peaks which could not be
T a b l e 1. Crystallographic data for a l u m i n u m and iron phosphites
AI Fe
Pattern range (20), deg. 9-88.8
Step scan increment (20), deg. 0.01
Step scan time, s 1
Radiation Source Synchrotron
Wavelength, A 1.3087 Space group P2, a , ]k 8.0942( I ) b. ,~, 9.9138(I) c, ,~ 7.6255(11 /3, deg. 11 1.95( 1 )
No. of contributing reflections 78 I
No. of geometric and
observations 61 6 I
P-O distances and tolerance (]k) 1.53( I ) 1.53( I )
MO, distances and tolerance (,~) 1.85( I ) 2.0( I )
O - - O distances for PO4 (A,) 2.55(I) 2.55( I )
O - - O distances for MO~, (,~) 2.66( I ) 2.66( I )
No. of structural parameters 51 5 I
No. of profile parameters I I I I
Statistically expected Rwp 0.072 0.034 Rwp 0.133 0.1 64 Rp 0.101 0.122 Rt- 0.042 0.041 Rwp = (Y: w ( I , , - l , ) " / r . w l l ~ l ) ''2 Expected Rwp = Rwp/(x-') ~'z
e~- = <[f,J-IF, l> <lf,,i>
4-80 0.01 6 Rotating anode 1.5406, 1.5444 P2, 8.2548(I) 10.1814(1) 7.7964( 1 ) I I 1.94(I) 533 Rp = (~ I/,,-t,I/r. i,)
X'-
= P+w(I,,-I,)~-I(N,,..-N~.)
Structures of aluminum and iron phosphites 157
decomposed into their individual reflections were treated as unobserved data. These 60 singly indexed reflections along with an equal n u m b e r o f unobserved data were input to the direct method package in T E X S A N ( T E X S A N , 1987). In the space group P21, the E - m a p revealed the positions o f all the P and AI atoms along with two o x y g e n atoms. The positions o f most o f these AI and P atoms were also confirmed by the Patterson map computed with the same data set. A limited refine- ment was conducted on these atoms with heavy d a m p i n g and selective refinement o f a few parameters per cycle. Difference F o u r i e r maps computed at this stage allowed the positioning o f an additional five o x y g e n atoms o f the phosphite groups. The geometry about the AI atoms with these oxygen atoms could not be decided and therefore tetrahedral coordination was assumed at this stage.
Using a utility program Graph (Rudolf et al., 1985) the raw data were transferred to the G S A S (Larsen et al., 1985) program package for Rietveld method (Riet- veld, 1969) o f full-profile refinement. The refinement was started in the space group P21 with the positional parameters obtained above. Initial refinement o f the scale, background, the unit cell parameters and the pro- file coefficients led to a satisfactory agreement between the observed and calculated patterns. Refinement o f the atomic positions were carried out with soft constraints consisting o f both A 1 - - O and P - - O bond distances and O - - O nonbonded distances. A difference F o u r i e r map obtained at this stage revealed the positions o f the miss- ing phosphite o x y g e n s along with peaks at bonding dis- tances ( 1 . 7 - 2 . 4 ]k) from the AI atoms. There were two such peaks near AI 1 and one near A12. These peaks were input as water molecules and the soft constraints were adjusted for octahedral geometry o f the AI atoms. With this model the refinement progressed very well and the lattice water molecule was located in the final difference Fourier map. In the last stages o f refinement the atom isotropic thermal parameters were refined. In the final refinement the shifts in all the parameters were less than their estimated standard deviations. Neutral atomic scat- tering factors were used for all atoms. No corrections were made for a n o m a l o u s dispersion, absorption or pre- ferred orientation,
Iron phosphite
The atomic positions obtained from the refinement o f the aluminum phosphite was used as a starting model. The pairs o f peaks arising from K ~ I and Kot2 doublets were treated as separate reflections in the fixed intensity ratio o f 2 : 1. The refinement was carried out in a m a n n e r similar to that for the AI c o m p o u n d . Details o f the struc- ture refinement are given in Table 1.
Table 2. Positional and thermal parameters for aluminum phosphite
x y z Ui~,,, A-'" All 0 . 3 6 7 7 ( 5 ) 0.9278 I' 0.0890(5) 0.004( 1 ) AI2 0 . 9 7 5 2 ( 5 ) 0 . 1 4 8 1 ( 6 ) 0 . 4 3 5 9 ( 5 ) 0.001(1) PI 0 . 6 5 2 8 ( 4 ) 0 . 1 2 7 5 ( 6 ) 0 . 0 4 3 5 ( 5 ) 0.003(I) P2 0 . 0 7 6 9 ( 5 ) 0 . 8 7 1 0 ( 6 ) 0 . 2 7 5 2 ( 6 ) 0.003(1) P3 0 . 9 9 0 6 ( 5 ) 0 . 9 2 4 4 ( 6 ) 0 . 7 5 1 5 ( 6 ) 0.001(l) Ol 0 . 2 1 9 7 ( 8 ) 0 . 8 4 8 0 ( 7 ) 0 . 1 9 1 9 ( 9 ) 0.005(3) 02 0 . 0 4 6 2 ( 8 ) 0 . 2 7 7 4 ( 7 ) 0 . 3 0 2 4 ( 9 ) 0.007(3) 03 0 . 0 6 6 0 ( 9 ) 0 . 0 1 9 9 ( 7 ) 0 . 3 1 9 2 ( 9 ) 0.015(3) 04 0 . 8 9 3 4 ( 8 ) 0 . 2 8 0 6 ( 8 ) 0 . 5 5 3 4 ( 9 ) 0.006(3) 05 0 . 5 2 2 3 ( 8 ) 0 . 0 0 9 0 ( 7 ) 0 . 9 9 0 1 ( 8 ) 0.007(3) 06 0 . 1 8 7 4 ( 7 ) 0 . 9 5 4 1 ( 7 ) 0 . 8 6 0 1 ( 7 ) 0.016(3) 07 0 . 4 3 6 0 ( 9 ) 0 . 7 6 2 0 ( 6 ) 0.0301(l) 0.004(3) 08 0 . 9 1 7 8 ( 8 ) 0 . 0 1 7 9 ( 7 ) 0 . 5 7 7 4 ( 8 ) 0.014(3) 09 0.7501(6) 0. 1320(9) 0 . 2 5 7 6 ( 7 ) 0.001(3) O(Wl) 0.3100(8) 0. 1052(6) 0 . 1 6 7 1 ( 9 ) 0.005(3) O(W2) 0.5647(8) 0 . 9 1 7 8 ( 9 ) 0 . 3 3 8 4 ( 7 ) 0.009(3) O(W3) 0.2148(7) 0. 1608(10) 0 . 6 3 5 6 ( 8 ) 0.020(3) 0(W4) 0.4949(13) 0.8506(12) 0.6624(13) 0.020(3) B
"U,~ = ~ as defined in GSAS, 1985. hHeld fixed in least-squares refinement.
Results and discussion
Crystallographic and experimental parameters are given in Table 1, and final positional and thermal pa- rameters in Table 2 and 3. Bond lengths and angles for the two samples are shown in Tables 4 and 5. The final Rietveld refinement difference plot is shown in Fig. "I.
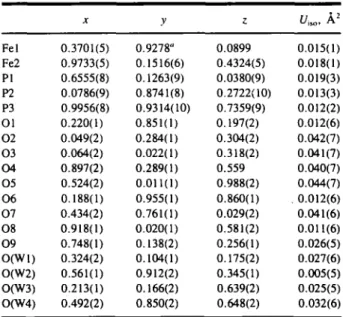
Table 3. Positional and thermal parameters for iron(Ill) phosphite
x y Z Ui~o, ,~2 Fel 0 . 3 7 0 1 ( 5 ) 0.9278" 0.0899 0.015(1) Fe2 0 . 9 7 3 3 ( 5 ) 0 . 1 5 1 6 ( 6 ) 0 . 4 3 2 4 ( 5 ) 0.018(1) PI 0.6555(8) 0 . 1 2 6 3 ( 9 ) 0 . 0 3 8 0 ( 9 ) 0.019(3) P2 0.0786(9) 0 . 8 7 4 1 ( 8 ) 0.2722(10) 0.013(3) P3 0.9956(8) 0.9314(10) 0 . 7 3 5 9 ( 9 ) 0.012(2) O1 0.220(1) 0.851(I) 0 . 1 9 7 ( 2 ) 0.012(6) 02 0.049(2) 0 . 2 8 4 ( 1 ) 0 . 3 0 4 ( 2 ) 0.042(7) 03 0.064(2) 0 . 0 2 2 ( 1 ) 0 . 3 1 8 ( 2 ) 0.041(7) 04 0.897(2) 0.289(1) 0.559 0.040(7) O5 0.524(2) 0 . 0 1 1 ( 1 ) 0 . 9 8 8 ( 2 ) 0.044(7) 06 0.188(1) 0 . 9 5 5 ( 1 ) 0 . 8 6 0 ( 1 ) .0.012(6) 07 0.434(2) 0 . 7 6 1 ( 1 ) 0 . 0 2 9 ( 2 ) 0.041(6) 08 0.918(1) 0 . 0 2 0 ( 1 ) 0 . 5 8 1 ( 2 ) 0.011(6) 09 0.748(I) 0 . 1 3 8 ( 2 ) 0 . 2 5 6 ( 1 ) 0.026(5) O(Wl) 0 . 3 2 4 ( 2 ) 0 . 1 0 4 ( 1 ) 0 . 1 7 5 ( 2 ) 0.027(6) O(W2) 0 . 5 6 1 ( 1 ) 0 . 9 1 2 ( 2 ) 0 . 3 4 5 ( 1 ) 0.005(5) O(W3) 0 . 2 1 3 ( 1 ) 0 . 1 6 6 ( 2 ) 0 . 6 3 9 ( 2 ) 0.025(5) O(W4) 0 . 4 9 2 ( 2 ) 0 . 8 5 0 ( 2 ) 0 . 6 4 8 ( 2 ) 0.032(6) "Held fixed in least-squares refinement.
Table 4. Average and ranges in bond lengths (A) and bond angles (~ for aluminum phosphite
Distance Range Average
All - - O 1.828(5) -- 1.843(6) 1.84 All --O(W) 1.968(5) -- 1.976(6) 1.97 AI2--O 1.828(5)-- 1.857(5) 1.85 AI2--O(W) 1.972(5) P I - - O 1.519(7)-- 1.529(5) 1.52 P2--O 1.523(5)- 1.530(5) 1.53 P3--O 1.513(5)- 1.544(5) 1.53
Atoms Angle Range Average
O - - A I I - - O (cis) 88.1(3)-- 95.7(3) 90 O - - A l l - - O (trans) 174.7(4) -- 178.7(4) 177 O - - A I 2 - - O (cis) 87.2(3) -- 94.6(3) 90 O - - A I 2 - - O (trans) 176.8(3) -- 177.6(3) 177 O - - P I - - O 109.6(4)- 113.0(4) 111 O - - P 2 - - O 110.5(5) -- 112.6(5) I I 1.5 O - - P 3 - - O 109.7(4)-- 113.1(4) I11.5
Atoms Angle Range Average
P - - O - - A I 136.4(4)- 149.5(5) 142
Atoms Distance Atoms Distance
O ( W l ) - - O 3 2.770(9) O(W2)--O(W4) 2.81(1)
O(Wl)--O(W4) 2.93(1) O(W3)--O6 2,73(1)
O(W2)--O8 2.93(I) O(W4)--O5 2.89( 1 )
O(W2)--O9 2.80(I)
Table 5. Average and ranges in bond lengths (A) and bond angles (~ for iron(Ill) phosphite
Distance Range Average
F e l - - O F e l - - O ( W ) Fe2--O Fe2--O(W) P l - - O P2--O P3--O 1.88(I 2.00( I 1.86( 1 2.04(1 1.55(I -- 1.51(1 -- 1.51(I -- -- 1.93(1) 1.90 --2.03(I) 2.01 1.94(I) 1.91 1.59( 1 ) 1.56 1.56( 1 ) 1.53 1.57(I) 1.54
Atoms Angles Range Averagc
O - - F e l - - O (cis) 8 8 . 2 ( 5 ) - 95.2(6) 90
O - - Fe I -- O (trans) 174.5(6) -- 177.8(6) 176
O - - F e 2 - - O (cis) 87.2(5)-- 95.5(6) 90
O-- Fe2--O (trans) 174.7(6) -- 176.2(7) 176
O - - P I - - O 109.9(8)-- 112.5(8) 109
O - - P 2 - - O 110.4(9)-- 112.3(8) I I I
O - - P 3 - - O 109.3(8) -- 113.2(7) 112
Atoms Angle Range Average
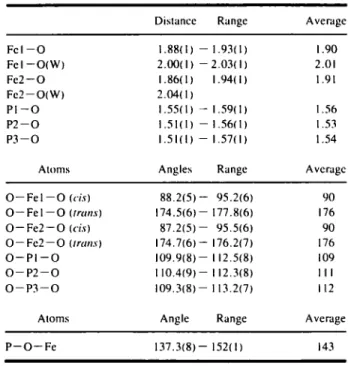
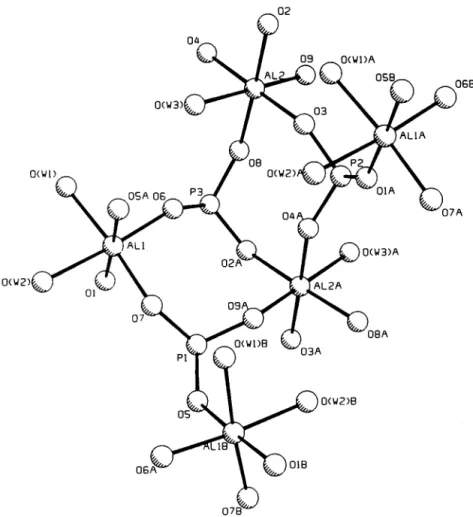
P - - O - - Fe 137.3(8) -- 152( I ) 143 T h e X - r a y p o w d e r p a t t e r n f o r t h e F e c o m p o u n d is s h o w n in F i g . 2. T h e b r i d g i n g n a t u r e o f t h e p h o s p h i t e g r o u p s a n d t h e c o o r d i n a t i o n s u r r o u n d i n g t h e AI a t o m s is p r e - s e n t e d in F i g . 3. F i g . 4 s h o w s t h e p a c k i n g o f t h e g r o u p s in t h e l a t t i c e . to- o L d r'l CD >- O 0 3
3~
I I q I I J 9 .I " ~ L I ~ . t , . . ~ , , . ~ L ~ ~ . - - ~ . . . . , . . . I I ~ I J I 1.0 2,0 3 0 4 . 0 5 . 0 6 . 0 2 - T H E T A , DEG YIOEFig. 1. A portion of the observed ( + ) and calculated ( - ) profiles (X-my intensity versus 20)
for the Rietveid refinement o f the AI sample. The diffraction data was collected using synchro- tron radiation. The bonom curve is the difference plot on the same intensity scale.
Structures of aluminum and iron phosphites 159
I
I
. . . 2 ~ . . . 3 ~ . . . 4 ~ . . . ~ 0 . . . " 6 0 . . . 7 ~ . . . 8 8 . . .
2B
Fig. 2. X-ray powder pattern of the iron phosphite. Intensity data for this sam- ple was collected using Cu K~ radiation from a Rigaku Rotating Anode.
02 0(W3) 09
13•
(WI)A I L ALIA 06B 0(WI) O(W2)# O(W2) ~LI 02 ,0(W3)A p i~i..~ ~',,) 0(WI)B 0(W2)8 06 OIB 0 7 B ~Fig. 3. Plot of the AI phosphite structure showing the numbering scheme and the bridging nature of the phosphite groups.
Fig. 4. Packing of the structure in the unit cell.
Since these compounds are isostructural the struc- tural discussion is presented only for the aluminum phosphite compound. The structure consists of three phosphite groups and two octahedrally coordinated AI atoms as shown in Fig. 3. Each phosphite group bridges to three AI atoms. AI 1 is coordinated by two water mol- ecules and four phosphite oxygen atoms (05 and 0 7 from different P1, O1 from P2 and 0 6 from P3). The aluminum atom, A12, is coordinated to one water mol- ecule and five phosphite oxygen atoms (09 from P 1 , 0 3 and 0 4 from different P2, 0 2 and O8 from P3). P1 is linked to two All atoms and one A12 atom while P2 and P 3 have the environment of two A 12 atoms and one All atom. This bridging of phosphite groups leads to a three dimensional network of the structure as shown in the Fig. 4. The lattice water is located in a small cavity and is hydrogen bonded to one phosphite oxygen and two coordinated water molecules (Table 4). The metal atoms in both the compounds display a regular octahe- dral geometry. Bond angles and bond lengths about all the phosphite groups are close to the expected values.
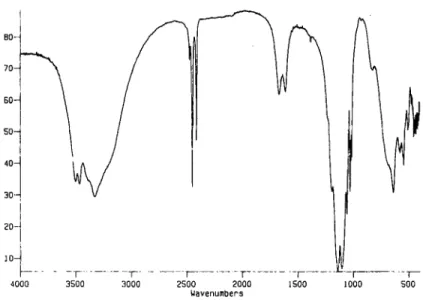
The number of water molecules obtained from the X-ray crystallographic study is consistent with the T G A results. The AI phosphite showed a weight loss of 21.2% up to 200~ while for the Fe compound the weight loss in this temperature range is 16.2 %. The calculated value for M2(HPO3) 3-4H20 is 19.7% and 17% for the AI and Fe compounds, respectively. The IR spectrum of the AI phosphite (Fig. 5) shows three sharp bands at 2474, 2452 and 2414 c m - ' while for the iron phosphite the bands are at 2453, 2430 and 2405 cm - I . These fre- quencies are characteristic of P - - H stretching and in- dicate the different environments to the three phosphite groups. The spectra also contained bands in the range of 3505-3330 c m - I corresponding to - - O H stretching of the water molecules. Two bands are present in the water bend region, perhaps indicating coordinated and hydrogen bonded water. The bands due to the P O 3 group vibrations are seen in the region of 1000-1200 cm -~. The solid-state 31p MAS NMR spectrum of the AI sam- ple showed three peaks of equal intensities at - 5 . 3 , - 1 1 . 9 and - 1 5 . 3 ppm (Fig. 6). The 27A1 NMR spec-
Structures of aluminum and iron phosphites 161 B0~ % TO- T r 60- n s 5 0 - i t t 40- n c 30-, e 20- ]0- 4000 -- - - ~ .. ...~ . . . . F . . . T ...r - - [ 3500 3000 2500 2000 1500 1000 Wavenumbers
Fig. 5. Infrared transmittance spectrum of AI2(O3PH)3-4H~O.
1--- 500
t
I
l
I
l J I , I i I i I i I * I ~ I l O 0 8 0 8 0 4 0 Z O 0 - 2 0 - 4 0 P P N e I * I e I - 8 0 - 8 0 - l O 0~
-lO0000
0SO0000
L:JO0000 I ,I I J 4 I 40 c v 0-20
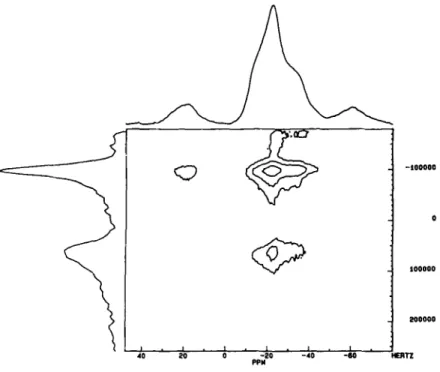
- 6 0 H [ A T Z PPHFig. 7. "~TAI 2D-NMR of AI_~(POo3"4H~O.
trum showed a single peak centered at - 2 0 ppm with a broad shoulder. However, the 2D- NMR clearly showed two peaks of nearly the same intensities (Fig. 7). These results are in agreement with the crystal structure which contain three independent Phosphite groups and two chemically distinct A1 atoms.
As mentioned in the introduction, these structures are similar to that of Ga phosphite, Ga2(HPO3)3.4H20. The dehydrated forms of Fe, AI, and Ga phosphite also contain the same type of structural units. These compounds have a general formula of the type, M2(HPO3)3(M~-A1, Fe, Ga). The structures of
Fe(HPO3H) 3 (Sghyar et a l . , 1991a), La(HPO3H)a-H20
(Tijani et al., 1988), Ce(HPO3H)(HPOa).2H20, 2 and
La(HPO3H)(HPO3). 3H20, (Zhang et a l . , 1992) on the
other hand, are layered. In these cases, the metal atoms are situated in a plane which are bridged by phosphite groups lying slightly above and below the metal plane. The main difference in the structures o f the lanthanides from those of the regular elements is the higher coor- dination number, eight versus six. This high coordina- tion is achieved by one of the phosphite groups chelat- ing the metal atom while at the same time one or both of its oxygen atoms coordinate to adjacent metal atoms. This type of bonding is common among metal phos- phonate complexes (Zhang and Clearfield, 1992). It is interesting to note that in all these layered structures the phosphite oxygen carrying the proton is not involved in coordination and it projects away toward the interlayer
region. In the case of Zn(H2PO3)2" 3H20, (Ortiz-Avila et al., 1989) the octahedral metal atoms are linked to HPOaH anions to form infinite helical chains. A more detailed discussion of the structures involving the phos- phite groups and nature of metal coordination was given in Zhang et al., (1992).
Obviously, the accuracy of the structure derived from powder diffraction data is no parallel to that ob- tained from single crystal study. Nevertheless, the pow- der data can provide valuable structural information on compounds which can be obtained only in the poly- crystalline form. We had earlier solved the struc- ture of a aluminum phosphate molecular sieve, (AIPO4)3"(CH3)aNOH using powder data from a con- ventional X-ray sealed tube. This structure consists of 26 nonhydrogen atoms in the asymmetric unit. Nowa- days, with the use of high quality powder data from syn- chrotron sources and from neutron beams it is possible to improve the precision of the refinement and also to attempt the solution of much more complex crystal structures. The structures presented here and the Ga phosphite contain 18 nonhydrogen atoms in the asym- metric unit. Morris et al. (1992) were also able to locate and refine all the hydrogen atoms of the phosphite groups and the water molecules using an additional neutron dif- fraction data set. The complete structure solution of these phosphite structures is clearly a major step in dem- onstrating the quality of structural results from powder diffraction data.
Structures of aluminum and iron phosphites 163
Acknowledgments
We gratefully acknowledge financial support of this study by the Regents of Texas A&M University through the commitment to Texas Program and the State of Texas through the Advanced Technology Program. We also wish to thank Dr. David Cox for assistance in ob- taining the synchrotron data at the National Synchrotron Light Source at Brookhaven National Laboratory, which is supported by the United States Department of Energy, Division of Materials Sciences, and Division of Chem- ical Sciences.
References
Clear'field, A. (1989) Comments lnorg. Chem. 10, 89-128.
Larson, A.o and von Dreele, R. B., (1985) GSAS: Generalized Struc- ture Analysis System Los Alamos National Laboratory, copyright
1985-88 by the Regents of the University of California.
Loukili, M., Durand, J., Cot, L., and Lafiq, (1988) M. Acta Cryst.
C44, 6-8.
Morries, R. E., Harrison, T. A., Nicol, J. M., Wilkinson, A. P., and
Cheetham, A. K. (1992) Nature 359, 519, and references therein.
Ortiz-Avila, C. Y., Squattrito, P. J., Shieh, M., and Clearfield, A.
(1989) Inorg. Chem. 28, 2608-2615.
Rietveld, H. M. (1969)J. Appl. Crystallogr. 2, 65-71.
Rudolf, P. R. (1972) LSUCRE: Programs for Least-Squares Unit Cell Refinement, University Frieberg, Modified Texas A&M Univer- sity.
Rudolf, P. R., and Clearfield, A. (1985) Acta Co,stallogr. B41,418-
425.
Rudolf, P. R., Saldarriaga-Molina C., and Clearfield, A. (1986) J.
Phys. Chem. 90, 6122-6125.
Sghyar, P. M.. Durand. J., Cot. L., and Rafiq, M. (1991a)Acta C~st.
C47, 8-10.
Sghyar, P. M., Durand, J., Cot. L., and Rafiq, M. (1991b) Acta
Cryst. C47, 2515-2517.
TEXSAN (1987) Structure analysis package, Molecular Structure Corp., The Woodlands, Texas, 1987 (revised).
Tijani, N., Durand, J., and Cot. L. (1988) Acta Co,st. C44, 2048-
2050.
Werner, P.-E. (1965)J..Appl. Co,st. 120, 375-387.
Zhang, Y., and Clearfield, A. (1992) Inorg. Chem. 31, 2821-2826.
Zhang, Y., Hu, H.. and Clearfield, A. (1992) Inorg. Chim. Acta 193,