國
立
交
通
大
學
網路工程研究所
碩
士
論
文
減 少 通 訊 需 求 之 交 通 通 報 系 統
Traffic Notification System with Reduced Communications
Requirements
研 究 生:林祐村
指導教授:張明峰 教授
中 華 民 國 九 十 九 年 七 月
減 少 通 訊 需 求 之 交 通 通 報 系 統
Traffic Notification System with Reduced Communications
Requirements
研 究 生:林祐村 Student:You-Tsun Lin
指導教授:張明峰 Advisor:Ming-Feng Chang
國 立 交 通 大 學
網 路 工 程 研 究 所
碩 士 論 文
A ThesisSubmitted to Institute of Network Engineering College of Computer Science
National Chiao Tung University in partial Fulfillment of the Requirements
for the Degree of Master
in
Computer Science
July 2010
Hsinchu, Taiwan, Republic of China
i
減 少 通 訊 需 求 之 交 通 通 報 系 統
學生:林祐村
指導教授:張明峰教授
國立交通大學網路工程研究所 碩士班
摘要
提供用路人即時交通資訊,包含車速、車流量等資訊,可節省行車時間及能 源消耗。由於 GPS 與無線資料傳輸逐漸普及,利用 GPS 探偵車回報車速取得即 時交通資訊成為可行的方式。相對於傳統固定式車輛偵測器而言,GPS 探偵車大 幅降低佈建與維護成本。然而目前 GPS 探偵車定期回報車速到交通資訊中心彙 整。要取得即時路況,必須採用較短的回報週期,如此可能造成回報資訊超載的 問題。本研究提出雙向回報方式,改良探偵車交通資訊回報機制,能有效降低交 通資訊回報次數和成本。由交通資訊中心透過無線網路週期性地廣播各路段之即 時最高車速,並由車速較快之探偵車先回傳即時車速至交通資訊中心,再由交通 資訊中心廣播回報最快車速。其他車速較慢之探偵車則不再回報車速。此一方法 也適用於取得各路段的最短行車時間。為了分析系統效能,我們使用運輸模擬軟 體 VISSIM 來進行實驗模擬。研究成果證實,我們所提出的方法可減少探偵車資 訊回報之數量,減輕交通資訊中心之負載。研究結果也表明利用最高速度以及最 短行車時間來顯示交通狀況是可行的。ii
Traffic Notification System with Reduced Communications
Requirements
Student: You-Tsun Lin
Advisor: Prof. Ming-Feng Chang
Institute of Network Engineering
National Chiao Tung University
Abstract
Providing real-time traffic information, such as traffic speed and flow, to road users can save traveling time and reduce fuel consumption. With the increasing popularity of on-board GPS devices and wireless data communication capability, it becomes feasible to obtain global real-time traffic information from GPS-equipped probe cars, which periodically report speed to a traffic information center (TIC). To provide real-time information, the report period needs to be short. This may result in a huge number of reports to an over-loaded TIC. In this thesis, we present a traffic report system and method with fast feedback to reduce the number of traffic reports from probe cars. The TIC periodically broadcasts the maximum speed collected in the previous period for each road segment. After receiving the TIC broadcast, probe cars with fast speed would report their speed to the TIC earlier than those with slow speed. The TIC will also broadcast the maximum speed of this cycle immediately after it receives a speed report. This immediate broadcast would prevent slow-moving probe cars from reporting their speeds. The same method can be used to obtain the minimum travel time as well. To evaluate the performance of the system, we have performed simulations using the traffic model simulator VISSIM. The simulation results indicate that our approach significantly reduces the number of traffic reports and the loading of the TIC. The results also suggest that it is feasible to use the maximum speed and the minimum travel time to indicate traffic conditions.
iii
誌謝
首先我要感謝指導教授 張明峰老師。就讀研究所期間,老師的指導使我獲 益匪淺。這兩年來,老師悉心指導,讓我學到了做研究的方法。在構思、撰寫此 論文期間,老師也很有耐心地指點論文不足的地方,使我得以完成碩士論文。感 謝老師兩年來的指導。 再來也要謝謝實驗室的同學們,感謝你們在課業以及生活上的幫助,使我得 以順利完成研究所學業。感謝有你們的陪伴,使我生活多采多姿。 最後,最感謝的是我摯愛的家人。感謝你們的支持,讓我順利完成學業。 林祐村 謹識於 國立交通大學網路工程研究所碩士班 中華民國九十九年七月iv
Contents
摘要... i Abstract ... ii 誌謝 ... iii Contents ... iv List of Figures ... v List of Tables ... vi Chpter 1 Introduction ... 1 1.1 Current Development ... 1 1.2 Motivation ... 2 1.3 Objective ... 4 1.4 Summary ... 5Chpter 2 Background and Related Work ... 6
2.1 FCD-based Traffic Information Systems ... 6
2.2 Positioning Technologies of FCD ... 7
2.2.1 Global Position System ... 7
2.2.2 Mobile Phone Tracking ... 9
2.3 Report Policies for Communication Reduction ... 10
Chpter 3 The System Design ... 13
3.1 System Overview ... 13
3.2 The Maximum Speed ... 15
3.2.1 Traffic Information Center ... 16
3.2.2 Probe Cars ... 18
3.3 The Minimum Travel Time ... 23
Chpter 4 Evaluation and Analysis ... 28
4.1 Simulation Environment and Parameters... 28
4.2 The Maximum Speed ... 29
4.3 The Minimum Travel Time ... 36
Chpter 5 Conclusions ... 39
v
List of Figures
Fig. 2-1 An example of the triangulation method. ... 8
Fig. 3-1 The System Architecture. ... 13
Fig. 3-2 The system flow. ... 17
Fig. 3-3 A flow chart of when the TIC receives speed data. ... 18
Fig. 3-4 The relationship between the timeout period of TC and Vcmax. ... 20
Fig. 3-5 A flow chart of when a probe car receives Vm-tmp. ... 22
Fig. 3-6 The relationship between the timeout period of Tm-tmp and Vcmax. . 23
Fig. 3-7 The relationship between the timeout period of TC and TTc. ... 26
Fig. 3-8 The relationship between the timeout period of Tm-tmp and TTc. ... 27
Fig. 4-1 β and total amount of messages. ... 31
Fig. 4-2 Comparison of time trends between TTavg and TTmin. ... 37
vi
List of Tables
Table 2-1 An example of the report policy. ... 12
Table 3-1 Parameters used in the system. ... 15
Table 3-2 Parameters used in the system. ... 24
Table 4-1 The sequence data generated by VISSIM. ... 28
Table 4-2 Parameters used in the simulation. ... 29
Table 4-3 The comparison of convention and proposed system. ... 30
Table 4-4 The results of performance. ... 32
Table 4-5 An example of selection of Vyellow and Vgreen. ... 33
Table 4-6 An example of adjustment. ... 33
Table 4-7 An example of classification. ... 34
Table 4-8 An example of classification after smoothing out the data. ... 35
1
Chpter 1 Introduction
1.1 Current Development
Urban traffic has been growing all over the world in the past few years, and it puts a lot of pressure on cities’ traffic control and planning, resulting in reduction of transportation efficiency. Moreover, traffic congestion has several negative impacts, such as air pollution, noises, and fuel consumption. According to the urban mobility report [1], drivers in the US wasted 4.16 billion hours of time and 2.81 billion gallons of fuel in 2007 due to traffic congestion, and the congestion costs are increasing. When traffic congestion is becoming a serious problem to our lives, there is a strong need to improve transportation efficiency.
In order to solve the traffic congestion problem, several methods have been developed to collect traffic information, such as inductive loops, infrared sensors and video detections. Inductive loops and infrared sensors are embedded in a road network to detect vehicles passing over. Video detections are another form of vehicle detection methods which use traffic cameras to detect vehicles by means of image processing techniques. Using these methods, traffic system managers like TANFB Traffic Information System [2] can provide traffic information to road users for route planning decisions. The three types of methods for traffic detection have been a major part of most intelligent transportations systems (ITS) during the last few decades. However, they are too expensive to construct and maintain. It is difficult to widely use them in urban cities because of economic reasons.
2
An alternative method for collecting traffic information is Floating Car Data (FCD). The basic idea of FCD is to collect real-time traffic information by locating vehicles via mobile phones or GPS devices. FCD uses probe cars as mobile sensors to collect traffic information, which is based on the exchange of information between probe cars traveling along a road network and a central server. Unlike the traditional traffic data collection techniques mentioned above, FCD is very cost-effective, that is, there is no need to build additional devices along a road to obtain traffic information. Contrary to traditional techniques, it has much wider road network coverage. Some service providers, such as TomTom [3], IntelliOne [4], ITIS Holdings plc [5] and Mediamobile [6], have developed applications based on FCD recently.
1.2 Motivation
In general, FCD falls into two categories: floating cellular data and global position system-based probe cars. The principle of floating cellular data is to locate vehicles by means of triangulation or other technologies such as handover [7]. GPS-based probe cars use GPS receivers to measure location and speed. The main difference between these two approaches is that floating cellular data approach does not need additional hardware. GPS-based probe cars rely on on-board GPS devices for location measurement. Floating cellular data, however, does not require special devices in cars, because most driving vehicles are already equipped mobile phones nowadays. Although floating cellular data is superior to GPS-based in the point of view of availability, it has critical weakness—low accuracy. Accuracy of floating cellular data is especially low in urban areas. Density of road network is high in urban areas, whereas the sector cell size is large, which may suffer from locating problems. As a result, it is difficult to obtain useful traffic information in urban areas by using
3
floating cellular data. In this thesis, we only consider the GPS-based approach because of accuracy concerns.
To obtain real-time information, probe cars need to periodically report their conditions to a traffic information center (TIC) in a short period. In a traffic information system using FCD, probe cars send their current conditions, such as coordinates, timestamp, speed and heading, to the TIC via wireless communication methods. Upon using received traffic conditions, the TIC is able to generate and update traffic information, and then broadcasting to all road users. The road users that receive traffic information can decide the best route immediately. For example, the road users can drive different roads in order to avoid traffic accident or traffic jam ahead. In addition, a traffic information system based on FCD can provide travel time easily. Therefore, drivers are able to know how long it takes to reach their destinations, which benefits road users a lot.
To select the periodical report interval, one needs to consider the tradeoff between the amount of report messages and the real-timeliness of the traffic information generated by the TIC. In urban cities, there are many probe cars which report their information to a TIC, which puts loads on the TIC. The TIC needs to receive and process significant amount of messages. When traffic flow increases, the TIC requires additional storage space and communication bandwidths. Therefore, a traffic information system based on such policy has scalability problems. One direct solution is to make probe cars report their conditions in a longer period, therefore reducing the amount of messages which are sent to the TIC. However, it is difficult to obtain real-time information; in other words, the collected information does not reflect traffic conditions immediately.
4
Although many studies have been done on FCD generating traffic information, few studies investigated how to select an optimal report interval. Most traffic information systems, however, collect traffic information by using periodical report policies, which needs to consider the trade-off relationship and problems mentioned above. In a traffic information system, the essential factor is real-timeliness, which helps road users to realize traffic conditions immediately. Therefore, periodical report policies are not suitable for real-time information systems deployed in urban areas. To conclude our discussion so far, it is worth paying attention to design a FCD-based traffic information system which offloads the TIC and maintains the real-timeliness of information generated by the TIC.
1.3 Objective
In this thesis, we present a novel traffic report system and method with fast feedback to reduce the number of traffic reports from probe cars and maintain the real-timeliness of the traffic information generated by the TIC. Our traffic information system has the following features:
(1) Providing real-time traffic information.
(2) Reducing communication requirements for FCD-based traffic information systems.
(3) A conditional report policy for probe cars.
Our contribution of this thesis is to propose a report policy that not only reduces communication requirements but also maintains the real-timeliness of the traffic information. We believe our work is valuable since there are few traffic information
5
systems that can offload TIC and maintain the real-timeliness of information at the same time. We will describe the report policy in details in later chapters.
1.4 Summary
The remaining part is organized as follows. Chapter 2 describes the current work in Floating Car Data related to our system. Chapter 3 describes our system design in details. Chapter 4 discusses the results in our system. Finally, we give our conclusions in Chapter 5.
6
Chpter 2 Background and Related
Work
2.1 FCD-based Traffic Information Systems
Currently, traffic information systems using FCD can be classified according to the structure used. Generally speaking, traffic information systems fall into two categories. One way uses a centralized structure, and the other way is decentralized.
In a traffic information system based on a centralized structure, probe cars send traffic information to a centralized server named traffic information center (TIC). After receiving traffic information, the TIC processes and stores the messages sent by probe cars. To provide traffic information to road users, the TIC broadcasts the calculated data periodically. As probe cars travel along a road network, they collect traffic information and report their information to the TIC. These reports act as measurements of the traffic conditions; the TIC uses them to update current traffic conditions. Since probe cars are able to collect traffic information continuously, they act like mobile sensors that detect traffic conditions from place to place. In order to accurately reflect traffic conditions in urban areas, probe cars have to float in the traffic stream. In other words, they must be distributed widely. To achieve this, taxi fleets are especially suitable due to their high density in the cities. Each probe car has to be equipped with a wireless communication device and a positioning device. The wireless communication device is used to send or receive traffic information, and the positioning device is used to determine the position of the probe car and, further, to collect traffic information. This structure can be considered as a client/server
7
architecture, since the TIC has a global view of the road network. Most traffic information systems we have studied adopted this type of structure. In this thesis, we also use the centralized structure to design our system.
In contrast to the centralized structure, Wischhof et al. [8] have proposed a decentralized traffic information system based on inter-vehicle communications. In their system, probe cars communicate with each other via wireless radio. Each probe car broadcasts traffic information to other probe cars periodically. Obviously, there is no central server in their system; probe cars share traffic information with each other. Therefore, this type of structure can be viewed as a peer-to-peer (P2P) architecture.
2.2 Positioning Technologies of FCD
In a traffic information system using FCD, the crucial part is to obtain traffic information from vehicles by using positioning technologies. In this section, we introduce two types of positioning technologies used in FCD: the Global Position System (GPS) and mobile phone tracking.
2.2.1 Global Position System
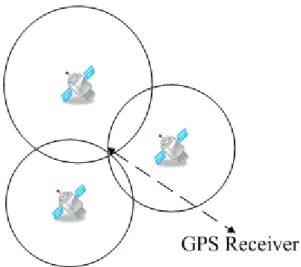
The basic principle of GPS is to use a receiver to measure the time difference of satellite signals. As we all know, distance equals rate times time. In the case of GPS, the satellite signal travels at the speed of light. In addition to knowing how long the satellite signal travels, the distance between the GPS receiver and the satellite can be easily calculated. Upon receiving multiple signals transmitted from multiple satellites, the position of the GPS receiver can be computed by using a triangulation method. The basic principle of triangulation method is to use at least three reference points to determine the position of an object that is within the intersected area triangulated by
8
these reference points. The more reference points, the more accurate the position. As shown in Fig. 2-1, each circle represents a possible position of the GPS receiver, and the exact position of the GPS receiver is at the intersection of the three circles. By using four satellites as reference points, the GPS receiver is able to calculate its latitude, longitude, and altitude. Therefore, GPS can be used to detect location, direction, and speed anywhere on Earth, and it has generally high position accuracy. However, it suffers from a problem known as urban canyon effect. There are usually many tall buildings in the urban cities, which causes GPS receivers being unable to obtain satellite signals from sky.
Fig. 2-1 An example of the triangulation method.
Although GPS was originally developed by the Department of Defense (DOD) for military purpose, it has been widely used in consumer market for in-vehicle navigation systems recently. With the increasing usage of on-board GPS devices, it becomes feasible to obtain traffic information from GPS-equipped probe cars. Therefore, there have been many studies concerned with the application of automatic vehicle location (AVL) that employ GPS for vehicle tracking in the past few years. A field test of the California PATH Program [9] showed that GPS is an effective tracking mechanism for the purpose of collecting traffic information.
9
2.2.2 Mobile Phone Tracking
Another emerging technology for positioning is mobile phone tracking that can be broadly divides into three categories: network-based, MS-based, and hybrid methods. Usually, floating cellular data methods adopt network-based positioning technologies. The other two categories, MS-based and hybrid, are adopted by GPS-base probe cars. We describe these three types of approaches separately in the following paragraphs.
In network-based methods, the position is calculated by the service provider's network infrastructure. Network-based methods are grouped into two categories according to the number of involved base stations (BSs), that is, only one BS or multiple BSs. Methods requiring one BS include the cell identification (Cell-ID) and the location fingerprinting (LF). Methods requiring more than one BS include the received signal strength (RSS), the angle of arrival (AOA), the time of arrival (TOA), and the time difference of arrival (TDOA). The advantage of network-based methods is that they do not need to set up additional hardware, and there is no need to modify mobile phones. Because related infrastructures already exist, network-based methods are cost-effective and highly available. However, network-based probe cars cannot generate highly accurate traffic information compared to GPS-based probe cars.
Since the usage of mobile phones has grown rapidly in past decade, several studies explored the feasibility of using service providers as sources of traffic information. The Do-iT (Data Optimization for Integrated Telematics) project [10] evaluated the accuracy of network-based GSM data for mobile positioning. Compared to GPS data, network-based data presented standard deviations of approximate 300 meters. Consequently, they indicated that further improvements were needed.
10
In MS-based methods, on the other hand, the position is majorly calculated by the mobile phone itself. Typically, a mobile phone equipped with a GPS module falls into this category. In contrast to network-based methods, MS-based methods need to install special software on a mobile phone, and the mobile phone must be able to run such software.
Hybrid methods, such as Assisted GPS (A-GPS), combine network-based with MS-based methods in order to improve the performance of positioning technologies. As we mentioned before, traditional GPS suffers from the urban canyon effect. To address the problem, A-GPS uses an assistance server that provides assistance data to a GPS receiver; in other words, A-GPS uses both GPS and network information to calculate the position of the mobile phone. With network assistance, the GPS receiver can obtain satellite signals more efficient and faster. Consequently, A-GPS has the best performance compared with other mobile phone tracking methods.
2.3 Report Policies for Communication Reduction
A report policy is a method used by individual probe cars to decide whether or not to send traffic information to the TIC. In this section, we discuss three report policies which are able to reduce communication requirements.
Kerner et al. [11] have developed a FCD-based traffic information system using a velocity threshold to reduce messages sent to the TIC. The TIC broadcasts travel time data with threshold values to probe cars. Comparing with the threshold values, each probe decides whether or not to send its travel time to the TIC. The decision is based on the equation:
11
,
c b d
TT TT TT (2.1)
where TTc is the current travel time of the probe car, TTb is the travel time broadcasted by the TIC, and TTd is the threshold value. If the difference between TTc and TTb is greater than TTd, then the probe car reports its TTc to the TIC. Using threshold values does reduce the amount of messages sent to the TIC, but the accuracy of the generated traffic information is decreased.
Tanizaki and Wolfson [12] have designed the randomized policy to improve the velocity threshold approach. Basically, the randomized policy is based on Equation (2.1), except that they introduced a transmission probability to the velocity threshold approach. When Equation (2.1) is satisfied, each probe car decides whether or not to report according to the probability broadcasted by the TIC. The randomized policy generates incomplete traffic information, which is the same problem as in the velocity threshold approach.
To overcome the drawbacks of velocity threshold approach, Ayala et al. [13] introduced the flow-based report policy in FCD-based traffic information systems. In their system, the report policy uses a probability that is inversely proportional to a traffic flow estimated by using Greenshields model. Each probe cars decides whether or not to report according to the probability broadcasted by the TIC. Therefore, the method successfully reduces the amount of messages sent to the TIC. Compared to the threshold method, results of the flow-based method showed that they generated more accurate traffic information. However, Greenshields model depicts the traffic conditions on highways. There is no suitable traffic flow model that is able to accurately reflect the traffic conditions in urban areas.
12
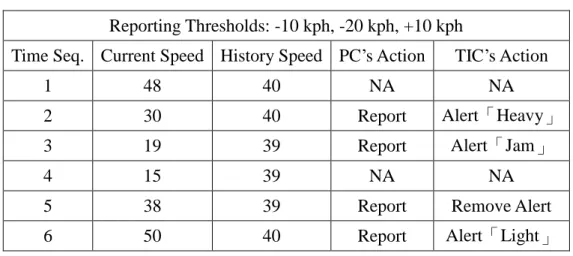
Van Buer et al. [14] proposed a method for the purpose of determining and reporting a traffic anomaly. In their system, each probe car has an on-board database that records its historical travel data, and it determines its speed discrepancy during each journey. In order to determine the speed discrepancy, each probe car compares its current speed with the average of its related historical data. To decide whether or not to report, the probe car compares the speed discrepancy to a set of predefined values (i.e. reporting thresholds). If the speed discrepancy satisfies one predefined value, then the probe car reports its current speed to the TIC. When receiving a report, the TIC generates and broadcasts an alert that indicates the current traffic state. After receiving an alert from the TIC, each probe car has to compare the discrepancy to the alert, instead of comparing with the reporting thresholds. An example of this report policy is shown in Table 2-1. Although the system they proposed successfully reduces communication requirements, the disadvantage is that each probe car utilizes its local data to decide whether or not to report. When different drivers who have different driving style drive the same probe car, it is likely to generate anomalous data. Accordingly, the probe car reports wrong data to the TIC. To avoid this problem, we consider using global information for comparison.
Table 2-1 An example of the report policy. Reporting Thresholds: -10 kph, -20 kph, +10 kph
Time Seq. Current Speed History Speed PC’s Action TIC’s Action
1 48 40 NA NA
2 30 40 Report Alert「Heavy」
3 19 39 Report Alert「Jam」
4 15 39 NA NA
5 38 39 Report Remove Alert
13
Chpter 3 The System Design
3.1 System Overview
Our system consists of two parts: a traffic information center and a group of probe cars. In this thesis, we use a centralized architecture to design our system. Fig. 3-1 depicts the system architecture of our system, and the functions of each component will be described below.
Traffic Information Center (TIC)
Road segment 1 Road segment 2
Wireless Communication
Probe Cars
Dedicated Short Range Communications
(DSRC) GPS
Fig. 3-1 The System Architecture.
The traffic information center (TIC) is a centralized server which receives the traffic reports from probe cars and provides traffic information to the probe cars and the public. The TIC has a global view of the entire road network, where each road is divided into segments of about 1-3 kilometers in length; in other words, our system is a segment based traffic information system. The boundaries of the road segments are road intersections. Each road segment is identified by a unique identifier, and traffic
14
information data, such as speed and travel time, of each road segment will be collected and broadcasted by the TIC. After receiving traffic data from probe cars, the TIC processes them and stores the calculated data in a database. In order to update current traffic conditions, the TIC has to compare received data with previous data in the database. The comparison is made according to the type of information that the system designed to obtain. In the case of maximum value, for example, the TIC updates the database when the value of received data is greater than previous data. The TIC is responsible for disseminating information of traffic conditions. In order to provide traffic information to road users, the TIC broadcasts traffic information periodically through the Dedicated Short Range Communications (DSRC). DSRC is a wireless communications service designed for the operations in roadside-to-vehicle communication environments. Using DSRC, traffic information can be displayed on an on-board vehicle radio system.
We assume that each probe car is equipped with a GPS receiver and a wireless communication device. With the increasing progress in positioning and wireless data communication capability, it becomes possible to obtain traffic information from GPS-equipped probe cars. At each point in time, each probe car continuously determines its current position using the GPS receiver. Using the measured GPS data, each probe car is able to calculate its travel conditions, such as speed and travel time, easily and accurately. Our goal is to design a report policy for the probe cars that in order to reduce reduces the number of reports transmitted and maintain the real-timeliness of the traffic information collected by the TIC. When a probe car determines that it is time to report, according to the report policy, it sends its current traffic condition to the TIC via its wireless communication device.
15
3.2 The Maximum Speed
The maximum speed of each road segment is an indicator of the traffic condition. We have designed a traffic information system to collect and disseminate the maximum speed. The goal of our design is to minimize the traffic reports sent to the TIC while maintain the real-timeliness of the traffic conditions broadcasted by the TIC. We propose a report policy where the probe cars selectively report their current speed to the TIC. Basically, faster probe cars would report earlier, so that slower probe cars do not need to report. Table 3-1 lists the notation and definition of variables used in this system.
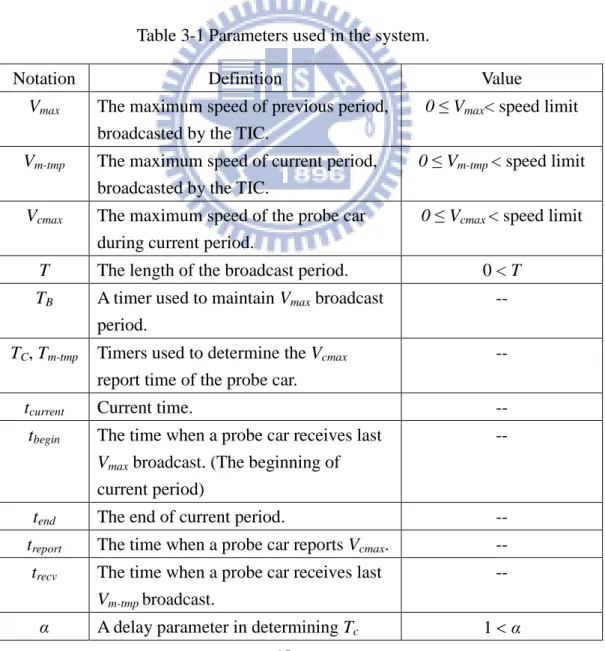
Table 3-1 Parameters used in the system.
Notation Definition Value
Vmax The maximum speed of previous period, broadcasted by the TIC.
0 ≤ Vmax< speed limit
Vm-tmp The maximum speed of current period,
broadcasted by the TIC.
0 ≤ Vm-tmp < speed limit
Vcmax The maximum speed of the probe car
during current period.
0 ≤ Vcmax < speed limit
T The length of the broadcast period. 0 < T
TB A timer used to maintain Vmax broadcast period.
--
TC, Tm-tmp Timers used to determine the Vcmax
report time of the probe car.
--
tcurrent Current time. --
tbegin The time when a probe car receives last
Vmax broadcast. (The beginning of current period)
--
tend The end of current period. --
treport The time when a probe car reports Vcmax. --
trecv The time when a probe car receives last
Vm-tmp broadcast.
--
16 when a probe car receives Vmax broadcast.
β A delay parameter in determining Tm-tmp when a probe car receives Vm-tmp
broadcast.
1 < β
3.2.1 Traffic Information Center
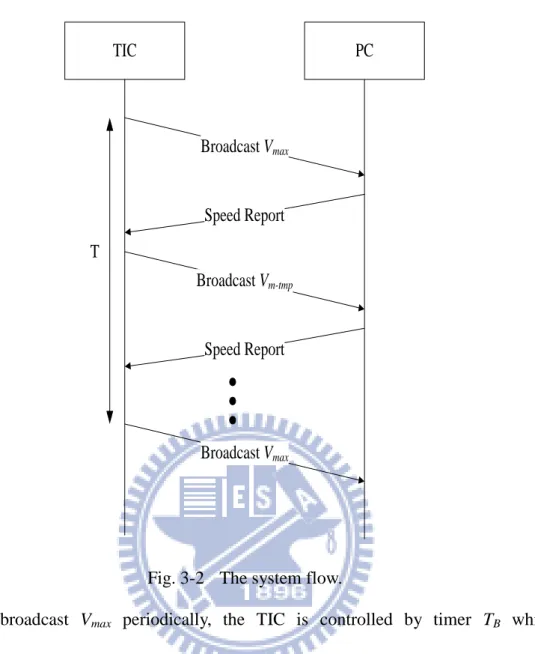
In order to obtain the maximum speed of each road segment and to ask for fast feedback from probe cars, the TIC needs to disseminate two types of traffic information: the maximum speed Vmax and the temporary maximum speed Vm-tmp. Vmax is the maximum speed obtained in the previous period, and Vm-tmp is the maximum speed received in the current period. The TIC periodically broadcasts Vmax to the probe cars. In addition, the TIC broadcasts Vm-tmp immediately when it receives a report of a higher value from a probe car. It should be noted that the coverage area of the broadcast of Vmax and the Vm-tmp is only limited to the corresponding road segments and the neighboring segments. This can be easily done in a DSRC network. Fig. 3-2 illustrates the system flow.
17 TIC PC Broadcast Vmax Speed Report Broadcast Vm-tmp Speed Report Broadcast Vmax T
Fig. 3-2 The system flow.
To broadcast Vmax periodically, the TIC is controlled by timer TB which determines how long the period is. The time length of timer TB, which is denoted T, is a predefined value that is set by the TIC and broadcasted to all the probe cars. Whenever timer TB expires, the TIC has to broadcast Vmax and reset timer TB to its original value. Since the broadcast interval is short (e.g., 30 sec.), probe cars are able to obtain the maximum speed of each road segment in almost real time.
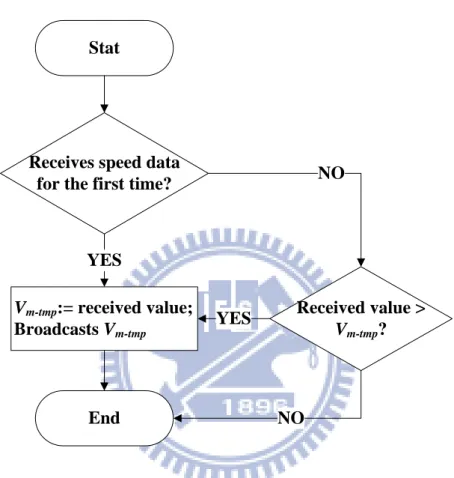
Before timer TB expires, the TIC broadcasts Vm-tmp when receiving speed report sent by probe cars for the first time in the current period. Vm-tmp represents the maximum speed received in the current period. Fig. 3-3 depicts the flow chart of the TIC when it receives speed reports. When the TIC receives a speed report from a probe car for the first time in the current period, it sets Vm-tmp to the reported value by
18
the probe car and then broadcasts Vm-tmp. Later in the period when it receives speed reports, the TIC has to compare Vm-tmp with the received speed. If the received speed is greater than Vm-tmp, then the TIC sets Vm-tmp to the received value and broadcasts
Vm-tmp.
Stat
Receives speed data for the first time?
Received value > Vm-tmp? Vm-tmp:= received value; Broadcasts Vm-tmp NO YES NO YES End
Fig. 3-3 A flow chart of when the TIC receives speed data.
3.2.2 Probe Cars
Each probe car needs to measure and maintain its own speed-related value—the maximum speed in the current period denoted by Vcmax. Note that the speed we considered is not the instantaneous speed, but the average speed over a short interval of time (e.g., 5 sec.). To update Vcmax, each probe car has to check if its current average speed exceeds Vcmax. If so, Vcmax is set to such value. It should be noted that
Vcmax is calculated on a per period basis, i.e., Vcmax is reset whenever each probe car receives Vmax from the TIC.
19
The report policy used in the system is an approach that provides fast feedback to the TIC while each probe car selectively reports Vcmax to reduce the report traffic. The basic principle of our policy is to make sure that faster probe cars report earlier than slower ones. To illustrate the report policy, we describe the operation of each probe car based on the following five scenarios:
(1) When receiving Vmax
(2) When receiving Vm-tmp
(3) When Vcmax increases
(4) When entering a new segment
(5) When at the time of report
In the first scenario, each probe car sets up timer TC immediately when it receives Vmax from the TIC. Let tbegin denote the time when the probe car receives Vmax; in other words, tbegin stands for the begging of current period. Let tcurrent denote the current time, and then Vcmax represents the maximum speed between tbegin and tcurrent. Thus the timeout period of timer TC is set as follows:
max max max , c V V T V (3.1)
where α is an adjustable parameter. Equation (3.1) was chosen so that the higher Vcmax induces the shorter length of timer TC. Using Equation (3.1) we can set the report time of each probe car as:
max ,
report begin C current
20
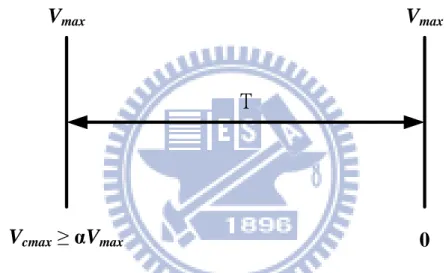
Both Equation (3.1) and Equation (3.2) were chosen with the objective that the probe cars with faster speed would report their speed to the TIC earlier than those with slower speed. Fig. 3-4 illustrates the relationship between the timeout period of
TC and Vcmax. If the value of Vcmax is greater than or equal to αVmax, then treport is set to be tcurrent, i.e., the probe car must report immediately. On the other hand, if the value of Vcmax is 0, then treport is set to be tbegin plus T, i.e., the probe car would report at the end of current period, which means it is impossible to report. Consequently, the faster the probe car is, the earlier it reports.
V
maxV
maxT
V
cmax≥ αV
max0
Fig. 3-4 The relationship between the timeout period of TC and Vcmax.
In the second scenario, each probe car disables timer TC when it receives Vm-tmp broadcasted by the TIC; in other words, each probe car sets treport to be infinite. The objective is to prevent slower probe cars which have longer timer TC from reporting. Therefore, the amount of messages sent to the TIC is reduced. This can be done by considering the fact that slower probe cars have longer timer TC, which means they have not reported before they receive Vm-tmp. When they receive Vm-tmp, however, they do not have to report.
The third scenario happens when Vmax increases. Since a probe car driver is unlikely to drive at the same speed, we need to take the speed increment into account.
21
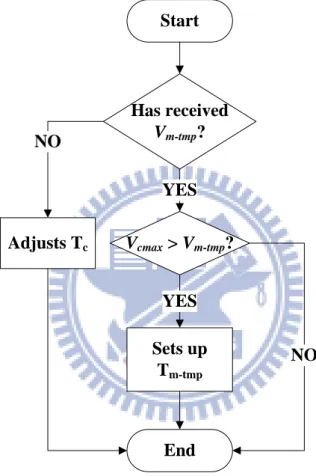
The third scenario was handles differently depending on whether the probe car has received Vm-tmp or not. Fig. 3-5 depicts the flow chart of a probe car when it receives
Vm-tmp. If not having received Vm-tmp in the current period, the probe car shortens the
timeout period of timer TC and thus reports earlier. The objective is to reflect the speed change as soon as possible. On the other hand, if having received Vm-tmp the probe car compares Vcmax with Vm-tmp. If Vcmax is greater than Vm-tmp, then the probe sets up timer Tm-tmp. Let trecv denote the time when the probe car receives Vm-tmp. Let tend be
tbegin plus T; in other words, tend stands for the end of the current period. The timeout
period of timer Tm-tmp is set as follows:
max ( ), ( 1) m tmp c end recv m tmp V V t t V (3.3)
where β is an adjustable parameter. Using Equation (3.3) we can set the report time of the probe car as:
max ,
report recv m tmp current
t t T t (3.4)
Both Equation (3.3) and Equation (3.4) were chosen so that the probe cars that accelerate faster (i.e. Vcmax-Vm-tmp) would report their speed to the TIC earlier than those that accelerate slower. Another objective is to prevent a probe car from reporting frequently when it steadily accelerates. For example, a probe car without the control of timer Tm-tmp is likely to report very frequently while the traffic light turns green. The probe car is steadily accelerating in this situation, and it reports Vcmax to the TIC repeatedly no matter what its acceleration rate is. Nevertheless, a probe car with timer
Tm-tmp has to wait for a larger moment to report when its acceleration is slow. Fig. 3-6
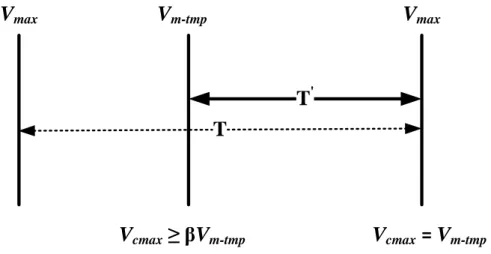
22
of Vcmax is greater than or equal to βVm-tmp, then treport is set to be tcurrent, i.e., the probe car has to report immediately. On the other hand, if the value of Vcmax is equal to
Vm-tmp, then treport is set to be tend, that is, the probe car would report at the end of
current period, which means it is impossible to report. Consequently, the faster the probe car accelerates, the earlier it reports.
Start Vcmax > Vm-tmp? Sets up Tm-tmp YES Has received Vm-tmp? YES Adjusts Tc NO NO End
23
V
maxV
maxV
cmax≥ βV
m-tmpT
V
m-tmpT
'V
cmax= V
m-tmpFig. 3-6 The relationship between the timeout period of Tm-tmp and Vcmax. In the fourth scenario, each probe car acts in the same way as in the third scenario, which means, depending on whether it has received Vm-tmp or not. The objective is to avoid missing potential speed reports; the TIC can obtain the real Vmax. To simplify the complexity of system, we assume that the traffic information of adjacent road segments is available to the probe cars. Therefore, we can focus on the operation in one road segment.
At the time of report, each probe car transmits its Vcmax to the TIC via wireless communications. To put it differently, each probe car reports Vcmax when timer TC or timer Tm-tmp expires.
3.3 The Minimum Travel Time
The minimum travel time can also be an indicator of the traffic condition. The traffic information system for provision of the minimum travel time acts in a similar way as in the one that disseminates the maximum speed. Basically, probe cars that have shorter travel time would report earlier, so that probe cars that have longer travel time do not need to report. Table 3-2 lists notation and definition of variables used in this system.
24
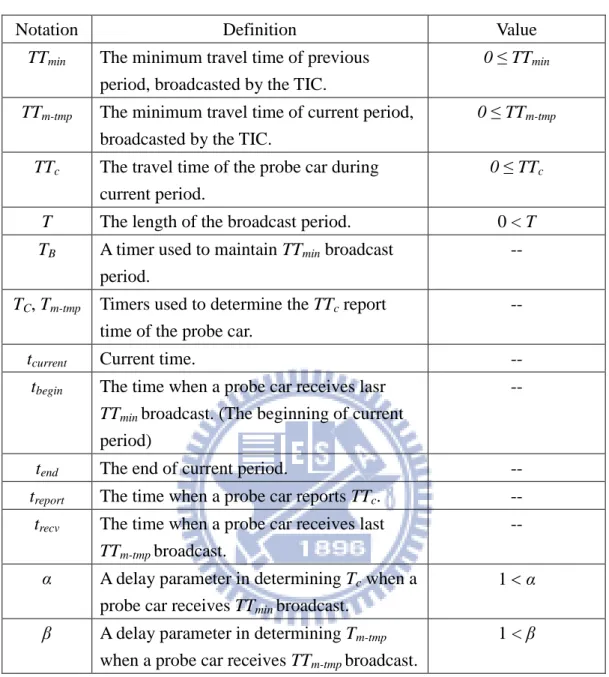
Table 3-2 Parameters used in the system.
Notation Definition Value
TTmin The minimum travel time of previous period, broadcasted by the TIC.
0 ≤ TTmin
TTm-tmp The minimum travel time of current period,
broadcasted by the TIC.
0 ≤ TTm-tmp
TTc The travel time of the probe car during current period.
0 ≤ TTc
T The length of the broadcast period. 0 < T
TB A timer used to maintain TTmin broadcast period.
--
TC, Tm-tmp Timers used to determine the TTc report
time of the probe car.
--
tcurrent Current time. --
tbegin The time when a probe car receives lasr
TTmin broadcast. (The beginning of current
period)
--
tend The end of current period. --
treport The time when a probe car reports TTc. --
trecv The time when a probe car receives last
TTm-tmp broadcast.
--
α A delay parameter in determining Tc when a probe car receives TTmin broadcast.
1 α
β A delay parameter in determining Tm-tmp when a probe car receives TTm-tmp broadcast.
1 < β
The TIC periodically broadcasts TTmin, which stands for the minimum travel time obtained in the previous period. The interval of broadcasting TTmin is T, which is controlled by timer TB. The TIC also broadcasts TTm-tmp, which means the minimum of current travel time reported from the probe cars when its value decreases. The process of broadcasting TTm-tmp is similar to broadcasting Vm-tmp.
Each probe car computes TTc, which stands for its travel time, when reaching the end of segment it is traveling on. The basic principle of report policy used in this system is similar to the one we presented in Section 3.2.2. The objective is to make
25
the probe cars which have shorter TTc report earlier than those which have longer TTc. The operation of each probe car is based on the following four scenarios:
(1) When receiving TTmin
(2) When entering a new segment
(3) When receiving TTm-tmp
(4) When at the time of report
When receiving TTmin, each probe car simply stores TTmin and tbegin in its database. In addition, each probe car has to disable timer TC and timer Tm-tmp. That is, it sets
treport to be infinite.
When entering a new segment, each probe car has to set up timer TC. The timeout period of timer TC is set as follows:
min min min , 1 ( ) 2 c c TT TT T TT (3.5)
where α is an adjustable parameter. Equation (3.5) was chosen so that the shorter TTc induces the shorter length of timer TC. We can use both Equation (3.2) and Equation (3.5) to set the report time of the probe car. Fig. 3-7 depicts the relationship between the timeout period of TC and TTc. It should be noticed that a probe car would never report when its TTc is greater than or equal to 2TTmin. Theoretically, the threshold is supposed to be infinite. Considering the fact that subsequent TTmin is unlikely to change too much, however, we define 2TTmin as a proper threshold.
26
TTmin TTmin
T
TTc ≤ TT1 min TTc ≥ 2TTmin
Fig. 3-7 The relationship between the timeout period of TC and TTc.
When receiving TTm-tmp, each probe car disables timer TC and compares TTc with
TTm-tmp. If TTm-tmp is greater than TTc, then the probe car sets up timer Tm-tmp. The
timeout period of timer Tm-tmp is set as follows:
min min ( ), ( 1) c m tmp end recv c TT TT t t TT (3.6)
where β is an adjustable parameter. Equation (3.6) was chosen so that the shorter TTc induces the shorter length of timer Tm-tmp. Therefore, we can set the report time of the probe car by using both Equation (3.4) and Equation (3.6). Fig. 3-8 illustrates the relationship between the timeout period of Tm-tmp and TTc.
In the fourth scenario, each probe car reports its TTc to the TIC when at the time of report. As we mentioned in Section 3.2.2, each probe car reports when timer TC or timer Tm-tmp expires.
27 TTmin TTmin TTc ≤ TTm-tmp T TTm-tmp T' TTc = TTm-tmp 1
28
Chpter 4 Evaluation and Analysis
4.1 Simulation Environment and Parameters
The scenarios presented in this thesis simulate the traffic of an urban arterial road of 2.4 km in HsinChu city, Taiwan. In order to evaluate the efficiency of the system we proposed, we have developed a simulation system that uses the traffic model simulator VISSIM [15]. Table 4-1 shows an example of sequence data generated by VISSIM. The data record consists of a record of time, a probe car’s identifier, a probe car’s current speed, and an identifier of the road segment that the probe car drives on. Using these data, we can obtain enough traffic information of the probe cars. The simulation system allowed us to obtain a detailed analysis of the performance of proposed methods.
Table 4-1 The sequence data generated by VISSIM. Simulation time ID of probe car Speed (kph) Segment ID
302 278 46.4 1 302 20 45.8 3 303 278 45.5 1 303 20 45.3 3 304 278 44.6 1 304 20 44.7 3
Table 4-2 lists the parameters used for the simulation we have developed. In the simulation, we simulate a traffic situation which reflects the entire period of traffic congestion, i.e., the traffic flow changes from light to heavy to light again. In this simulation, traffic congestion can be divided into 3 intervals: (1) congestion emergence for 700 seconds, (2) congested traffic for 1300 seconds, and (3) congestion
29 disappearance for 1600 seconds.
Table 4-2 Parameters used in the simulation.
Total road length 2400 m
Number of lanes 3
Number of segments 4
Desired Speed 40 ~ 50 kph (uni. distributed) Composition of traffic 20% probe cars, 80% regular Broadcast interval (T) 30 (s)
Evaluation time 3600 (s)
Traffic flow 1500 -> 2000 -> 800 (veh/hr)
4.2 The Maximum Speed
In the simulation, each probe car updates its speed every second. In order to reflect overall traffic conditions of a segment, these speed data are averaged with previous 30 instantaneous speeds. The reason is that simply using instantaneous speed data would only reflect partial traffic conditions, especially in the areas near road intersections. For example, a probe car would drive at high speed for a moment when the traffic light turns green. In this case, the maximum instantaneous speed does not reflect the general traffic condition of whole segment. However, average data set represents the traffic situation of a period of time, generating proper traffic information.
In the experiments of the traffic information system providing Vmax, we evaluate the performance of our system at first. We compare our system with conventional system using periodical policy. In the case of periodical policy, each probe car reports its Vcmax to the TIC periodically. The report cycle is set to be 30 seconds, which is the same as the TIC’s broadcast interval. In addition, each probe car reports when entering a new segment. To compare both systems, we use two metrics to measure
30
them during the evaluation of simulations. One is the communication cost, which is defined as the amount of messages probe cars report per period. The other is the error, which is calculated as the mean difference between the real Vmax and the computed
Vmax; in other words, the error is defined as the mean absolute error (MAE). In this experiment, the broadcast latency of the TIC is set to be half of a second, and the parameters used in the report policy, α and β, are chosen from experiment. In order to obtain the minimum communication cost, these parameters are set to 1.1 and 1.4 respectively. Table 4-3 shows the comparison of conventional system and proposed system.
Fig. 4-1 plots the comparison of total amount of messages obtained by different values of α with varying values of β. This graph shows that our system generates the minimum amount of messages when α is 1.1. The reason is that the bigger α induces the longer length of timer TC, and the time difference between tend and trecv is smaller.
Therefore, the length of timer Tm-tmp is short. Several probe cars almost report Vcmax at the same time because their timer lengths are similar. We also observe that the amount of message is high when β is small, and the amount of message is high when β is big as well. If β is small, then probe cars would report frequently when accelerating. On the other hand, big β induces a long length of timer Tm-tmp. As a result, probe cars report Vcmax almost at the end of current period. Since broadcast has latency, these probe cars report Vcmax before receiving Vtmp, resulting in growing amount of messages.
Table 4-3 The comparison of convention and proposed system.
Segment Time Vmax
Convention Proposed Vmax Report Count Vmax Report Count
31 1 1170 32 35 4 32 1 1200 43 40 8 43 7 2 1170 42 42 27 42 1 1200 38 40 8 38 1 3 1170 42 42 18 42 5 1200 40 42 21 40 1 4 1170 31 31 25 31 2 1200 35 31 41 35 2
Fig. 4-1 β and total amount of messages.
Table 4-4 shows the results of performance. The proposed system performed significantly better than the conventional one. The communication cost of the conventional system was 24.875, while the proposed one only generated 2.3 messages per period. In terms of the error metric, the proposed system produced no error, i.e., it can generate the actual Vmax. The findings indicate that our system not only reduces communication requirements but also maintains the real-timeliness of generated traffic information. 1050 1100 1150 1200 1250 1300 1.1 1.2 1.3 1.4 1.5 1.6 1.7 1.8 1.9 2 T ot al Am ou n t of M essages
β
α = 1.1 α = 1.3 α = 1.5 α = 1.732
Table 4-4 The results of performance.
Method Communication cost
(messages/period)
MAE
Convention 24.875 1.525
Proposed 2.3 0
In the next part of the experiments, we examine the accuracy of our system to show that we can use Vmax as a good metric for detection of traffic states. First of all, we have to determine traffic states by using average speed, which is denoted as Vavg. The reason is that traffic engineers conventionally utilize average speed to analyze the efficiency of transportation, and they commonly use the level of service (LOS) to measure and determine the traffic state. Based on the Highway Capacity Manual in Taiwan [16], we can quantitatively classify Vavg into three levels as follows:
(1) Red: Vavg < 16 (kph),
(2) Yellow: 16 ≤ Vavg < 25 (kph),
(3) Green: 25 ≤ Vavg,
where red level stands for traffic jam, yellow stands for heavy traffic, and green level represents light traffic. The second step is to determine traffic states by using Vmax. We use two adjusting thresholds to classify the data of Vmax generated by the TIC. One is
Vyellow, and the other is Vgreen. These two thresholds are calculated according to the
empirical data of average speed. Vyellow is computed as the minimum Vmax during the period of green level, and Vgreen is computed as the minimum Vmax during the period of yellow level. Table 4-5 shows an example of selection of Vyellow and Vgreen. According to the rule, Vyellow is chosen to be 36, and Vgreen is chosen to be 41. To get the best
33
overall accuracy, a slight adjustment may be needed. Table 4-6 shows an example of adjustment. The accuracy improves when Vgreen is adjusted to be 42. It should be noted that both Vyellow and Vgreen are calculated segment by segment. Since different segments have different traffic conditions, each segment has its own Vyellow and Vgreen. Therefore, we can use Vyellow and Vgreen to classify Vmax into three levels as follows:
(1) Red: Vmax < Vyellow,
(2) Yellow: Vyellow ≤ Vmax < Vgreen,
(3) Green: Vgreen ≤ Vmax.
Table 4-5 An example of selection of Vyellow and Vgreen.
Vyellow: 36, Vgreen: 41
Vavg Level Vmax Level
29 G 42 G 28 G 41 G 25 G 42 G 25 Y 43 G 22 Y 41 G 23 Y 40 Y 23 Y 41 G 23 Y 41 G 21 Y 40 Y 22 Y 36 Y
Overall accuracy(True Positive): 60 % Table 4-6 An example of adjustment.
34
Vavg Level Vmax Level
29 G 42 G 28 G 41 Y 25 G 42 G 25 Y 43 G 22 Y 41 Y 23 Y 40 Y 23 Y 41 Y 23 Y 41 Y 21 Y 40 Y 22 Y 36 Y
Overall accuracy(True Positive): 90 %
Table 4-7 shows an example of classification using Vavg. The traffic flow in this example is set to be light and stable. We can observe that these data fluctuate periodically due to the effect of traffic lights, i.e., red level occurs at time 510 and 630. However, each traffic state is supposed to be green level because of stable traffic. Since these data fluctuate and therefore generate incoherent information, we smooth them out by using simple moving average (SMA) algorithm. As shown in Table 4-8, these data are averaged with previous 4 samples. As a result, these data generate understandable traffic information after smoothed out.
Table 4-7 An example of classification.
Time Vavg (kph) Level
450 38 G
480 37 G
510 13 R
35
570 41 G
600 34 G
630 12 R
Table 4-8 An example of classification after smoothing out the data.
Time Vavg (kph) Level
450 35 G 480 35 G 510 32 G 540 32 G 570 32 G 600 32 G 630 31 G
After determine the classification rule successfully, we validate the accuracy of data derived from Vmax in terms of LOS. A result is considered correct or true positive when the traffic state derived from Vmax matches with the one derived from Vavg. The accuracy results of data derived from Vmax are shown in Table 4-9. The evaluation results show that true positive rates range from 0.700 to 1.000, false positive rates range from 0.000 to 0.104, and the average accuracy achieves 94.79%. Consequently, the findings indicate that Vmax provides highly accurate LOS.
Table 4-9 The accuracy of data derived from Vmax. a. Segment 1: 615 m Vyellow: 31, Vgreen: 39
Level Occurrences True Positive rate False Positive rate
Green 43 1.000 0.104
Yellow 17 0.765 0.039
36
Overall accuracy (True Positive): 90.00 % b. Segment 2: 500 m Vyellow: 35, Vgreen: 40
Level Occurrences True Positive rate False Positive rate
Green 30 1.000 0.000
Yellow 8 1.000 0.000
Red 82 1.000 0.000
Overall accuracy (True Positive): 100.00 % c. Segment 3: 461 m Vyellow: 36, Vgreen: 42
Level Occurrences True Positive rate False Positive rate
Green 10 0.800 0.055
Yellow 20 0.700 0.020
Red 90 1.000 0.000
Overall accuracy (True Positive): 93.33 % d. Segment 4: 740 m Vyellow: 31, Vgreen: 40
Level Occurrences True Positive rate False Positive rate
Green 7 1.000 0.018
Yellow 64 0.969 0.054
Red 49 0.939 0.000
Overall accuracy (True Positive): 95.83 %
4.3 The Minimum Travel Time
To show that our system is able to provide intuitive information of traffic trends to road users, we compared the traffic information system we developed with the traditional one using average travel time. In the case of obtaining average travel time, each probe car reports its travel time when it reaches at the end of segment. The TIC averages received data during each period. To analysis time trends, the evaluated length is 2400 meters in this experiment. In order to find out time trends, travel time data are also smoothed out by using SMA algorithm. In other words, these data are
37
averaged with previous 4 samples. The time difference between each sample is 30 seconds, which is the same as the broadcast interval.
Fig. 4-2 depicts the comparison of time trends between the average travel time (TTavg) and the minimum travel time (TTmin). The MAE between these two kinds of travel time data was 18.9, which was small. The results indicate that our system is capable of providing reliable traffic information to road users.
Fig. 4-3 is a scatter diagram which illustrates the relationships between TTavg and
TTmin. The correlation coefficient between them was 0.9987, which was very high.
The results show that TTmin is highly correlates with TTavg. Therefore, it is possible to use TTmin as a traffic indicator instead of using TTavg.
Fig. 4-2 Comparison of time trends between TTavg and TTmin. 0 100 200 300 400 500 600 700 800 900 1 9 17 25 33 41 49 57 65 73 81 89 97 105 113 121 129 T rave l T im e [se con d ] Time[period] TTavg TTmin
38
Fig. 4-3 Correlation between TTavg and TTmin. 0 100 200 300 400 500 600 700 800 900 0 200 400 600 800 1000 M m in im u m T rave l T im e [se con d ]
39
Chpter 5 Conclusions
In this thesis, we present a FCD-based traffic information system addressing the problem of reducing communication requirements. The system consists of a central traffic information server (TIC) and a group of probe cars equipped with GPS receivers. The TIC periodically broadcasts the maximum speed received from the last period, and immediately broadcast the maximum speed received in the current period. We proposed a report policy used by each probe car to determine whether or not to send its traffic information to the TIC. The basic idea of this policy is to prevent slower probe cars from reporting their speeds to reduce the amount of messages sent to the TIC. In addition to obtaining the maximum speed of each road segment, our system can provide the minimum travel time.
The results indicate that our method outperforms the periodical report approach in terms of communication cost, and maintains the real-timeliness of the traffic information collected. Furthermore, the findings suggest that using the maximum speed and the minimum travel time as traffic indicators are as good as using the average data.
The system proposed in this thesis is based on a centralized architecture, where each probe car communicates with the TIC. In contrast to the centralized architecture, a decentralized traffic information system is based on inter-vehicle communications, where each probe car communicates with each other, and it is an emerging topic in research. In the future work, we plan to adapt our system to the decentralized architecture, hoping to improve the efficiency of our system.
40
References
[1] Schrank, David, and Timothy Lomax, The 2009 Urban Mobility Report, Texas A&M University, Texas Transportation Institute, 2009.
[2] TANFB Traffic Information System, http://1968.freeway.gov.tw/
[3] TomTom, http://www.tomtom.com/
[4] IntelliOne, http://www.intellione.com/
[5] ITIS Holdings plc, http://www.itisholdings.com/
[6] Mediamobile, http://www.mediamobile.com/
[7] Feldman Israel, Meltzer, Yochay, Lavee Uri, et al., “System and Method for Geographically Locating a Mobile Device”, United States Patent 7620402, 2009. [8] Lars Wischhof, Andre Ebner, Hermann Rohling, Matthias Lott, and Rüdiger
Halfmann, “SOTIS - A Self-Organizing Traffic Information System”, in Proceedings of the 57th IEEE Vehicular Technology Conference, 2003.
[9] Y.B Youngbin Yim and Randall Cayford, “Investigation of vehicles as Probes Using Global Positioning System and Cellular Phone Tracking: Field Operational Test”, Report UCB-ITS-PWP-2001-9. California PATH Program, Institute of Transportation Studies, University of California, Berkeley, CA, 2001. [10] Katrin Ramm and Volker Schwieger, “Mobile Positioning for Traffic State Acquisition”, in Proceedings of 5th Symposium on Mobile Mapping Technology, 2007.
[11] B. Kerner, C. Demir, R. Herrtwich, S. Klenov, H. Rehborn,M. Aleksic, and A. Haug, “Traffic State Detection with Floating Car Data in Road Networks”, in
41
IEEE Proc. on Intelligent Transportation Systems, 2005.
[12] M. Tanizaki and O. Wolfson, “Randomization in Traffic Information Sharing Systems,” in GIS ’07: Proc. of the 15th annual ACM Intl. Symp. on Advances in Geographic Information Systems, 2007.
[13] Daniel Ayala, Jie Lin, Ouri Wolfson, Naphtali Rishe, and Masaaki Tanizaki, “Communication Reduction for Floating Car Data-based Traffic Information Systems”, 2010 Second International Conference on Advanced Geographic Information Systems, Applications, and Services Communication, 2010.
[14] Darrel J. Van Buer, Son K. Dao, Xiaowen Dai, et al., “Traffic Notification System for Reporting Traffic Anomalies Based on Historical Probe Vehicle Data”, US 7460948, 2008.
[15] VISSIM, http://www.ptvamerica.com/
[16] Tzu-Jung Cheng, Tyh-ming Lin, and Yu-Ching Ou-Yang, Highway Capacity Manual in Taiwan, Government Publication No.: 1009001056, 2001.