Plasma Uric Acid and the Risk of Type 2
Diabetes in a Chinese Community
Kuo-Liong Chien,1,2,3Ming-Fong Chen,2Hsiu-Ching Hsu,2Wei-Tien Chang,4Ta-Chen Su,2Yuan-Teh Lee,2* and Frank B. Hu1*
BACKGROUND: Previous cross-sectional studies have shown hyperuricemia to be prevalent among individ-uals with metabolic syndrome, but the evidence from prospective studies of an association between uric acid and diabetes risk is limited. We prospectively investi-gated the association between plasma concentrations of uric acid and the incidence of type 2 diabetes in Chinese individuals.
METHODS: We conducted a community-based pro-spective cohort study of 2690 participants (age range, 35–97 years) in the Chin-Shan Community Cardiovascular Cohort Study, who were found to be free of diabetes and cardiovascular disease during baseline assessment at study entry in 1990. During a median 9.0-year follow-up, 548 participants devel-oped type 2 diabetes.
RESULTS: High plasma uric acid concentrations were as-sociated with a higher prevalence of metabolic syn-drome. After adjustment for age, sex, body mass index, and other covariates, the relative risks (RR) of diabetes according to uric acid quintile were 1.11, 1.29, 1.40, and 1.63 [95% confidence interval (CI), 1.20 –2.23; P for trend ⬍0.001]. After additional adjustment for metabolic syndrome, the RR for comparing the partic-ipants in the fifth and first uric acid quintiles was 1.40 (95% CI, 1.02–1.92; P for trend⫽ 0.027). In joint anal-yses, participants who were in the highest uric acid quintile and also had metabolic syndrome had a 3.3-fold greater risk of diabetes (95% CI, 2.27– 4.94) than those in the lowest uric acid quintile and without met-abolic syndrome.
CONCLUSIONS: These findings suggest a modest positive association between plasma uric acid concentration and the incidence of type 2 diabetes in Chinese individuals.
The association between hyperuricemia and diabetes was partly mediated through the metabolic syndrome. © 2007 American Association for Clinical Chemistry
Identifying the risk factors for the development of type 2 diabetes is essential for primary prevention (1 ). Met-abolic syndrome and insulin resistance are well-estab-lished key risk factors for diabetes. Hyperuricemia, a highly prevalent condition in the adult population, is associated with obesity and insulin resistance (2 ). Al-though much of the literature addresses the association of hyperuricemia, hypertension, and renal disease (3, 4 ), the role of uric acid in diabetes risk remains controversial. Recent evidence suggests that uric acid plays a role in immune activation (5 ) and cytokine se-cretion (6 ). Moreover, uric acid has been identified as a mediator of endothelial dysfunction and systemic in-flammation (7 ). Previous cross-sectional data showed that hyperuricemia to be prevalent among individuals with metabolic syndrome (8 ), but the evidence from prospective studies of an association between uric acid and diabetes risk is limited. Therefore, we conducted a prospective community-based cohort study to exam-ine the association between plasma uric acid concen-tration and the risk of type 2 diabetes among ethnic Chinese in Taiwan.
Materials and Methods
STUDY DESIGN AND STUDY PARTICIPANTS
Details of this cohort study have been published (9 – 11 ). In brief, the Chin-Shan Community Cardiovascu-lar Cohort Study began in 1990 by recruiting 1703 men and 1899 women of Chinese ethnicity age 35 years and older from the Chin-Shan township, 30 km north of metropolitan Taipei, Taiwan. Information about an-thropometry, lifestyle, and medical conditions was
as-1Department of Nutrition, School of Public Health, Harvard University, Boston,
MA;2Department of Internal Medicine, National Taiwan University Hospital,
Taipei, Taiwan;3Institute of Preventive Medicine, College of Public Health,
National Taiwan University, Taipei, Taiwan;4Department of Emergency
Med-icine, National Taiwan University Hospital, Taipei, Taiwan.
* Address correspondence to these authors at: Department of Internal Medicine,
National Taiwan University Hospital, Taipei, Taiwan, 100. e-mail ytlee@ha.mc.ntu.edu.tw. Department of Nutrition, Harvard School of Public Health, Boston, MA. e-mail frank.hu@channing.harvard.edu.
Received July 20, 2007; accepted November 15, 2007. Previously published online at DOI: 10.1373/clinchem.2007.095190
sessed by interview questionnaires in 2-year cycles for the initial 6 years, and the validity and reproducibility of the collected data have been reported in detail (12 ). In brief, all study participants were individually interviewed with a structured questionnaire in the baseline survey (1990). Trained medical students can-vassed door to door with the assistance of community leaders to extend invitations to participate in the base-line survey to collect information about sociodemo-graphic characteristics, lifestyle behaviors, regular ex-ercise, and personal and family histories of diseases and hospitalizations. With the consent of participants, phy-sicians and students conducted physical examinations and laboratory tests for those participants invited to the clinic. Body mass index (BMI)5was calculated as the weight in kilograms divided by the height in meters squared. Waist circumference was measured with a measuring tape positioned midway between the lowest rib and the iliac crest. The measurement was made at minimal respiration status, with the tape snug but without compressing the skin. In 1990, we measured plasma biochemical biomarkers, including lipids, uric acid, and glucose, and assessed renal function; we re-peated these measurements in the subsequent fol-low-up cycles until 2000.
Participants with incomplete blood data (n⫽ 41), a diagnosis of diabetes (fasting glucoseⱖ7.0 mmol/L or with a history of hypoglycemic medication, n ⫽ 473), or a cardiovascular disease and cancer history (n⫽ 170) at baseline were excluded from this investi-gation. After these exclusions, the final analytic sample included 2960 participants. During the follow-up from 1990 –2000 (median, 8.97 years; interquartile range, 4.25–9.26 years), 548 individuals developed type 2 di-abetes, which was defined as a fasting glucose concen-trationⱖ7.0 mmol/L or by the use of oral hypoglyce-mic medications or insulin. The National Taiwan University Hospital Committee Review Board ap-proved the study protocol.
MEASUREMENT OF BIOCHEMICAL MARKERS
The procedure for blood collection has been reported elsewhere (13, 14 ). In brief, all venous blood samples drawn after a 12-h overnight fast were immediately re-frigerated and transported within 6 h to the National Taiwan University Hospital. Serum samples were then stored at⫺70 °C before batch assay of total cholesterol, triglycerides, and HDL cholesterol. Standard enzy-matic tests for serum cholesterol and triglycerides were used (Merck 14354 and 14366, respectively). HDL
cho-lesterol was measured in supernatants after the precip-itation of specimens with magnesium chloride/phospho-tungstate reagents (Merck 14993). LDL cholesterol concentrations were calculated as the total cholesterol concentration minus the cholesterol concentration in the supernatant, as measured by the precipitation method (Merck 14992) (15 ). The plasma uric acid concentration was assayed in an Eppendorf 5060 autoanalyzer (Eppen-dorf) by means of a commercial method (Merck) based on the uricase and peroxidase principle (16 ).
A standard 75-g oral glucose-tolerance test was performed, and fasting and 2-h plasma glucose and in-sulin concentrations were measured in 1994 and 1995 (13 ). Blood samples for glucose analysis were drawn into glass test tubes, each of which contained 80 mmol/L fluoride/oxalate. After centrifugation at 1500g at 4 °C for 10 min, the concentration of glucose in the supernatant was measured with a glucose dehydroge-nase enzymatic assay (Merck 3389 method) in an Ep-pendorf 5060 autoanalyzer, and the plasma concentra-tion of insulin was measured by an ELISA method with reagents supplied by Dako (17 ). The homeostasis model assessment (HOMA) insulin-resistance index was calcu-lated as: [(fasting plasma glucose in mmol/L)⫻ (fasting insulin in mU/L)]/22.5 (18 ). These data were available from the active participants in 1994 (n⫽ 1 798). We fol-lowed the criteria of the Adult Treatment Panel III guide-line to define metabolic syndrome (19 ) and used an Asian-specific waist-circumference cutoff point (20 ). STATISTICAL ANALYSIS
We classified participants on the basis of quintiles of serum uric acid concentrations, and continuous vari-ables were presented as the mean (SD) or as the me-dian. Relationships between the baseline uric acid con-centration and other biomarkers were examined by evaluating age- and sex-adjusted Spearman partial cor-relation coefficients.
The incidence rates of diabetes were calculated by dividing the number of cases by the number of person-years of follow-up for each uric acid quintile. The rela-tive risk (RR) of diabetes was calculated by dividing the incidence rate for each quintile by the rate in the first quintile. We used Cox proportional hazards models to adjust for potential confounding variables, including age group (35– 44 years, 45–54 years, 55– 64 years, 65–74 years, orⱖ75 years), sex, BMI (⬍18 kg/m2, 18 – 20.9 kg/m2, 21–22.9 kg/m2, 23–24.9 kg/m2, orⱖ25 kg/ m2), alcohol intake (nondrinker/current), smoking
(yes/no), regular exercise (yes/no), marital status (sin-gle, married, or divorced), educational level (⬍9 years/ⱖ9 years), occupation (no work, manual work, or professional), and family history of diabetes (yes/ no). We further adjusted for metabolic syndrome to examine whether the association between uric acid 5Nonstandard abbreviations: BMI, body mass index; RR, relative risk; HOMA,
homeostasis model assessment; CI, confidence interval.
concentration and diabetes was mediated through the metabolic syndrome. To test for a linear trend across uric acid quintiles, we used the median uric acid con-centration for each category as a continuous variable in the multivariate model. We also used the test of Hos-mer and Lemeshow to evaluate the goodness of fit for the model (21 ).
All statistical tests were 2-tailed with a type I error of 0.05, and P values ⬍0.05 were considered statisti-cally significant. Analyses were performed with SAS software (version 9.1; SAS Institute) and Stata (version 9.1; Stata Corporation).
Results
Participants in the highest uric acid quintile were older and more likely to be male and have a higher BMI value
than the participants in the other quintiles. They were also more likely to smoke and drink alcohol and had a higher prevalence of metabolic syndrome (Table 1).
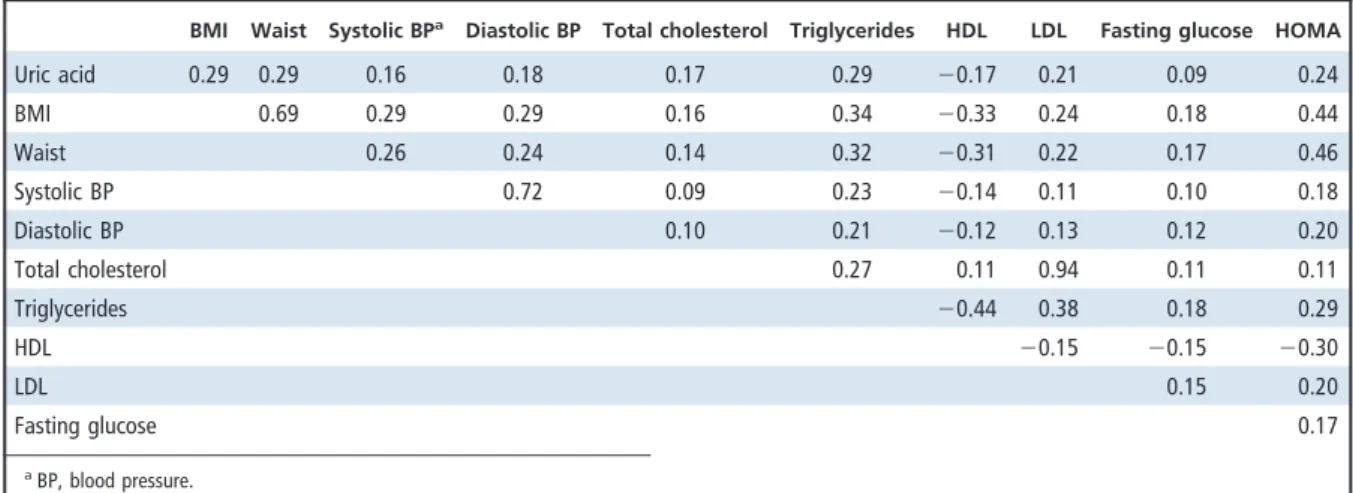
Uric acid concentration was inversely correlated with HDL and positively correlated with BMI, waist circumference, triglycerides, and insulin resistance (Table 2). Uric acid concentrations adjusted for age, sex, and BMI increased substantially with the number of metabolic syndrome components (P for trend ⬍0.0001) (Fig. 1).
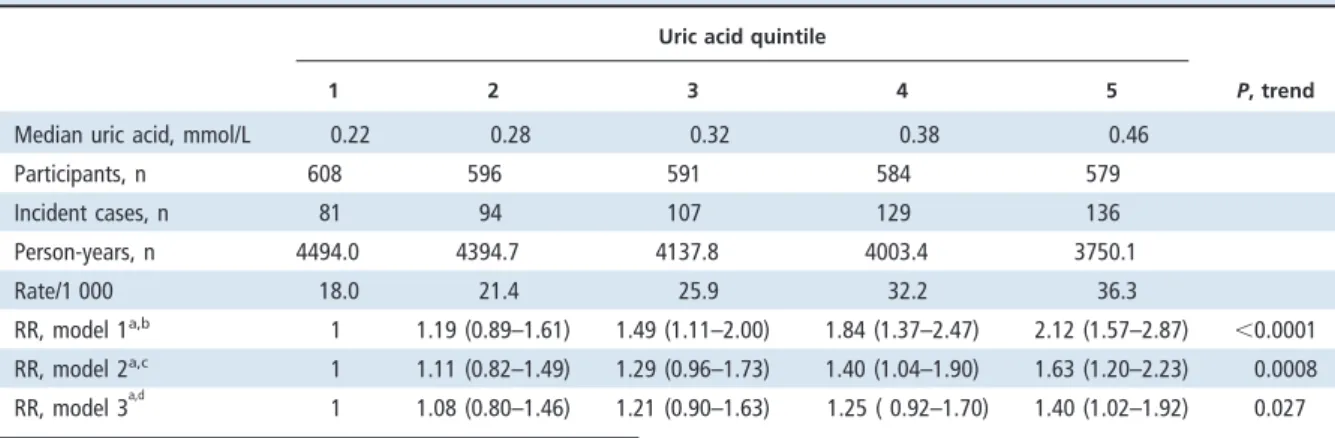
We documented 548 incident cases of diabetes during a median follow-up of 9.0 years. Table 3 shows the RRs and 95% confidence intervals (CIs) for diabe-tes according to uric acid quintile at baseline. After adjustment for age, sex, BMI, and other covariates, the RRs of diabetes according to uric acid quintile were 1.11, 1.29, 1.40, and 1.63 (95% CI, 1.20 –2.23;
1 2 3 4 5
(nⴝ 608) (nⴝ 596) (nⴝ 591) (nⴝ 584) (nⴝ 579) P
Sex, % ⬍0.0001
Men 15.3 30.0 47.7 65.9 78.2
Current smoker (yes), % 13.8 24.5 37.6 48.0 57.0 ⬍0.0001
Alcohol drinking (yes), % 13.3 18.1 28.4 40.6 48.9 ⬍0.0001
Marital status, % 0.22
Single 2.3 3.0 3.2 1.7 3.5
Lived with spouse 85.7 86.7 85.2 88.2 88.6
Divorced or separated 12.0 10.2 11.6 10.1 7.9 Education level, % 0.001 ⬍9 years 95.4 95.5 94.8 94.0 90.2 ⱖ9 years 4.6 4.5 5.3 6.0 9.8 Job status, % ⬍0.0001 No job 57.1 54.0 50.4 42.5 35.2 Farmer, laborer 29.1 32.1 33.7 40.8 44.2 Professional, business 13.8 13.9 15.9 16.8 20.6
Regular exercise (yes), % 13.2 13.4 12.9 15.1 18.0 0.08
Family history of diabetes, % 7.2 7.6 8.5 11.3 8.8 0.10
Metabolic syndrome, % 11.2 15.1 15.9 22.9 26.3 ⬍0.0001
Age, yearsa 51.9 53.0 54.6 55.7 54.8 ⬍0.0001
BMI, kg/m2a
22.6 22.9 23.1 23.7 24.2 ⬍0.0001
Uric acid, mmol/La 0.211 0.278 0.324 0.377 0.486 ⬍0.0001
HOMA-IRa,b
1.48 1.63 1.77 1.93 2.16 0.0002
CRP, mg/Lb 1.0 (0.6–2.1) 1.1 (0.6–2.9) 1.0 (0.6–2.3) 1.2 (0.7–2.1) 1.5 (0.9–3.2) 0.0002 aData are expressed as the mean.
bHOMA-IR, HOMA insulin resistance. Measurements were available for a subsample (n⫽ 1 798).
P for trend⬍0.001). After additional adjustment for the metabolic syndrome, the RR for the comparison of the participants in the fifth and first uric acid quintiles was 1.40 (95% CI, 1.02–1.92; P for trend⫽ 0.027).
In joint analyses of metabolic syndrome and uric acid concentration, participants with metabolic syn-drome had a consistently higher risk than those with-out metabolic syndrome, independently of uric acid concentration (Fig. 2). The association between uric acid concentration and diabetes appears to be stronger among those with metabolic syndrome than those without it, although the P value for interaction was not statistically significant (P for interaction⫽ 0.57). Par-ticipants who were in the highest uric acid quintile and
also had metabolic syndrome had a 3.3-fold greater risk of diabetes (95% CI, 2.27– 4.94) than those in the low-est uric acid quintile and without metabolic syndrome. In additional analyses, we included quintiles of the HOMA insulin-resistance index in the multivariate model for the available samples (n⫽ 1798). The asso-ciation between uric acid concentration and diabetes was further attenuated and became nonsignificant (RR for comparison of the extreme quintiles, 1.22; 95% CI, 0.85–1.74; P for trend⫽ 0.28).
Discussion
Our data suggest a positive association between the plasma concentration of uric acid and the incidence of type 2 diabetes in Chinese individuals. This association was somewhat attenuated after adjustment for meta-bolic syndrome, suggesting that the association be-tween hyperuricemia and diabetes was partly mediated through the metabolic syndrome. In our study, the uric acid concentration increased monotonically with the number of metabolic syndrome components.
Cross-sectional studies have suggested a positive association between uric acid and diabetes in several populations, including Italian adults (22 ), Asians (23– 25 ), and inhabitants of Seychelles (26 ). A cross-sec-tional study of 1877 Turkish men and women showed that those in the highest uric acid tertile had an odds ratio of 1.89 (95% CI, 1.45–2.46) for a diagnosis of diabetes, compared with the lowest tertile (27 ). Fur-thermore, in a cross-sectional study of 8144 Japanese men and women, the odds ratios for diabetes for com-parisons of the highest and lowest uric acid quartiles were 4.17 (95% CI, 2.56 – 6.79) for women and 1.97 (95% CI, 1.61–2.40) for men.
Table 2. Age- and sex-adjusted Spearman correlation coefficients between variables measured in the study participants.
BMI Waist Systolic BPa
Diastolic BP Total cholesterol Triglycerides HDL LDL Fasting glucose HOMA
Uric acid 0.29 0.29 0.16 0.18 0.17 0.29 ⫺0.17 0.21 0.09 0.24 BMI 0.69 0.29 0.29 0.16 0.34 ⫺0.33 0.24 0.18 0.44 Waist 0.26 0.24 0.14 0.32 ⫺0.31 0.22 0.17 0.46 Systolic BP 0.72 0.09 0.23 ⫺0.14 0.11 0.10 0.18 Diastolic BP 0.10 0.21 ⫺0.12 0.13 0.12 0.20 Total cholesterol 0.27 0.11 0.94 0.11 0.11 Triglycerides ⫺0.44 0.38 0.18 0.29 HDL ⫺0.15 ⫺0.15 ⫺0.30 LDL 0.15 0.20 Fasting glucose 0.17 aBP, blood pressure.
Fig. 1. Adjusted mean uric acid concentrations in the study participants according to the number of meta-bolic syndrome components.
Data are expressed as the mean (SD) and adjusted for age, sex, and BMI (P for trend⬍0.0001).
Prospective cohort studies of uric acid and inci-dent diabetes are limited and have yielded inconsistent findings. In a follow-up study of 6365 Japanese male employees ages 35– 61 years from 1981–1997, uric acid concentration was associated with a small but nonsig-nificant increased risk of diabetes: The multivariate RR was 1.21 (95% CI, 0.88 –1.65; P for trend⫽ 0.77) for a comparison of participants in the fifth and first quin-tiles (28 ). On the contrary, in a 6-year follow-up study
of 2310 Japanese male adults, Nakanishi et al. demon-strated that uric acid concentration was significantly associated with an increased risk of an impaired result in the fasting glucose test and diabetes: The multivari-ate risk was 1.78 (95% CI, 1.11–2.85; P for trend ⫽ 0.03) in a comparison of participants in the highest and lowest quintiles (29 ). The diagnosis of diabetes was dif-ferent in these 2 Japanese studies. The study of Tanigu-chi et al. (28 ) included a diabetes outcome only for a
1 2 3 4 5 P, trend
Median uric acid, mmol/L 0.22 0.28 0.32 0.38 0.46
Participants, n 608 596 591 584 579 Incident cases, n 81 94 107 129 136 Person-years, n 4494.0 4394.7 4137.8 4003.4 3750.1 Rate/1 000 18.0 21.4 25.9 32.2 36.3 RR, model 1a,b 1 1.19 (0.89–1.61) 1.49 (1.11–2.00) 1.84 (1.37–2.47) 2.12 (1.57–2.87) ⬍0.0001 RR, model 2a,c 1 1.11 (0.82–1.49) 1.29 (0.96–1.73) 1.40 (1.04–1.90) 1.63 (1.20–2.23) 0.0008 RR, model 3a,d 1 1.08 (0.80–1.46) 1.21 (0.90–1.63) 1.25 ( 0.92–1.70) 1.40 (1.02–1.92) 0.027
aData for RR (95% CI) are expressed relative to uric acid quintile 1.
bModel 1: Adjusted for age groups (35– 44, 45–54, 55– 64, 65–74, andⱖ75 years) and sex.
cModel 2: Model 1 plus BMI (⬍18, 18–20.9, 21–22.9, 23–24.9, or ⱖ25 kg/m2), alcohol intake (nondrinker/regular), exercise (yes/no), marital status (single, married,
or divorced/separated), education level (⬍9 years/ⱖ9 years), occupation (no work, manual work, or professional), and family history of diabetes (yes/no).
dModel 3: Model 2 plus metabolic syndrome (yes/no).
Q5 Q4 Q3 Q2 Q1 No Yes 3.3 2.7 3.0 2.8 1.7 1.3 1.2 1.1 1.0 1.0 0 1 2 3 4 5 Relative risk
Uric acid quintiles
Metabolic syndrome
Fig. 2. RRs of diabetes during 9 years of follow-up according to uric acid quintile and the presence or absence of metabolic syndrome.
Adjusted for age, sex, BMI, alcohol intake, smoking, exercise habit, marital status, education, job status, and family history of diabetes.
fasting-glucose valueⱖ7.0 mmol/L or a glucose con-centration after 2 h of ⱖ11.1 mmol/L. They did not include participants with a history of oral hypoglyce-mic medications or insulin use, and the incidence rates of diabetes were relatively low, only 6 – 8 cases per 1000 person-years. In contrast, the study of Nakanishi et al. (29 ) combined an impaired fasting-glucose status and diabetes as the outcome, an action that may have weak-ened the association with diabetes.
The positive association between uric acid concen-tration and diabetes may be explained by at least 3 po-tential mechanisms. First, metabolic syndrome, as a precursor of diabetes, induces high oxidative stress, which is worsened by the accompanying hyperurice-mia (30 ). Uric acid usually has an antioxidative effect; however, uric acid becomes a strong oxidant in the en-vironment of metabolic syndrome (31 ). This phenom-enon of the urate redox shuttle may explain the para-doxical effects of uric acid on oxidative stress (32 ). Inflammation and oxidative stress induced by meta-bolic syndrome and hyperuricemia may predispose in-dividuals to a higher risk for diabetes.
Second, uric acid stimulates vascular smooth mus-cle proliferation and induces endothelial dysfunction (33 ). Uric acid has been shown to decrease endothelial nitric oxide production and to lead to endothelial dys-function and insulin resistance (34, 35 ). Consequently, uric acid induces vascular inflammation and artery damage (8, 33 ), which in turn leads to an increased risk of diabetes and atherosclerosis (36, 37 ). A recent study showed that hyperuricemia was associated with the se-verity of carotid plaque among Japanese men (38 ). The authors showed that metabolic syndrome explained most of the association between uric acid and carotid plaque, because adjusting for metabolic syndrome sub-stantially attenuated the association (38 ). In addition, our data show a positive association between uric acid concentration and the HOMA insulresistance in-dex, and adjustment for the HOMA index further at-tenuated the association between uric acid concentra-tion and diabetes. These data suggest that insulin resistance, which is closely related to metabolic syn-drome and inflammation, may also mediate the asso-ciation between uric acid and diabetes risk.
Third, uric acid is associated with increased renal glomerular pressure and increased renal sodium reab-sorption, and these renal reactions are greatly en-hanced by high insulin concentrations (39 ). Among diabetic patients, hyperuricemia has been associated
with microalbuminuria (22 ). The combined effects of insulin resistance and hyperuricemia on renal func-tions may lead to increased glucose intolerance, hyper-tension, and diabetes risk.
To our knowledge, this study is the first prospec-tive investigation of serum uric acid and the risk of diabetes among Chinese individuals. Because of the prospective cohort design, the baseline measurements of all cohort members were unlikely to have been af-fected by storage and laboratory issues that might be raised in some cross-sectional studies. The use of a community-based population may also have reduced the possibility of selection bias. We also included im-portant socioeconomic and lifestyle factors in the mod-els to control for potential confounding factors.
Our study had several potential limitations. First, this observational study did not clarify the time se-quence of hyperuricemia and metabolic syndrome. A prospective study in Korea, however, suggested that a higher uric acid concentration predicted the incidence of hypertension and the development of metabolic syn-drome (25 ), and hyperuricemia has been considered to be a component of metabolic syndrome (27, 31 ). Sec-ond, because baseline serum uric acid concentrations were measured only once, our results may be prone to intraindividual variations that might have attenuated our results. Finally, we were unable to obtain detailed information on antihypertensive medications and the intake of foods that might have affected plasma uric acid concentrations.
In conclusion, this prospective study suggests a pos-itive association between the plasma concentration of uric acid and the incidence of type 2 diabetes in Chinese indi-viduals. This association was somewhat attenuated after adjustment for metabolic syndrome, suggesting that the association between hyperuricemia and diabetes is partly mediated through the metabolic syndrome.
Grant/funding Support: This study was supported partly by grants from the National Science Council and Department of Health in Taiwan (NSC 96-2314-B-002-155, DOH 96D047). The research of F.B.H. is partly supported by an American Heart Association Es-tablished Investigator Award.
Financial Disclosures: None declared.
Acknowledgments: We thank the participants in the Chin-Shan community and the cardiologists at Na-tional Taiwan University Hospital for their assistance in this study.
References 1. Schulze MB, Hu FB. Primary prevention of
diabetes: what can be done and how much can be prevented? Annu Rev Public Health 2005;26: 445– 67.
2. Baker JF, Krishnan E, Chen L, Schumacher HR.
Serum uric acid and cardiovascular disease: re-cent developments, and where do they leave us? Am J Med 2005;118:816 –26.
3. Bos MJ, Koudstaal PJ, Hofman A, Witteman JC,
Breteler MM. Uric acid is a risk factor for myo-cardial infarction and stroke: the Rotterdam Study. Stroke 2006;37:1503–7.
response. Nephrol Dial Transplant 2006;21: 3046 –7.
6. Sanchez-Lozada LG, Nakagawa T, Kang DH, Feig
DI, Franco M, Johnson RJ, Herrera-Acosta J. Hor-monal and cytokine effects of uric acid. Curr Opin Nephrol Hypertens 2006;15:30 –3.
7. Kanellis J, Kang DH. Uric acid as a mediator of
endothelial dysfunction, inflammation, and vas-cular disease. Semin Nephrol 2005;25:39 – 42.
8. Heinig M, Johnson RJ. Role of uric acid in
hyper-tension, renal disease, and metabolic syndrome. Cleve Clin J Med 2006;73:1059 – 64.
9. Chien KL, Hsu HC, Sung FC, Su TC, Chen MF, Lee
YT. Metabolic syndrome as a risk factor for cor-onary heart disease and stroke: an 11-year pro-spective cohort in Taiwan community. Atheroscle-rosis 2007;194:214 –21.
10. Chien KL, Sung FC, Hsu HC, Su TC, Lin RS, Lee YT.
Apolipoprotein A-I and B, and stroke events in a community-based cohort in Taiwan: report of the Chin-Shan Community Cardiovascular Study. Stroke 2002;33:39 – 44.
11. Lee YT, Lin RS, Sung FC, Yang CY, Chien KL, Chen
WJ, et al. Chin-Shan Community Cardiovascular Cohort in Taiwan: baseline data and five-year follow-up morbidity and mortality. J Clin Epide-miol 2000;53:838 – 46.
12. Lee YT, Sung FC, Lin RS, Hsu HC, Chien KL, Yang
CY, Chen WJ. Peripheral blood cells among com-munity residents living near nuclear power plants. Sci Total Environ 2001;280:165–72.
13. Chien KL, Lee YT, Sung FC, Hsu HC, Su TC, Lin RS.
Hyperinsulinemia and related atherosclerotic risk factors in the population at cardiovascular risk: a community-based study. Clin Chem 1999;45: 838 – 46.
14. Chien KL, Sung FC, Hsu HC, Su TC, Chang WD,
Lee YT. Relative importance of atherosclerotic risk factors for coronary heart disease in Taiwan. Eur J Cardiovasc Prev Rehabil 2005;12:95–101.
15. Wieland H, Seidel D. A simple specific method for
precipitation of low density lipoproteins. J Lipid Res 1983;24:904 –9.
16. Fossati P, Prencipe L, Berti G. Use of
3,5-dichloro-2-hydroxybenzenesulfonic acid/4-aminophenazone chromogenic system in direct enzymic assay of uric acid in serum and urine. Clin Chem 1980;26: 227–31.
17. Andersen L, Dinesen B, Jorgensen PN, Poulsen F,
Roder ME. Enzyme immunoassay for intact
hu-tion from fasting plasma glucose and insulin con-centrations in man. Diabetologia 1985;28:412–9.
19. Expert Panel on Detection, Evaluation, and
Treat-ment of High Blood Cholesterol in Adults. Exec-utive Summary of the Third Report of the Na-tional Cholesterol Education Program (NCEP) Expert Panel on Detection, Evaluation, and Treat-ment of High Blood Cholesterol in Adults (Adult Treatment Panel III). JAMA 2001;285:2486 –97.
20. Tan CE, Ma S, Wai D, Chew SK, Tai ES. Can we
apply the National Cholesterol Education Pro-gram Adult Treatment Panel definition of the metabolic syndrome to Asians? Diabetes Care 2004;27:1182– 6.
21. Hosmer DW Jr, Lemeshow S. Applied logistic
regression. New York: John Wiley & Sons, 1989: 25–37.
22. Bo S, Cavallo-Perin P, Gentile L, Repetti E,
Pa-gano G. Hypouricemia and hyperuricemia in type 2 diabetes: two different phenotypes. Eur J Clin Invest 2001;31:318 –21.
23. Lin SD, Tsai DH, Hsu SR. Association between
serum uric acid level and components of the metabolic syndrome. J Chin Med Assoc 2006;69: 512– 6.
24. Li Y, Stamler J, Xiao Z, Folsom A, Tao S, Zhang H.
Serum uric acid and its correlates in Chinese adult populations, urban and rural, of Beijing. The PRC-USA Collaborative Study in Cardiovascular and Cardiopulmonary Epidemiology. Int J Epidemiol 1997;26:288 –96.
25. Yoo TW, Sung KC, Shin HS, Kim BJ, Kim BS, Kang
JH, et al. Relationship between serum uric acid concentration and insulin resistance and meta-bolic syndrome. Circ J 2005;69:928 –33.
26. Conen D, Wietlisbach V, Bovet P, Shamlaye C,
Riesen W, Paccaud F, Burnier M. Prevalence of hyperuricemia and relation of serum uric acid with cardiovascular risk factors in a developing country. BMC Public Health 2004;4:9.
27. Onat A, Uyarel H, Hergenc¸ G, Karabulut A,
Al-bayrak S, Sari I, et al. Serum uric acid is a determinant of metabolic syndrome in a popula-tion-based study. Am J Hypertens 2006;19:1055– 62.
28. Taniguchi Y, Hayashi T, Tsumura K, Endo G, Fujii
S, Okada K. Serum uric acid and the risk for hypertension and type 2 diabetes in Japanese men: the Osaka Health Survey. J Hypertens 2001; 19:1209 –15.
30. Hansel B, Giral P, Nobecourt E, Chantepie S,
Bruckert E, Chapman MJ, Kontush A. Metabolic syndrome is associated with elevated oxidative stress and dysfunctional dense high-density li-poprotein particles displaying impaired antioxida-tive activity. J Clin Endocrinol Metab 2004;89: 4963–71.
31. Hayden MR, Tyagi SC. Uric acid: a new look at an
old risk marker for cardiovascular disease, meta-bolic syndrome, and type 2 diabetes mellitus: the urate redox shuttle. Nutr Metab (Lond) 2004;1: 10.
32. Patterson RA, Horsley ET, Leake DS. Prooxidant
and antioxidant properties of human serum ul-trafiltrates toward LDL: important role of uric acid. J Lipid Res 2003;44:512–21.
33. Johnson RJ, Kang DH, Feig D, Kivlighn S, Kanellis
J, Watanabe S, et al. Is there a pathogenetic role for uric acid in hypertension and cardiovascular and renal disease? Hypertension 2003;41:1183– 90.
34. Nakagawa T, Kang DH, Feig D, Sanchez-Lozada
LG, Srinivas TR, Sautin Y, et al. Unearthing uric acid: an ancient factor with recently found sig-nificance in renal and cardiovascular disease. Kid-ney Int 2006;69:1722–5.
35. Feig DI, Mazzali M, Kang DH, Nakagawa T, Price
K, Kannelis J, Johnson RJ. Serum uric acid: a risk factor and a target for treatment? J Am Soc Nephrol 2006;17:S69 –73.
36. Sundstrom J, Sullivan L, D’Agostino RB, Levy D,
Kannel WB, Vasan RS. Relations of serum uric acid to longitudinal blood pressure tracking and hypertension incidence. Hypertension 2005;45: 28 –33.
37. Mellen PB, Bleyer AJ, Erlinger TP, Evans GW,
Nieto FJ, Wagenknecht LE, et al. Serum uric acid predicts incident hypertension in a biethnic cohort: the Atherosclerosis Risk in Communities study. Hypertension 2006;48:1037– 42.
38. Ishizaka N, Ishizaka Y, Toda E, Nagai R,
Ya-makado M. Association between serum uric acid, metabolic syndrome, and carotid atherosclerosis in Japanese individuals. Arterioscler Thromb Vasc Biol 2005;25:1038 – 44.
39. Quinones Galvan A, Natali A, Baldi S, Frascerra S,
Sanna G, Ciociaro D, Ferrannini E. Effect of insulin on uric acid excretion in humans. Am J Physiol 1995;268:E1–5.