國
立
交
通
大
學
顯示科技研究所
碩 士 論 文
雙色場色序法應用於無彩色濾光片之液晶顯示器
Two-Color-Field Sequential Method for
Color Filterless LCDs
研 究 生:鄭宜如
指導教授:謝漢萍 教授
黃乙白 助理教授
雙色場色序法應用於無彩色濾光片之液晶顯示器
Two-Color-Field Sequential Method for
Color Filterless LCDs
研 究 生: 鄭宜如 Student:Yi-Ru Cheng
指導教授: 謝漢萍 Advisors:Han-Ping D. Shieh
黃乙白
Yi-Pai Huang
國 立 交 通 大 學
顯示科技研究所
碩 士 論 文
A ThesisSubmitted to Display Institute
College of Electrical and Computer Engineering National Chiao Tung University
in partial Fulfillment of the Requirements for the Degree of Master
in
Display Institute June 2009
Hsinchu, Taiwan, Republic of China
i
雙色場色序法
應用於無彩色濾光片之液晶顯示器
碩士研究生:鄭宜如 指導教授:謝漢萍教授
黃乙白助理教授
國立交通大學 顯示科技研究所
摘 要
色序型液晶顯示器提升了光效率並且反映了綠色顯示器的需求,因此具有極 大的潛能成為次世代之節能環保顯示器。傳統色序型液晶顯示器利用 180Hz 場 頻率時序顯示,紅色、綠色、和藍色色場,經由人眼的積分而在視網膜上呈現一 全彩影像。所以,此傳統時序顯示法需要搭配快速反應之液晶,例如: 光學補償 彎曲排列型液晶(OCB mode)。然而,此類型之液晶仍未成為現行主要之商業液 晶模態。 基於以上論述,此研究提出一雙色場色序演算法應用於無彩色濾光片之液晶 顯示器進而提供液晶足夠的反應時間。此演算法利用最少的色場數目,進而減緩 了色序型顯示器對快速液晶反映時間的要求。經由此演算法,可達成產生一可接 受之平均色差小於 3(ΔE00ave<3)之色彩影像資訊。除此之外,此研究利用混色的 概念呈現兩個色場,因而在色帶拖出時能降低人眼對色彩差異之感知程度,藉而 抑制色分離現象。ii
Two-Color-Field Sequential Method for
Color Filterless LCDs
Student: Yi-Ru Cheng Advisors: Dr. Han-Ping D. Shieh
Dr. Yi-Pai Huang
Display Institute
National Chiao Tung University
Abstract
A field sequential color liquid crystal display (FSC LCD) might become a next-generation display because of enhanced energy efficiency and respond to demand for Green techniques. The conventional FSC LCD flashes red, green and blue field images at 180 Hz field rate to generate a full color image so the color sequence must be achieved by using fast LC modes, such as the optically compensated bend (OCB) mode. However, the OCB mode have not commercialized for TV application yet.
In the thesis, a novel color-filter free displaying method, two-color-field sequential method, was proposed for color filterless LCDs. The least field number alleviated the demand for fast-response LC modes for sequential-type LCDs, and produced full color images with acceptable color reproduction accuracy, average ΔE00ave<3. Furthermore, less chrominance difference between the two fields was
iii
誌 謝
首先誠摯的感謝指導老師謝漢萍老師及黃乙白老師對於研究態度及英文能 力的教導,以及提供豐富的資源與完善研究環境,使我得以在碩士生涯提升了專 業及英文的能力,順利完成此論文。此外,也感謝口試委員郭浩中教授、戴亞翔 副教授及莫啟能博士所提供的寶貴意見,使本論文更加的完善。 在此特別感謝鄭裕國學長對於論文的細心指導,嚴謹的研究態度,讓我更能 學習成長,受益良多。 在實驗室的日子裡,感謝有鄭榮安、林芳正、楊柏儒、陳均合、莊喬舜、王 奕智、許精益等學長們提供各方面的指導與協助,也感勝昌、凌嶢、建良、國振、 仁杰、其霖、景明、明農、宛徵等學長姊們讓我的生活更加精彩。同時感謝育誠, 致維,宗緯,佑禎,拓江,靖堯,博文,俊賢,浩彣,宜伶,高銘,益興等同學 們在課業、研究、生活上的幫助與分享,並伴我一起度過兩年碩士班的日子。我 也感謝實驗室的學弟妹們怡菁,期竹,景文,甫奕,璧丞,毅翰,裕閔,姚順, 世勛,耆賢與助理小姐,感謝你/妳們的幫忙及讓實驗室充滿歡愉的氣氛。 最後,我要感謝我的男友以及最愛的家人阿公、爸爸、哥哥、大嫂及關心我 的家人和朋友們,由於他們的支持與體諒,使我能無後顧之憂的研究與學習,並 順利完成碩士學業。除此之外,我要和這一生中我最愛的兩個女人分享這份遲來 的喜悅,謝謝妳們在天上看著我陪伴著我。在此,我將這份喜悅與每位關心我的 人分享。iv
Table of Contents
Abstract (Chinese) ……….…i Abstract (English) ………...……….…….ii Acknowledgement ……….………...iii Table of Contents ……….………....iv Figure Caption ……….………vi List of Tables ………..………...……xChapter 1 Introduction ... 1
1.1 Field Sequential Color Liquid Crystal Displays (FSC-LCDs) ... 1
1.2 Color Break-up Phenomenon ... 4
1.3 Motivation & Objective ... 7
1.4 Organization ... 8
Chapter 2 Prior Methods ... 9
2.1 Multi-field Driving Scheme ... 9
2.1.1 Multi-division Backlight ... 10
2.1.2 Overdrive Scheme ... 12
2.2 Two-field Method with Color Filters ... 13
2.3 Summary ... 15
Chapter 3 Two-color-field Sequential Method ... 16
3.1 Two-color-field Sequential Method ... 16
3.1.1 Concept ... 16
3.1.2 LCD Structure ... 17
3.1.3 Algorithm ... 19
3.2 Colorimetric Reproduction ... 20
3.2.1 Color Difference Formula ... 22
v
3.3 Color Break-up Examination ... 28
3.4 Summary ... 29
Chapter 4 Experimental Results ... 30
4.1 Experiments ... 30
4.1.1 Light Spread Function Measurement ... 32
4.1.2 Panel Characteristic Measurement ... 34
4.2 Results ... 36
4.2.1 Color Differences ... 36
4.2.2 Color Break-up Examination ... 38
4.3 Discussions ... 42
Chapter 5 Optimizations of Two-color-field Sequential Method ... 43
5.1 Backlight parameters ... 43
5.1.1 Backlight Divisions ... 44
5.1.2 Light Spread Function Size ... 44
5.2 Results ... 46
5.2.1 Color Difference Maps ... 46
5.2.2 Demonstration Results ... 49
5.3 Discussions ... 52
5.4 Comparisons ... 55
5.5 Summary ... 55
Chapter 6 Conclusions and Future Works ... 56
6.1 Conclusions ... 56
6.2 Future works ... 57
Reference ... 59
vi
Figure Caption
Fig. 1-1 TFT-LCD ... 2
Fig. 1-2 FSC-LCD ... 2
Fig. 1-3 Timing chart in the FSC-LCD [2]. ... 3
Fig. 1-4 Temporal color mixing ... 3
Fig. 1-5(a) The original Lily image, (b) the CBU image. ... 4
Fig. 1-6 The stationary CBU mechanism. (a) The image displayed on the FSC panel and the path of a saccade movement (gray line) and (b) static CBU phenomenon. ... 5
Fig. 1-7 The dynamic CBU mechanism. (a) The relation between time and image location on display, and (b) dynamic CBU phenomenon. ... 6
Fig. 1-8 Reported color sequential methods: (a)RGB, (b)RGBRGB, (c)RGBCY, and (d)RGBKKK methods. ... 6
Fig. 2-1 (a) The conventional RGB method and (b) the double frame rate method. (c) The RGBCY sequence and (d) the RGBWmax sequence of insertion multi-primary color field method. ... 10
Fig. 2-2 The timing charts of (a) the RGB method and (b) the RGBW method. ... 10
Fig. 2-3 The timing chart of the divided display area method. ... 11
Fig. 2-4 The OCB-LCD configuration [11] ... 12
vii
Fig. 3-1 Two driving-scheme types, a typical three-field method and the proposed two-color-field sequential method, are illustrated, by field decomposition of color
fields to generate a full-color image. ... 17
Fig. 3-2 The local dimming system flowchart. ... 18
Fig. 3-3 The algorithm flowchart of the two-color-field sequential method. ... 20
Fig. 3-4 The S-CIELAB floechart... 26
Fig. 3-5 The normalized luminance contrast sensitivity and frequency filter for luminance channel. ... 26
Fig. 3-6 The normalized opponent color contrast sensitivity ... 27
Fig. 3-7 The frequency filters for chrominance channels. ... 27
Fig. 3-8 The RCS flowchart ... 29
Fig. 4-1 The experimental apparatus... 31
Fig. 4-2 The experimental flowchart... 31
Fig. 4-3 The spatial shift-variant system. ... 32
Fig. 4-4 The experimental results of light spread function measurement. ... 33
Fig. 4-5 The comparison of (a) measurement full on white backlight and (b) the convolution method and (c) the superposition method. ... 33
Fig. 4-6 Three 3-dimentional LUTs of (a) red, (b) green, and (c) blue. ... 35
Fig. 4-7 The results of colorimetric reproductions in pure color images. ... 36
viii
Fig. 4-9 Six test images were used to analyze the CBU suppression. ... 39
Fig. 4-10 The CBU examination results of (a) light-skin, (b) Asia-skin, (c) strong-red, (d) sky-blue, (e) grass-green, and (f) white images. ... 40
Fig. 4-11 The comparisons of RSC values between two-color-field method and other sequential methods in (a) light-skin, (b) Asia-skin, (c) strong-red, (d) sky-blue, (e) grass-green, and (f) white images. ... 41
Fig. 5-1 Gaussian profile ... 43
Fig. 5-2 Five test images with different image contents ... 44
Fig. 5-3 The correlation between number of backlight divisions and color differences. ... 45
Fig. 5-4 The optimal results with the σ size of Gaussian profile against color difference. ... 45
Fig. 5-5 Four test images: (a) Lily, (b) Butterfly, (c) Parrot, and (d) Color-ball images. ... 46
Fig. 5-6 The reproduction results of (a) Lily, (b) Butterfly, (c) Parrot, and (d)
Color-ball images. ... 48
Fig. 5-7 The demonstrated results of (a) 1st B/L image, (b) 2nd B/L image, (c) 1st LC image, (d) 2nd LC image, (e) 1st field image, and (f) 2nd field image. ... 50
Fig. 5-8 Comparison of (a) target and (b) reproduced image ... 51
Fig. 5-9 Target image was input to a 46” 120Hz MVA LCD (a), the corresponding CBU images, synthesized by three-field (b) and two-field (c), were captured by a high-speed
ix
camera moving horizontally. ... 51
Fig. 5-10 Comparisons of optimal results and experimental results. ... 52
Fig. 5-11 The slight CBU sensitivity yielded by reducing opponent colors in each field. The color-mixing band edge of two-color-field image incurred less color different sensitivity. ... 53
Fig. 5-12 (a)Target image (b)reproduced image (c) reproduced image S-CIEDE2000 values ... 54
Fig. 6-1 (a) Reproduced image of the third primary is blue, and (b) reproduced image of the third primary with the least color component. ... 58
x
List of Tables
Table. 1 The commercial LCD panel specifications [2]. ... 7
Table. 2 The comparisons of four types display [19]. ... 15
Table. 3 Parameters for chrominance CSFs ... 27
Table. 4 Comparison between NCTU two-color-field method and other FSC methods ... 55
1
Chapter 1
Introduction
A field-sequential-color liquid crystal display (FSC-LCD) might become a next-generation display because of enhanced optical throughput [1]. The FSC-LCD driving scheme and its serious issue, Color Break-up (CBU), will be introduced. Following, the motivation and objective of the thesis will be given. Final section is organization of the thesis.
1.1 Field Sequential Color Liquid Crystal Displays (FSC-LCDs)
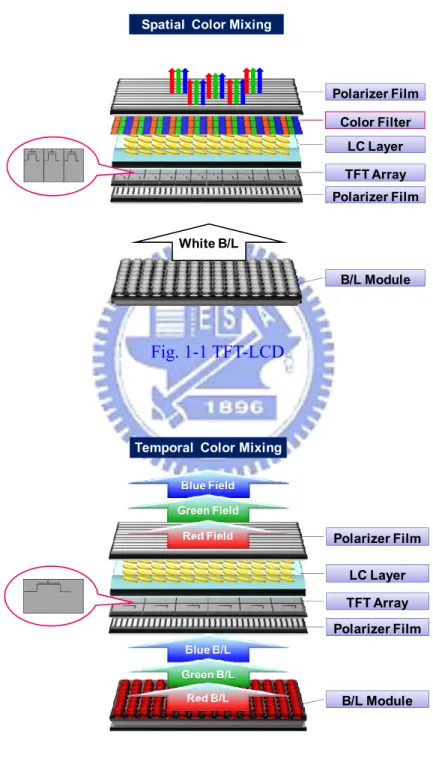
The LCDs became more and more popular for commercial display products because of its light weight, small volume, and no radiation emitting. The structure of the TFT-LCD is illustrated in Fig. 1-1. The optical path starts at the backlight module which provides a full-on white light source. Then, the light passes through some optical films, and the uniform and direct light can be transmitted into LC layer. Third, the TFT controls the LC twist angle to modulate light transmittance. Finally, the light will pass through red, green, and blue micro color filters to generate a full-color image. However, the color filters transmit only about one third of the light source, and total optical throughput of the TFT-LCD module is just about 7%.
Therefore, a low power consumption display becomes an urgent topic in display technologies in recent years. The FSC-LCD, as shown in Fig. 1-2, is a kind of low power consumption display without color filters. The FSC method flashes red, green, and blue field images time sequentially and uses a temporal color mixture to display colorful images [1]. FSC-LCDs have advantages than conventional LCD, such as,
2
lower power consumption, higher transmittance, higher possible resolution, and lower material cost. B/L Module Polarizer Film TFT Array LC Layer Color Filter Polarizer Film White B/L Spatial Color Mixing
Fig. 1-1 TFT-LCD B/L Module Polarizer Film TFT Array LC Layer Polarizer Film Temporal Color Mixing
Blue Field Green Field Blue B/L Green B/L Red B/L Red Field Fig. 1-2 FSC-LCD
3
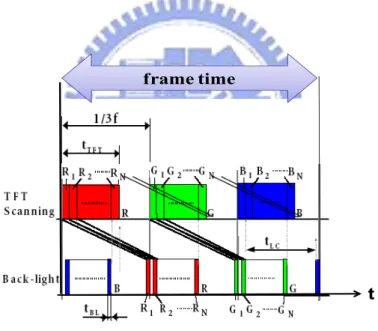
The FSC-LCD driving scheme includes three main parts: the TFT scanning, the LC response, and the backlight flashing. The timing chart is illustrated in Fig. 1-3. Using the red field as an example; each field time includes a data loading time (tTFT),
LC response time (tLC), and red LED lighting time (tBL). As shown in Eq.1-1, within
one field time (1/3f), the scanning of the whole panel, the response of LC and the flash of the back-light must be completed, where, f is the frame frequency, tTFT is the
scanning time for the whole panel, and tBL is the back-light flash time. By using
temporal color mixing, the red, green, and blue three color fields display time sequentially to generate a colorful image as shown in Fig. 1-4.
≈ TFT Scanning B/L Flashing t tLC tTFT tBL 1/3f R G B R G B frame time
Fig. 1-3 Timing chart in the FSC-LCD [2].
BL t LC t TFT t f 3 1 = + + (Eq. 1-1) B-field G-field R-field time Field 2 Field 1 Field 3 Full-color image
4
1.2 Color Break-up Phenomenon
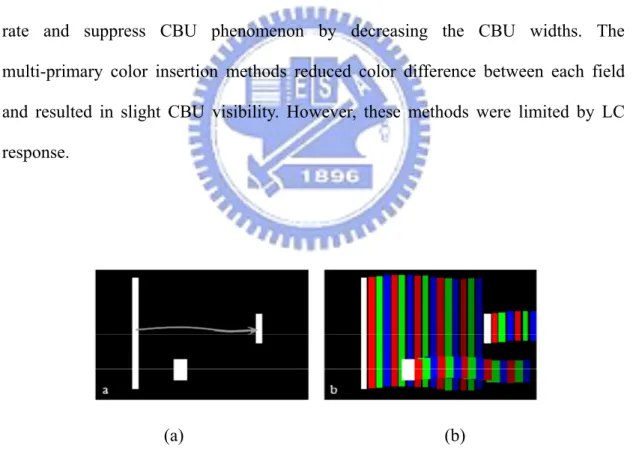
Field sequential-color LCDs achieve three times higher optical throughput than conventional LCDs due to utilization of color filters. However, FSC-LCDs have a key issue, color breakup (CBU). The CBU phenomenon is shown inFig. 1-5. CBU occurs when there is a relative motion between the displayed image and the viewer eyes. After visual integration, the separated colors on image fringes can be perceived by human eye, and this phenomenon is called CBU. The CBU image, as shown in Fig. 1-5(b), causes human eye to feel uncomfortable and results in low image quality. Two reasons causing CBU are detailed below.
Lily image CBU image
(a) (b)
Fig. 1-5(a) The original Lily image, (b) the CBU image.
For stationary images, CBU is observed during or just after a saccadic eye movement, as illustrated in Fig. 1-6. Fig. 1-6(a) shows three static white bars, when the human eye perceived the images, the attention will focus on what attracts interest. The gray line in Fig. 1-6 (a) describes the eye saccade movement. When the eye perceive from the left white bar to right white bar at fast velocity, the three primary color fields must separate, and CBU phenomenon can be observed, as shown in Fig. 1-6(b).
The second kind of CBU, dynamic CBU, occurs in “Smooth Pursuit Eye Movement (SPEM)” in the visual system, as illustrated in Fig. 1-7. When target image,
5
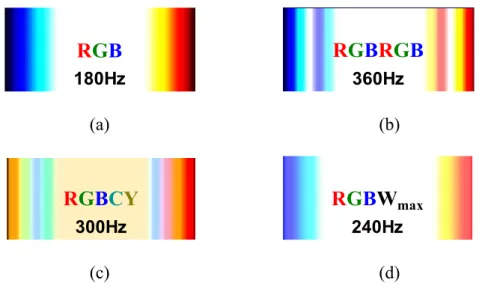
white bar, moved from the left to the right on the FSC display. Human eye will pursuit this image at the same time. The spatial-temporal relation is illustrated in Fig. 1-7(a), the horizontal axis is display position, the vertical axis is time, and the orange line indicates eye trace line. Due to temporal integration in the visual system, the field images of moving white bar are not plotted in the same spot in the smoothly moving retina. The separated colors are perceived at the pattern edge as shown in Fig. 1-7 (b). Several methods for suppressing CBU were proposed in recent years, such as the double frame rate (RGBRGB), the black field insertion (RGBKKK), and the multi-primary color insertion (RGBCY) methods[3] [4] as illustrated in Fig. 1-8 (b)(c)(d). The double frame rate and black field insertion methods increase the field rate and suppress CBU phenomenon by decreasing the CBU widths. The multi-primary color insertion methods reduced color difference between each field and resulted in slight CBU visibility. However, these methods were limited by LC response.
(a) (b)
Fig. 1-6 The stationary CBU mechanism. (a) The image displayed on the FSC panel and the path of a saccade movement (gray line) and (b) static CBU phenomenon.
6
Eye trace line
R f ield G f ield B f ield m-3m-2 m-1 m m+1m+2m+3m+4m+5m+6m+7m+8m+9m+10 m+11 m+12 n-1 frame n frame n+1 frame pixel No. R f ield R f ield G f ield G f ield B f ield B f ield t Display position (a) (b)
Fig. 1-7 The dynamic CBU mechanism. (a) The relation between time and image location on display, and (b) dynamic CBU phenomenon.
R
G
B
180Hz
R
G
B
R
G
B
360Hz
(a) (b)RGB
KKK
360Hz
RGB
C
Y
300Hz
(c) (d)Fig. 1-8 Reported color sequential methods: (a)RGB, (b)RGBRGB, (c)RGBCY, and (d)RGBKKK methods.
7
1.3 Motivation & Objective
FSC-LCDs have three times higher optical throughput than conventional LCDs. However, each pixel of the sequential type LCDs should drive at least three times faster than conventional LCDs. Taking a 60Hz frame rate of RGB FSC method XGA panel as an example, the field rate need to be increased to 180Hz (5.56ms). The TFT addressing time is longer than 3.3 ms, and the backlight flashing time in each field is about 1.22ms. According to the equation 1-1, the LC response time is calculated shorter than 1ms. Some auxiliary solutions, e.g. over-drive [5] and multi-division backlight[6], are necessary to save as much time as possible for LC response, and the detail of these method will explain in section 2.1. According to some commercial LCD panel specifications presented in recent years, as shown in Table. 1, the commercial LC modes response time are all longer than 5ms. Even the specific LC mode, optically compensate bend (OCB) mode, cannot reach the fast response time for large size display easily. Therefore, the objective of this thesis is to develop a double-frame-rate, or two-color-field, driving scheme, which allows the longer field time for LC response in color-filterless FSC LCD.
Table. 1 The commercial LCD panel specifications [2].
LC MODE MODEL RESPONSE
TIME COMPANY TN VA1916W 5ms VIEWSONIC AL1916W 5ms ACER 940NW+ 5ms SAMSUMG PVA 971p+ 6ms SAMSUMG LCD1970NXp 8ms NEC FlexScanS1931 8ms EPSON MVA 190P7 8ms PHILIPS SDM-X95K 8ms SONY M201EW01 V3 8ms AUO
IPS FlexScan S2100 8ms EPSON
8
1.4 Organization
This thesis is organized as follows. In Chapter 2, multi-field driving scheme, some auxiliary solutions provided longer time for LC response, and a prior art, two-field method with color filter, will be discussed. In Chapter 3, proposed method, two-color field sequential method without color filter, will be detailed. The concept and the algorithm of proposed method are described. Also, the evaluation index for color difference, and CBU suppression method will be introduced. In Chapter 4, the experimental procedure for establishing color model to predict correct driving signals, and some results of colorimetric accuracy are shown. According to experimental results, some discussions will be presented. In Chapter 5, some optimization results will be shown. Finally, the conclusions and future works will be given in Chapter 6.
9
Chapter 2
Prior Methods
The FSC-LCD was proposed to increase optical throughput of color LCDs. However, a serious issue, CBU, cause poor viewing quality. Many field sequential methods for suppressing CBU were proposed during recent years [8] [9]. In order to implement in hardware, some auxiliary solutions to extend time for LC response are introduced. Finally, the two-field method with color filters will be given.
2.1 Multi-field Driving Scheme
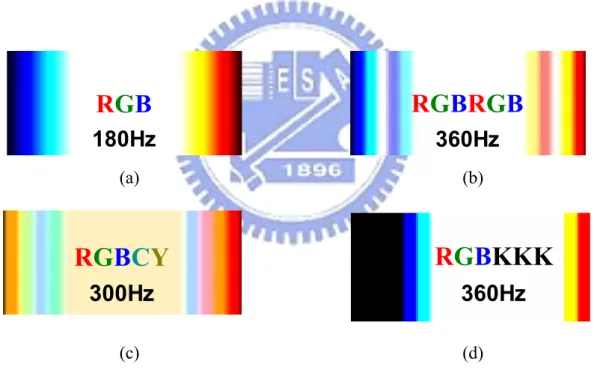
A multi-field driving scheme was proposed for suppressing the CBU phenomenon, such as increasing field rate method and insertion multi-primary color field method. Take double frame rate, RGBRGB sequence for example. When the field rate increased, the CBU width becomes thinner than RGB method, as shown in Fig. 2-1(b), and human eye can get less sensitive to the CBU phenomenon. The second method, insertion multi-primary color filed method, was proposed by the Tatsuo Uchida group. As the simulation results shown in Figs. 2-1 (c) and (d), the RGBCY, and RGBW methods reduce the chrominance difference between each field, so these methods suppress CBU efficiently. However, the mentioned methods all face a huge challenge, the limitation of LC response time. The RGBW method timing chart is illustrated in Fig. 2-2. Comparison between RGB method and RGBW method, the LC response time of RGBW method (tLC’) is the one-quarters shorter than the RGB
method (tLC). The time for LC response becomes shorter when the field number
10
Therefore, some auxiliary solutions for providing longer time to LC response will be given in the next section.
RG
B
180HzRG
B
RG
B
360Hz (a) (b)RG
B
C
Y
300HzRG
B
W
max 240Hz (c) (d)Fig. 2-1 (a) The conventional RGB method and (b) the double frame rate method. (c) The RGBCY sequence and (d) the RGBWmax sequence of insertion multi-primary
color field method.
≈ TFT Scanning B/L Flashing tBL’ t B tLC’ tTFT’ 1/4f R R B G G frame time W W ≈ TFT Scanning B/L Flashing t tLC tTFT tBL 1/3f R G B R G B frame time
Fig. 2-2 The timing charts of (a) the RGB method and (b) the RGBW method.
2.1.1 Multi-division Backlight
The multi-division backlight technique is used to provide more time for LC response. This method is divided display into many areas, and the multi-division
11
backlight technique timing chart is illustrated in Fig. 2-3. Eq.2-1 describes the time distribution for scanning time, LC response time, and backlight flashing time. Where, N is number of the divided area, tTFT is the scanning time for the whole panel, and tBL
is the back-light flash time. Comparing Eq.2-1 with Eq.1-1, the TFT scanning time becomes shorter with increase N. Thus, the more divided areas can save longer time for LC response. Taking a 60Hz frame rate conventional RGB sequence, XGA panel as an example. Each field rate of RGB method is 5.67ms, if the divided area is 10 (N=10), the LC response time is computed to be 2.57ms which is longer than the conventional FSC method (1ms) without using the divided area technique. Therefore, the multi-division backlight technique enhanced LC response time efficiently.
frame time
t
Fig. 2-3 The timing chart of the divided display area method.
BL t LC t N TFT t f 3 1 = + + (Eq.2-1)
12
2.1.2 Overdrive Scheme
The overdrive technique artificially boosts LC response time by increasing the voltage used to make liquid crystals change state [10]. Currently LCDs have a drawback, blurred phenomenon, which happens during rapid movement due to low response LC modes. Thus, the fast response LC mode, optically compensated bend (OCB) mode was proposed for TV applications [11]. The OCB configuration is shown in Fig. 2-4, and it has advantages such as fast response and a wide viewing angle. However, the LC response time in the conventional TFT drive is longer than that in a static drive, due to the dielectric anisotropy of liquid crystal material. Therefore, the capacitively coupled driving method (CC driving method) was proposed to improve LC response time [12]. The CC driving method utilizes the capacitively coupled voltage which is applied to the pixel electrode through a storage capacitor formed between the preceding scanning line and the pixel electrode. The response times with CC driving method are enhanced twice or more than conventional TFT-LCD driving method. Unfortunately, the OCB mode has not yet been commercialized for large size LCDs. The further way to increase possibility of FSC-LCD implementation is to reduce the field number. The two-filed method will be detailed in the next section.
13
2.2 Two-field Method with Color Filters
A spatial-temporal display method was proposed by Louis D. Silverstein for enhancing display image quality [13]. This spectrum sequential method combined spatial color mixing with color filters and temporal color mixing by using sequential backlight. The number of primary color sub-pixel elements was reduced from three to two. Two primary sub-pixel elements arranged in a two dimensional checkerboard mosaic and the third primary color was presented through temporal synthesis. A type of spatial-temporal display configuration is described in Fig. 2-5 . This configuration combines a switchable illumination source, an LCD panel, and pixel mosaic color filters which consist of a checkerboard pattern of magenta (M) and cyan (C). Where, the light source switches between yellow (Y) and blue (B) spectrum power distribution, and illumination sources can be provided by CCF fluorescent or LEDs. When the Y illuminant is activated during the first temporal field, the output image consist a checkerboard pattern of red and green sub-pixels. The B illuminant active in the second temporal field yields the output display in homogenous B sub-pixels. The two filed images display sequentially to generate a full-color image. Moreover, the spatial-temporal display method provides many degrees of freedom for choosing color combinations of temporally switched illuminants and color filter mosaics to achieve different display performance objectives.
In Philips research [14], they compared the three types display methods. One is the display without color filter with R, G, B primary sequential fields; the second type display is the display with three color filters, and using two color fields display sequentially to yield full-color image; the third type display with two color filters, and using two color fields display sequentially for displaying colorful target image. Table. 2 lists the comparisons of four kinds display methods. The display without
14
color filters can gain up to three times luminance and resolution than conventional LCD. The two field method with three color filters has highest color gamut (127%) compared with other three display methods and slighter CBU visibility than the two field method with two color filters. Two kinds of two field methods reduced CBU visibility compared to the three field method due to reduce the contrast of color bar. The two field method with 120 Hz field rate allows longer time for LC response and promotes the light efficiency from 33% to 50%. Additionally, two field methods can reduce CBU visibility effectively.
LCD Panel Pixel Mosaic (M/ C) Illumination Source (Y/B) CCFL LED Or
LCD Panel Pixel Mosaic (R/ G) Illumination Source
(Y on /B off)
LCD Panel Pixel Mosaic (B) Illumination Source
(Y off /B on)
15
Table. 2 The comparisons of four types display [19].
2.3 Summary
The FSC-LCDs have three times optical throughput than conventional LCDs. However, the serious issue for the operations is limitation of LC response time. Some auxiliary solutions were proposed for increasing LC response time, such as multi-division backlight technique and overdrive technique. However, these methods cannot provide enough LC response time for large size display. Louis D. Silverstein proposed a spatial-temporal two field method to reduce field number and save longer time for LC response. This two field method still needs color filters which will sacrifice the light throughput. Therefore, we proposed the two-color-field sequential method without color filters which can not only reduce the LC response time but also can promote the optical throughput of FSC-LCDs to 100%.
16
Chapter 3
Two-color-field Sequential Method
Two-color-field sequential method for color filterless LCD was proposed to further reduce the field rate, and provide the longest time for LC response. Thus, many commercial LC modes such as TN, IPS, and MVA modes can achieve the response time. The concept and algorithm of proposed method will present in section 3.1. The following section described the two indexes for evaluating the accuracy of colorimetric reproduction. Finally, the CBU examination will be given.
3.1 Two-color-field Sequential Method
3.1.1 Concept
The concept of proposed two-color-field sequential method is displaying two color-mixing fields with double frame rate to generate a full-color image. The proposed two-color-field sequential method is different from other two-field methods in regard to color filters. The comparison of driving scheme between conventional three field method and proposed two-color-field sequential method is illustrated in Fig. 3-1. The conventional FSC method displays red, green, and blue field images time sequentially with triple frame rate to yield a full-color image. The proposed two-color-filed sequential method flashes two color-mixing fields with two-thirds filed rate of conventional method to generate a full-color image. Two-color-field sequential method uses the least field number, and provides longest time for LC response. Thus, the LC modes can be utilized in commercial LC modes, such as TN,
17
MVA, or IPS. Moreover, the proposed two-color-field sequential method is a type display method for color filterless LCD, so it can take full advantages of optical efficiency enhancement of the temporal color-mixing methods.
B-field G-field R-field RB1-field GB2-field Target image t Field 2 Field 1 Field 3 Field 1 Field 2 Three-field method Two-color-field method
Fig. 3-1 Two driving-scheme types, a typical three-field method and the proposed two-color-field sequential method, are illustrated, by field decomposition of color fields to generate a full-color image.
3.1.2 LCD Structure
In order to display a color-mixing field in proposed method for LCD without color filters. We propose to incorporate the local color dimming backlight technique [15] to substitute for the equivalent function of the special color filters. The local color dimming backlight technique is a kind of backlight controlling technique, which can locally control LED signals per color per division. This technique was also called high dynamic range (HDR) technique, and the flowchart is illustrated in Fig. 3-2. First of all, normalized target intensity of each pixel was got by input digital LC signals in full on white backlight. Then, LED signals were computed based on target image content by local controlled backlight algorithm, such as maximum, root, or average of signals in each segment [16]. Following, the point spread function was convoluted the LED
18
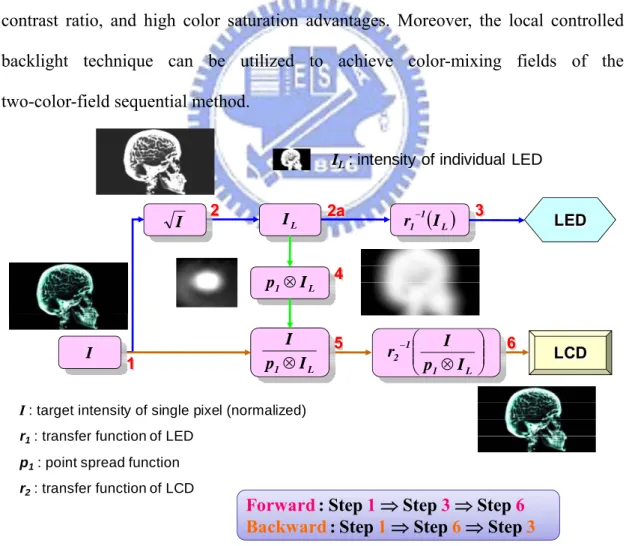
signals in each segment to get backlight distribution. In step 5, the LC intensity in each pixel was calculated by target intensity divided backlight distribution. Finally, the LED and LC driving signals were got by inversing transfer functions of LED and LCD individually. This algorithm can be used into two different processes, one is the forward process and the other is backward process. The forward process follows at step 3 compute the backlight distribution firstly, and then in step 6 get compensated LC signals. However, sometimes the compensated LC signals will be got firstly, thus the process will be inversed to calculate LED driving signals. Using the local dimming backlight system can dim or boost backlight intensity in each segment depend on image content. Thus, the HDR technique has low power consumption, high contrast ratio, and high color saturation advantages. Moreover, the local controlled backlight technique can be utilized to achieve color-mixing fields of the two-color-field sequential method.
I 1 I 2
( )
L 1 1 I r − 3 L 1 I p ⊗ 4 L 1 I p I ⊗ 5 ⎟⎟⎠ ⎞ ⎜⎜ ⎝ ⎛ ⊗ − L 1 1 2 I p I r 6 LED LCD L I 2aIL: intensity of individual LED
I : target intensity of single pixel (normalized)
r1: transfer function of LED
p1: point spread function
r2: transfer function of LCD
Forward: Step 1⇒ Step 3⇒ Step 6
Backward : Step 1⇒ Step 6⇒ Step 3
19
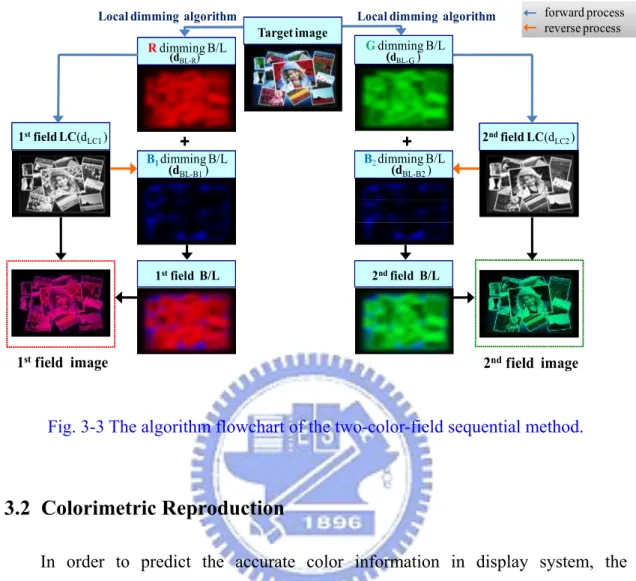
3.1.3 Algorithm
The procedure starts at transforming the digits of an input image into the corresponding tri-stimulus values of each primary channel as the target information. The transformation is accomplished through a suitable color model [17], as detailed in the next section. Then, the red and the green, for example, are chosen as the first and the second primaries (Fig. 3-3). After being dealt with by the forward process of local color dimming backlight technique, the red information in the first field is achieved by the sets of LED signals (dBL-R) and LC signals (dLC1), while the green one in the second
field by the sets of dBL-G and dLC2. The forward process features the sequence of the first
deriving the light-emitting diode (LED) signals and then computing the LC compensation signals to achieve the target information; the backward process reverses the forward one [18].
As for the blue one in the first field, the blue target information is dealt with via the backward process, based on dLC1, to deduce the blue LED signals (dBL-B1) for the first
field. In general, the blue information, resulted from the combination of dLC1 and dBL-B1,
may be different from the blue target information. Therefore, the difference between the original and the resulted blue information in the first field is set as the new blue target information for the second field. Following the same procedure, the set of blue LED signals (dBL-B2) for the second field is obtained.
In practice, the accuracy of the third color reproduction depends on backlight layout, light spread function (LSF), and image content. The algorithm should be iterated with additional optimization process to improve color presentation accuracy. In addition, the decision of the third primary is not unique. The blue information, in the aforementioned example, is selected since the human vision system is less sensitive to blue information. Besides, a primary with least significant content is a useful option to
20
increase reproduction accuracy.
1stfield image 2ndfield image
Target image Rdimming B/L (dBL-R) Gdimming B/L (dBL-G) + +
Local dimming algorithm Local dimming algorithm
(dBL-B2 ) (dBL-B1 ) B1dimming B/L B2dimming B/L 1stfield LC(d LC1 ) 2ndfield LC(dLC2 ) 2ndfield B/L 1stfield B/L forward process reverse process
Fig. 3-3 The algorithm flowchart of the two-color-field sequential method.
3.2 Colorimetric Reproduction
In order to predict the accurate color information in display system, the colorimetric characterizations of displays were determined. In 1998, Fairchild and Wyble, recognizing the fundamental differences between liquid-crystal and cathode-ray-tube technologies, develop a successfully LCD color model [19]. The color model configuration is described in Eq.3-1. The process is divided into two main stages. The first non-linear stage of the model is built up three one-dimensional look-up tables (LUTs) of the radio-scales in each channel, as shown in Eq.3-1-1. The LUTs described the relationship between the digital input signals used to drive a display and the radiant output produced through LC cells by accounting for non-linear optoelectronic transfer function, OETF. Where, d defines digital counts and R, G, and B are radio-scales for red, green, and blue channels, respectively. The radio-scales’
21
ranges were conformed from 0 to 1. The second linear stage, as shown in Eq.3-1-2, represented the correlations between radio-metric scalars and the resultant tri-stimulus values. The flare term, [Xk, Yk, Zk]T accounts for the radiant output at black level in
LCDs, since the liquid crystal having a minimum transmittance factor above zero. Moreover, the “max” subscript defines each channel’s maximum output and subscript “kmin” defines the black-level radiant output. Furthermore, this color model performs non-linear optimization to minimize the mean CIEDE2000 color difference of test colors sampling the display’s gamut in complex models. However, this color model is not suitable used in color dimming backlight system.
0 ≤ R,G,B ≤ 1 R=LUT(dr) G=LUT(dg) B=LUT(db) (Eq.3-1-1) (Eq.3-1-2)
Therefore, the color model should be modified to incorporate the color backlight intensity. Then, the equation was transformed, as shown in Eq.3-2 [17], where, L is the normalized backlight intensity in each color which can be obtained by the convolution computation with LED signals and light spread function of each LED. The subscript “r, g, and b” defines red, green, and blue colors respectively. Summarily, this color model was suitable to be used for predicting color information in our proposed system. ⎥ ⎥ ⎥ ⎦ ⎤ ⎢ ⎢ ⎢ ⎣ ⎡ + ⎥ ⎥ ⎥ ⎦ ⎤ ⎢ ⎢ ⎢ ⎣ ⎡ ⎥ ⎥ ⎥ ⎦ ⎤ ⎢ ⎢ ⎢ ⎣ ⎡ − − − − − − − − − = ⎥ ⎥ ⎥ ⎦ ⎤ ⎢ ⎢ ⎢ ⎣ ⎡ k k k k max b, k max g, k max r, k max b, k max g, k max r, k max b, k max g, k max r, Z Y X B G R Z Z Z Z Z Z Y Y Y Y Y Y X X X X X X Z Y X
22 r r r r r Z Y X L Z Y X L B G R Z Z Z Z Z Z Y Y Y Y Y Y X X X X X X k k k k max b, k max g, k max r, k max b, k max g, k max r, k max b, k max g, k max r, ⎥ ⎥ ⎥ ⎦ ⎤ ⎢ ⎢ ⎢ ⎣ ⎡ + ⎥ ⎥ ⎥ ⎦ ⎤ ⎢ ⎢ ⎢ ⎣ ⎡ ⎥ ⎥ ⎥ ⎦ ⎤ ⎢ ⎢ ⎢ ⎣ ⎡ − − − − − − − − − = ⎥ ⎥ ⎥ ⎦ ⎤ ⎢ ⎢ ⎢ ⎣ ⎡ g g g g g L Z Y X L B G R Z Z Z Z Z Z Y Y Y Y Y Y X X X X X X k k k k max b, k max g, k max r, k max b, k max g, k max r, k max b, k max g, k max r, ⎥ ⎥ ⎥ ⎦ ⎤ ⎢ ⎢ ⎢ ⎣ ⎡ + ⎥ ⎥ ⎥ ⎥ ⎦ ⎤ ⎢ ⎢ ⎢ ⎢ ⎣ ⎡ ⎥ ⎥ ⎥ ⎦ ⎤ ⎢ ⎢ ⎢ ⎣ ⎡ − − − − − − − − − b b b b b L Z Y X L B G R Z Z Z Z Z Z Y Y Y Y Y Y X X X X X X k k k k max b, k max g, k max r, k max b, k max g, k max r, k max b, k max g, k max r, ⎥ ⎥ ⎥ ⎦ ⎤ ⎢ ⎢ ⎢ ⎣ ⎡ + ⎥ ⎥ ⎥ ⎦ ⎤ ⎢ ⎢ ⎢ ⎣ ⎡ ⎥ ⎥ ⎥ ⎦ ⎤ ⎢ ⎢ ⎢ ⎣ ⎡ − − − − − − − − − (Eq.3-2)
3.2.1 Color Difference Formula
Color difference formula is used to evaluate the color difference between two static images. In our research, the color difference index would be used to verify the colorimetric reproduction accuracy. Since 1976, the International Commission on Illumination (CIE) recommended two color-difference formula for industrial applications, the CIELAB and CIELUV formula [20]. The modification formula, CIEDE2000 [20], includes not only lightness, chroma, and hue weighting functions, but also an interactive term between chroma and hue differences for improving the performance for CIELAB color difference indexes. There are four steps include in CIEDE2000 calculation. In the first step, calculate the CIELAB as shown in Eq.3-3-1, the parameters L*
represents lightness, a*
approximate redness-greenness, b*
approximate yellowness-blueness, and C*
ab chroma. Then, compute a’, C’, and h’,
follow Eq.3-3-2, in this step, bar C*
ab is the arithmetic mean of the C *
ab values for a
pair of samples. The third step, obtain ΔL’, ΔC’ and ΔH’ values between standard and sample in a pair as shown in Eq.3-3-3. At last step, calculate the color difference values using CIEDE2000 formula in Eq.3-3-4. The parameters SL, SC, and SH are the
23
weighting functions for lightness, chroma, and hue differences, respectively. kL, kC,
and kH values are the parametric factors to be adjusted according to different viewing
parameters, for the lightness, chroma, and hue components, individually. RT function
is intended to improve the performance of color-difference equation for fitting chromatic differences in the blue region. The color difference formula CIEDE2000 considers more color conditions, and it will be more suitable for evaluating the color differences.
(Eq.3-3-1)
(Eq.3-3-2)
24
(Eq.3-3-3)
(Eq.3-3-4)
3.2.2 Spatial-CIELAB (S-CIELAB)
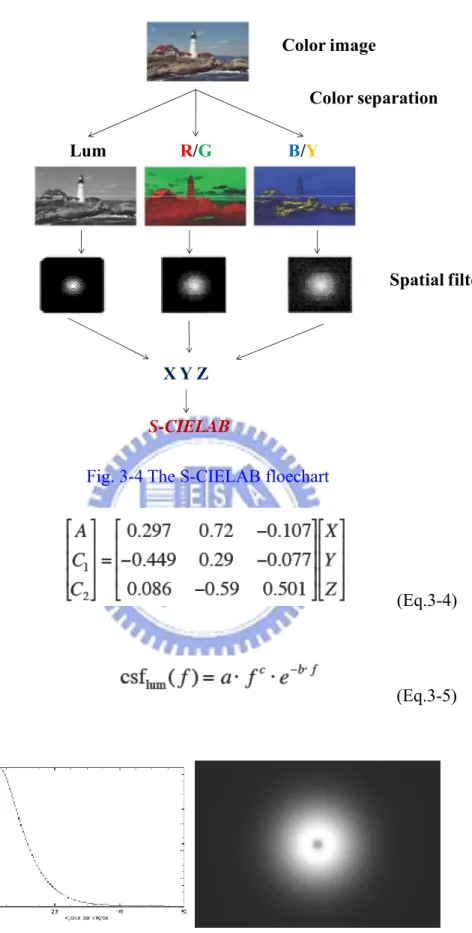
The CIE color difference formulae are developed to measure the color difference between color patches with small color difference after moderate chromatic adaptation. However, this value does not give satisfactory results in human visual system; because of the point-by-point computation result in complex image is always larger than observer’s visibility. Therefore, X.Zhang proposed extension of the CIELAB color metric, Spatial-CIELAB(S-CIELAB) to measure color reproduction errors in images [21]. The Spatial-CIELAB flowchart is illustrated in Fig. 3-4. In the first step, transform the input images into a device independent space, CIE 1931 XYZ tri-stimulus values. The second step, put tri-stimulus values into opponent-color space, AC1C2.These channels were determined through series psychophysical experiments
testing for pattern-color separability [22], where A denotes the luminance channel and C1, C2 are chrominance channels. The opponent channels are a linear transform CIE
25
1931 XYZ as shown in Eq.3-4.The third step, operate the opponent sensitivity signals to frequency domain by Fourier transformation. These three independent channels can be spatially filtered, using filters that approximate the contrast sensitivity function (CSF) of the human visual system. Each channel can accomplish using multiplications in the frequency domain. Moreover, a three parameter exponential model, described by Movshon, is description of the general shape of luminance CSF, which model is shown in Eq.3-5, where, f is the spatial frequency in unit of cycle per degree, the parameters, a, b, c were fit to existing experimental data, and the normalized frequency filter for luminance channel as shown in Fig. 3-5.The CSF of other two chrominance channels is expressed by Eq.3-6, and the normalized opponent color contrast sensitivity is described in Fig. 3-6. The available data can be fitted withthe sum of Gaussian functions, and the parameters for chrominance CSF that were fitted to the Van der Horst and Poirson data sets is shown in Table. 3. Finally, sum up the difference between target image and reproduced image computed by CIELAB color difference formula, the output value were evaluated the colorimetric reproduction errors. Consequently, the S-CIELAB difference measure reflects both spatial and color sensitivity, due to psychophysical experiments verified, the index is more suitable to evaluate the image reproduction errors.
26 Color image Color separation Lum R/G B/Y Spatial filter X Y Z S-CIELAB
Fig. 3-4 The S-CIELAB floechart
(Eq.3-4)
(Eq.3-5)
Fig. 3-5 The normalized luminance contrast sensitivity and frequency filter for luminance channel.
27
(Eq.3-6)
Table. 3 Parameters for chrominance CSFs
Fig. 3-6 The normalized opponent color contrast sensitivity
28
3.3 Color Break-up Examination
A relative contrast sensitivity (RCS) index was used to evaluate the color break-up phenomenon [23]. The RCS values were computed following the procedures in the S-CIELAB with some modifications, as shown in Fig. 3-8. Firstly, transform the digits of an input image and CBU image into the corresponding tri-stimulus values of each primary channel. Then, tri-stimulus values, XYZ transform into opponent-color space, AC1C2, where A denotes the luminance-related channel signals; C1 as the
red-green channel signals and C2 is the blue-yellow channel signals. Third, each
channel of opponent-color signals convolute the contrast sensitivity function (CSF) to simulate the spatial blurring by the human visual system. Forth, subtract the filtered channel images between each channel to extract the CBU fringe. Finally, the subtracted result of each pair of filtered channel images are summed together in different weights. The outcome is relative contrast sensitivity, RCS. The CBU phenomenon will be evaluated by RCS index to reflect the stimulus of CBU fringes in human visual system.
29
& Weighting Sum A C1 C2 A’ C1’ C2’
=
=
=
dr dg db X Y Z A C1 C2 A’ C1 ’ C2 ’ CBU Image Spatial blurring A C1 C2 A’ C1’ C2’=
=
=
Color model Original Image ΔA’ ∆C1’ ∆C2’ Weight SubtractionRCS
Fig. 3-8 The RCS flowchart
3.4 Summary
The two-color-field sequential method proposed to further reduce the field number which can result in longer time for LC response, which commercial LC modes can achieve. In this method, we incorporate local color dimming backlight technique to substitute for the equivalent function of the special color filters, and keep the whole optical throughput.
The S-CIEDE2000 index combined a spatial modulation of human visual system before calculating CIEDE2000 values. The RCS value reflects humans’ response for CBU edge stimulus. Therefore, the two indexes, S-CIEDE2000 and RCS will be used to verify the experimental accuracy in follow sections.
30
Chapter 4
Experimental Results
A verification of color reproduction accuracy was based on a 37” HDR display with 8 by 8 locally controlled color backlight divisions. The light spread function (LSF) of each division and display characteristic were measured to predict the LED and LC driving signals. Color difference values between the target image and the reproduced image were evaluated for color reproduction accuracy. Moreover, CBU examination will be presented in follow sections.
4.1 Experiments
The experimental apparatus are illustrated in Fig. 4-1. The LED and the compensated LC signals were calculated by using computer. The driving signals input to the HDR panel, and then the colorimeter measured tri-stimulus. The experimental flowchart is shown in Fig. 4-2.
First, the light spread functions per color per divisions were measured since the HDR display is a spatial shift-variant system, as shown in Fig. 4-3. Each LSF had different profile, especially at the display edges. Therefore, the measurement of light spread function was used to predict accurate LED signals. Secondly, LCD characteristics were measured including tri-stimulus values of maximums and flare terms in each primary color, also the OETF of LC cells in the panel. Then, measured parameters were used to establish a suitable color model for this panel, as mentioned in section 3.2. The following step, depend on a two-color-field algorithm to predict the LED and LC signals. Next step, input the calculated signals into the panel, and
31
measured the tri-stimulus values of the test image. Finally, calculate the color difference between target image and reproduced image. Therefore, color difference valuesevaluatedthe accuracy of color reproduction.
37” HDR display with 64 BL segments
Colorimeter Computer
Fig. 4-1 The experimental apparatus.
Measurement of LSF in
each B/L segment
Measurement of
display characteristic
Establishment of color model
Two-color-field sequential method
Pure color verified
Spatial frequency
variation
32
Fig. 4-3 The spatial shift-variant system.
4.1.1 Light Spread Function Measurement
The experimental results of light spread function measurement are illustrated in Fig. 4-4. In the two-color-field sequential method algorithm, the backlight distribution was gathered using the superposition method. Comparing the conventional convolution method with the superposition method, the convolution method measured one light spread function to simulate each light spread function and used convolution algorithm to get backlight distributions. On the other hand, the superposition method measures every light spread function and adds each light distribution to obtain backlight distribution. For example, in the full on white backlight; the superposition method has a higher correlation coefficient of 95% with measurement result than convolution methods of 83% as shown in Fig. 4-5. Therefore, the light spread function of 64 backlight divisions of three primary colors were measured to predict accurate LED signals and compensated LC signals.
33
Fig. 4-4 The experimental results of light spread function measurement.
83%
95%
(a) (b) (c)
Fig. 4-5 The comparison of (a) measurement full on white backlight and (b) the convolution method and (c) the superposition method.
34
4.1.2 Panel Characteristic Measurement
In order to obtain device-independent color, the color model was established. As section 3.2 mentioned, a suitable color model needs three 3-dimensional look-up tables and the tri-stimulus of the panel. Therefore, 37” HDR display parameters were measured to build the color model.
When designing the look-up tables, the LC driving signals were divided ten parts from 0 to 255 gray levels in full-on backlight. Measuring the tri-stimulus, X, Y, Z, of these eleven levels, and the correlation between the digital input signals used to drive a display and the radiant output produced through LC cells by accounting for non-linear optoelectronic transfer functions were obtained. The 3-dimensional look-up tables of the three primary colors are illustrated in Fig. 4-6.
In the second part of the measurement process, the maximum and flare terms of tri-stimulus values in the HDR panel were measured by using the colorimeter. The maximums of tri-stimulus were measured with full-on backlight and largest LC driving signals in each primary color individually. Thus, Eq.3-2 was transformed to Eq.4-1. Consequentially, the result color model was used to predict the accurate LED and compensated LC signals.
0 50 100 150 200 250 300 350 0 200 400 X GL 0 20 40 60 80 100 120 140 0 200 400 Y GL 0 0.02 0.04 0.06 0.08 0.1 0.12 0.14 0.16 0.18 0.2 0 200 400 Z GL (GL) (GL) (GL) (a)
35 0 10 20 30 40 50 60 70 80 0 200 400 X GL 0 50 100 150 200 250 300 350 0 200 400 Y GL 0 5 10 15 20 25 30 35 40 0 200 400 Z GL (GL) (GL) (GL) (b) 0 20 40 60 80 100 120 0 200 400 x GL 0 5 10 15 20 25 30 0 200 400 Y GL 0 100 200 300 400 500 600 700 0 200 400 Z GL (GL) (GL) (GL) (c)
Fig. 4-6 Three 3-dimentional LUTs of (a) red, (b) green, and (c) blue.
r r r r r Z Y X L 0001 . 0 079 . 0 182 . 0 L B G R 0001 . 0 2.886 0001 . 0 0.076 0001 . 0 176 . 0 079 . 0 0.207 079 . 0 2.601 079 . 0 41 . 125 182 . 0 0.753 182 . 0 3.511 182 . 0 14 . 292 ⎥ ⎥ ⎥ ⎦ ⎤ ⎢ ⎢ ⎢ ⎣ ⎡ + ⎥ ⎥ ⎥ ⎦ ⎤ ⎢ ⎢ ⎢ ⎣ ⎡ ⎥ ⎥ ⎥ ⎦ ⎤ ⎢ ⎢ ⎢ ⎣ ⎡ − − − − − − − − − = ⎥ ⎥ ⎥ ⎦ ⎤ ⎢ ⎢ ⎢ ⎣ ⎡ g g g g g L 0.051 0.274 0.0534 L B G R 0.051 13.025 0.051 33.876 0.051 0.01314 0.274 5.486 0.274 293.9 0.274 9.6456 0.0534 1.903 0.0534 65.481 0.0534 19.532 ⎥ ⎥ ⎥ ⎦ ⎤ ⎢ ⎢ ⎢ ⎣ ⎡ + ⎥ ⎥ ⎥ ⎦ ⎤ ⎢ ⎢ ⎢ ⎣ ⎡ ⎥ ⎥ ⎥ ⎦ ⎤ ⎢ ⎢ ⎢ ⎣ ⎡ − − − − − − − − − b b b b b L 0.782 0.041 0.144 L B G R 0.782 618.69 0.782 11.793 0.782 0.00014 0.041 23.987 0.041 28.486 0.041 0.0968 0.144 111.11 0.144 3.1348 0.144 0.2227 ⎥ ⎥ ⎥ ⎦ ⎤ ⎢ ⎢ ⎢ ⎣ ⎡ + ⎥ ⎥ ⎥ ⎦ ⎤ ⎢ ⎢ ⎢ ⎣ ⎡ ⎥ ⎥ ⎥ ⎦ ⎤ ⎢ ⎢ ⎢ ⎣ ⎡ − − − − − − − − − (Eq. 4-1)
36
4.2 Results
The results of colorimetric reproductions are illustrated in 4.2.1. The test images include pure color images with different gray levels and random color patch images with differing spatial frequency. Moreover, the results of color break-up examinations will be given.
4.2.1 Color Differences
The color reproduction verifications include two parts, pure color image reproductions and the color patch images reproductions. The twelve pure color images of 10, 90, 180, and 250 gray levels in three primary colors were chosen as the test images. Moreover, the average CIEDE2000 values evaluated the accuracy of colorimetric reproduction. The colorimetric reproduction results of pure color images are illustrated in Fig. 4-7. As the results shown, the color differences of average CIEDE2000 values were all of less than 1. The results demonstrated colorimetric reproduction accurate and verified the suitable color model.
Red (GL) 10 90 180 250 ∆E00 0.02 0.09 0.06 0.08 Green (GL) 10 90 180 250 ∆E00 0.03 0.12 0.08 0.69 Blue (GL) 10 90 180 250 ∆E00 0.41 0.29 0.97 0.38
37
In spatial frequency verification, there were five color patch images with different image contents, 1x1, 2x2, 4x4, 8x8, and 16x16 were chosen as the test images. The test images were used to analyze the correlations between spatial frequency variations and colorimetric reproduction accuracy. The color difference values of the test images are shown in Fig. 4-8. The results indicated the color difference increased in the images with more complex image contents. The color difference values in higher spatial frequency were larger than three, whose values were distinguished for human eye. The unsuitable colorimetric reproductions were caused by the limitation in backlight divisions.
Test image ΔE00 0.06 1.02 3.8 5.4 7.23
0
2
4
6
8
1x1
2x2
4x4
8x8
16x16
Δ E00 Spatial frequency38
4.2.2 Color Break-up Examination
A color break-up examination based on five test color patches with light-skin, Asia-skin, strong red, sky blue, grass green, and white colors as shown in Fig. 4-9. The three primary colors were chosen as the third primary in two-color-field algorithm alternately. Moreover, the third primary component was divided into ten sections separating into two field images in terms of specific ratio. Then, analyze the correlations between color arrangement and color break-up suppressions by using RCS evaluation index.
The CBU examination results are illustrated in Fig. 4-10. In the light-skin test image, the thirty RSC values described the CBU suppression efficiency normalized with the maximum of these thirty values, as shown in Fig. 4-10. (a). In the diagram, the horizontal axis was the ratio of color component arrangement into two field images, where 2 meant the separated ratio of each component between the first and the second field images was two eighth. As a result, the minimum value appeared at the fifth point in red component which divided into two field images. The minimum value of RCS index meant the effective CBU suppression. Fig. 4-10 (b) demonstrated the CBU examination result of Asia-skin test image, the minimum value of RCS showed at sixth point of red component. Refer to Fig. 4-10 (c), the good CBU suppression value of strong-red image was the fifth point of red divided component. In sky-blue test image shown in Fig. 4-10 (d), the second to sixth points in blue component separation have the same slight RCS values. Based on the results shown in Fig. 4-10 (e), the optimal point appeared at the sixth of green component. In the last test white image Fig. 4-10 (f), the minimum RCS value was shown at the fifth point in green part. Summarily, the CBU suppressions were based on the color arrangement which separated the main color component into two field images.
39
Asia Skin
Light Skin
Sky Blue
Grass Green
White
Strong Red
Fig. 4-9 Six test images were used to analyze the CBU suppression.
0 0.2 0.4 0.6 0.8 1 1.2 0% 20% 40% 60% 80% 100% 120%
blue red green
Color arrangement ratio Color arrangement ratio
RC S RC S 0 0.2 0.4 0.6 0.8 1 1.2 0% 20% 40% 60% 80% 100% 120%
blue red green
(a) (b) 0 0.2 0.4 0.6 0.8 1 1.2 0% 20% 40% 60% 80% 100% 120%
blue red green
Color arrangement ratio Color arrangement ratio
RC S RC S 0 0.2 0.4 0.6 0.8 1 1.2 0% 20% 40% 60% 80% 100% 120%
blue red green
40 0 0.2 0.4 0.6 0.8 1 1.2 0% 20% 40% 60% 80% 100% 120%
blue red green
Color arrangement ratio Color arrangement ratio
RC S RC S 0 0.2 0.4 0.6 0.8 1 1.2 0% 20% 40% 60% 80% 100% 120%
blue red green
(e) (f)
Fig. 4-10 The CBU examination results of (a) light-skin, (b) Asia-skin, (c) strong-red, (d) sky-blue, (e) grass-green, and (f) white images.
Furthermore, the comparisons of RCS values between two-color-field method and other sequential methods are illustrated in Fig. 4-11. The RCS value of conventional RGB sequential method was defined as 100%. Comparing the two-color-field method with four kinds color sequences, RGB, RGBCY, RGBW, and RYGB, the RSC value of proposed method was 37.9% in light-skin image (Fig. 4-11 (a)). In Asia-skin test image, as shown in Fig. 4-11(b), the CBU suppression of two-color-field method was 53.5%. Fig. 4-11 (c) shows the RCS value of two-color-field method in strong-red color is 0.53. In the next test image, sky-blue color shown in Fig. 4-11 (d), demonstrated the RCS value in proposed method was 53.8% less than RGB method. Additionally, the CBU suppressions ratios of two-color-field method in grass-green and white images were 21.1% and 45.6% respectively, as shown in Fig. 4-11 (e) and (f). Consequently, the CBU suppressions ratios of two-color-filed method were about 37.8% than conventional RGB method.
41 0 0.2 0.4 0.6 0.8 1 1.2
RGB RGBCY RGBW RYGB 2-field
RCS 37.9% 0 0.2 0.4 0.6 0.8 1 1.2
RGB RGBCY RGBW RYGB 2-field
RC S 53.3% (a) (b) 0 0.2 0.4 0.6 0.8 1 1.2
RGB RGBCY RGBW RYGB 2-field
RCS 23.1% 0 0.2 0.4 0.6 0.8 1 1.2
RGB RGBCY RGBW RYGB 2-field
RCS 46.2% (c) (d) 0 0.2 0.4 0.6 0.8 1 1.2
RGB RGBCY RGBW RYGB 2-field
RCS 46.2% 0 0.2 0.4 0.6 0.8 1 1.2
RGB RGBCY RGBW RYGB 2-field
RCS 45.6%
(e) (f)
Fig. 4-11 The comparisons of RSC values between two-color-field method and other sequential methods in (a) light-skin, (b) Asia-skin, (c) strong-red, (d) sky-blue, (e) grass-green, and (f) white images.
42
4.3 Discussions
The verifications of colorimetric reproduction were based on an LCD with locally controlled backlight module of 8 by 8 divisions. As the experimental results showed, the color differences were increased along with complex image contents. The CIEDE2000 values in images with high spatial frequency were larger than three, which were unacceptable values of colorimetric reproduction accuracy since the limitation of presented backlight divisions. Therefore, the essential backlight parameters, number of divisions and light spread function (LSF) size, must be optimized to improve accuracy of colorimetric reproduction on images with complex contents.
Color arrangements in two-color-field method play an important role. The CBU examination results demonstrated that the minimum RCS value appeared when the main color components of test images separated into two field images. However, the accuracy of colorimetric reproduction was based on dividing the least component into two field images because of less reproduction errors. Therefore, the color arrangement of CBU suppression and colorimetric reproduction was tradeoff.
43
Chapter 5
Optimizations of Two-color-field Method
To improve accuracy of colorimetric reproduction in images with complex content, the backlight parameters, number of segments and light spread function (LSF) size, must be optimized. Moreover, color difference maps were used to describe the accuracy of colorimetric reproductions. Finally, results and discussions will be presented.
5.1 Backlight parameters
The two main backlight parameter factors affected color reproduction accuracy were the number of backlight divisions and light spread function size. Considering implementation complexity and thermal effect, the backlight parameters optimizations were essential. The two-dimensional Gaussian profile was simulated as the LSF in optimal process, where σ size was used to adjust the LSF width, as shown in Fig. 5-1. The optimal process and results are detailed below.
σ
44
5.1.1 Backlight Divisions
There were five test color patch images with different image content were chosen as test images as shown in Fig. 5-2. An LSF, formulated by a two-dimensional Gaussian profile with horizontal and vertical standard deviations σx = 60 pixels and σy
= 60 pixels, was applied to initiate the optimization. The Gaussian profile was adopted for simplicity; σx and σy were selected because ofthe largest backlight segment size.
The results, as shown in Fig. 5-3, show that color differences of the five test images are decreased along with increasing amount of backlight divisions. The reason is that more independent backlight segments provide higher resolution of output backlight distribution, which is more adequate to be compensated by the LC module. Under current LSF setup, backlight division 80*45 is the optimized value since color difference only varies slightly exceeding this value.
1-patch
4-patches
12-patches
48-patches
144-patches
Fig. 5-2 Five test images with different image contents
5.1.2 Light Spread Function Size
Color reproduction accuracy dependenceon LSF size was performed under 80*45 backlight segments. Similarly, color difference reduces when the LSF size shrinks, as shown in Fig. 5-4. LSF must be concentrated to adapt to increased spatial frequency of images. With σx*σy = 31*31 pixels, the color difference is lowered to an average of
45
0
2
4
6
8
10
12
14
16
16*9 32*18 48*27 64*36 80*45 96*54
Δ
E
00(ave.)
B/L divisions
16*9
8*6
4*3
2*2
1
Fig. 5-3 The correlation between number of backlight divisions and color differences.
![Fig. 1-3 Timing chart in the FSC-LCD [2].](https://thumb-ap.123doks.com/thumbv2/9libinfo/8751731.206078/15.892.257.641.483.755/fig-timing-chart-fsc-lcd.webp)
![Fig. 2-5 The spatial-temporal display con configuration [13].](https://thumb-ap.123doks.com/thumbv2/9libinfo/8751731.206078/26.892.209.627.510.1004/fig-spatial-temporal-display-configuration.webp)