model results. Analysis suggests that strong internal tides are generated in Luzon Strait, propagate as a narrow tidal beam into the SCS, are amplified by the shoaling continental slope near TungSha Island, become nonlinear, and evolve into high-frequency nonlinear internal waves (NIW). Internal waves in the SCS have geographically distinct characteristics. (1) West of Luzon Strait the total internal wave energy (Eiw) is 10! that predicted by
Garrett-Munk spectra (EGM) (Levine, 2002). There is no sign of
NIW. (2) Near TungSha Island Eiw = 13 ! EGM. Strong
nonlinear and high-harmonic tides are present. Repetitive trains of large-amplitude NIW appear primarily at a semidiurnal periodicity with their amplitudes modulated at a fortnightly tidal cycle. The rms vertical velocity of NIW shows a clear spring-neap tidal cycle and is linearly proportional to the barotropic tidal height in Luzon Strait with a 1.85-day time lag, consistent with the travel time of internal tides from Luzon Strait to TungSha Island. (3) At the northern SCS shelfbreak Eiw = 4 ! EGM. Single
depression waves are found, but no multiple-waves packets are evident. (4) On the continental shelf Eiw = 2 ! EGM.
Both depression and elevation NIW exist. Citation: Lien, R.-C., T. Y. Tang, M. H. Chang, and E. A. D’Asaro (2005), Energy of nonlinear internal waves in the South China Sea, Geophys. Res. Lett., 32, L05615, doi:10.1029/2004GL022012.
1. Introduction
[2] Hsu and Liu [2000] and Zhao et al. [2004] collected
satellite images between 1993 and 2001 in the SCS to reveal the distribution of NIW (Figure 1). Most of the long-crested, multiple-wave packets exist in a 200! 200 km2area on the continental slope and shelf centering around TungSha Island. A single long-crested, multiple-wave packet was observed at the west of Luzon Strait on 16 June 1995. In the deep basin of the SCS, only a few short-crest wave trains and single-depression waves exist. Recent in situ measurements confirm the presence of NIW identified by satellite images [Ramp et al., 2004; Yang et al., 2004].
[3] The generation mechanism for NIW in the SCS
remains controversial. Two hypotheses have been proposed: the lee wave model and the nonlinear internal tide model (Figure 2) [Apel et al., 1997]. According to the former lee waves are generated between the Batan Islands in Luzon
Strait (Figure 1) [Niwa and Hibiya, 2004]. They propagate across the SCS in a narrow tidal beam, are amplified by the shoaling continental slope, become nonlinear, and evolve into NIW (Figure 2b). During very strong barotropic tidal forcing events in Luzon Strait, internal tides could be strongly nonlinear near their generation sites so that NIW would evolve immediately (Figure 2c).
2. Observations
[4] In April 2000 three 150-kHz broadband ADCP
moor-ings (L2, IW1, and IW3) and one 300-kHz narrowband bottom ADCP (IW2) were deployed in the SCS (Figures 1 and 2); they collected data for"20 days. All ADCPs were upward-looking and recorded 1-min averages. The water depths at stations L2, IW1, IW3, and IW2 were 2080 m, 426 m, 468 m, and 110 m, respectively. The mooring ADCPs were mounted at a nominal depth of 237 m. 2.1. Internal Wave Characteristics
[5] Internal waves observed in four locations within the
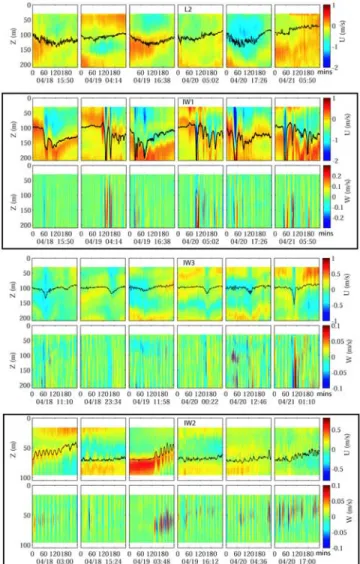
SCS have different characteristics. Segments of 4-hr time series for six consecutive semidiurnal periods illustrate these differences (Figure 3).
[6] The L2 mooring was located on a submarine ridge in
Luzon Strait. ADCP observations were available between 30 and 220 m depths. We compute the stream function as ! =R dz(u# C), where a wave speed C = 1.8 m s#1is used [Yang et al., 2004]. The zonal velocity between the sea surface and 30 m depth is assumed equal to u(30m). The streamline shows high-frequency variations riding on a low-frequency tidal bore, but no NIW are evident. This is the first in situ evidence showing the absence of NIW near Luzon Strait. The vertical velocity measurements at L2 were contaminated by instrument noise and are not shown.
[7] At mooring IW1 large NIW were observed at a
semidiurnal period. The leading waves had a vertical displacement of 70 – 120 m and a wave period of 10 – 20 min corresponding to a 1 – 2-km width. During the waves’ passage, the zonal current in the upper layer fluctu-ated in alternating directions. The maximum westward current was >1 m s#1. The vertical velocity at IW1 showed the unambiguous first-mode depression wave structure, with maximum speed at mid-depth, and downwelling followed by upwelling. The vertical velocity reached 0.2 m s#1. NIW at IW1 were the strongest among our observations, as was expected from satellite images and numerical model results of internal tides (Figure 1).
[8] At mooring IW3, located north of the internal tidal
beam, only single depression waves were observed. The largest depression wave was at 0300 on 21 April. The zonal
1Applied Physics Laboratory, University of Washington, Seattle,
Washington, USA.
2Institute of Oceanography, National Taiwan University, Taipei,
Taiwan.
Copyright 2005 by the American Geophysical Union. 0094-8276/05/2004GL022012$05.00
velocity of the wave was "0.5 m s#1, less than 1/2 of that observed at IW1.
[9] Mooring IW2 was located on the continental shelf. A
westward wave speed of 0.8 m s#1was used to compute the stream function, determined by matching the observed vertical velocity with the prediction from the stream func-tion. Two trains of elevation waves were identified at 0300 on 18 April and 0548 on 19 April. Elevation waves have leading upwelling followed by downwelling, best observed for the wave train 0548 on 19 April.
2.2. Internal Wave Spectra
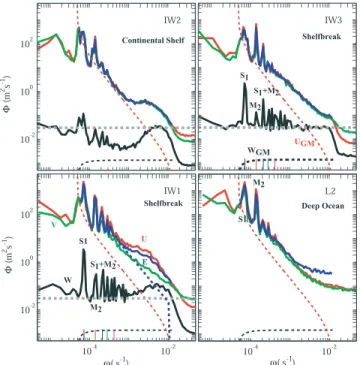
[10] Velocity spectra are computed and WKB-normalized
at each depth. Spectra are averaged over the upper 100 m
and compared with the modified GM79 spectra [Levine, 2002] (Figure 4). Potential energy spectra are estimated using observed vertical velocity spectra and the linear internal wave relation (4). The total energy spectrum (FE),
horizontal velocity spectrum (Fu), vertical velocity
spec-trum (Fw), and potential energy spectrum (FPE) of GM79
are expressed as follows,
FE¼ Et N N0 Bð Þw ð1Þ Fw¼ Et w2 # f2 ð ÞN N2# f2 ð ÞN0 Bð Þw ð2Þ Fu¼ 1 2 N2# w2 ð Þ wð 2þ f2Þ w2# f2 ð Þw2 Fw ð3Þ
Figure 1. Map of South China Sea and positions of ADCP stations (blue dots). Black contours are 200, 500, 1000, 2000, and 3000-m isobaths. Red vectors are model results of depth-integrated semidiurnal internal tidal energy flux produced by Niwa and Hibiya [2004]. Green curves are internal wave packets derived from satellite images by Zhao et al. [2004]. Solid green curves indicate multiple-wave packets and dashed green curves single-wave packets. Thick solid green curves west of Luzon Strait represent the big wave event observed on 16 June 1995.
Figure 2. Sketch of generation mechanisms for NIW in the SCS: (a) lee wave model, (b) nonlinear internal tide model, and (c) very strong nonlinear internal tide model. The shading is the bathymetry across the South China Sea. The inset (d) shows the mooring ADCP configuration. Blue dots indicate locations of ADCP measurements.
Figure 3. Zonal velocity and vertical velocity contours in 4-hr time segments for six consecutive semidiurnal periods. Each segment is separated by a semidiurnal period of 12.4 hr. The vertical velocity at L2 is not shown because it is contaminated by instrument noise. The beginning time for each time segment is shown on the lower line of the x-axis; upper line shows minutes elapsed from the beginning time. The black curve shows the streamline beginning at 100 m depth, assuming a westward wave speed of 1.8 m s#1 for L2, IW1, and IW3, and 0.8 m s#1for IW2.
FPE ¼ 1 2 N2 w2Fw; ð4Þ where B(w) = 2f
pw wð 2# f2Þ1=2,w is frequency, N the buoyancy
frequency, and f the inertial frequency. Et= 2.9 mJ kg#1is
the total energy per unit mass. N0 = 0.0052 s#1 is a
reference buoyancy frequency.
[11] At mooring L2 horizontal velocity spectra show
diurnal and semidiurnal peaks and a w#2 spectral slope until they meet the noise floor at "0.003 s#1. The total internal wave energy Eiwis 10 ! EGM, where EGM is the
total energy of GM79 (Table 1).
[12] At mooring IW1 observed spectra exhibit peaks at
diurnal, semidiurnal, compound tides, and higher tidal
IW1 but of weaker magnitudes. Beyond the tidal harmonics, FuandFvhave a spectral slope slightly flatter than#2 and
Fwis white below N. Eiwis 4! EGM, and Wiw2 is 25! WGM2 .
Fundamental differences from IW1 are the absence of the near-N spectral bump at IW3, and Eiwand Wiw2 at IW3 < 1/2
of those at IW1.
[14] At mooring IW2 all velocity spectra show the
diurnal and semidiurnal peaks and a near-N bump associ-ated with NIW. Eiwis 2! EGM, and Wiw2 is 15! WGM2 .
3. NIW Energy and Tidal Forcing
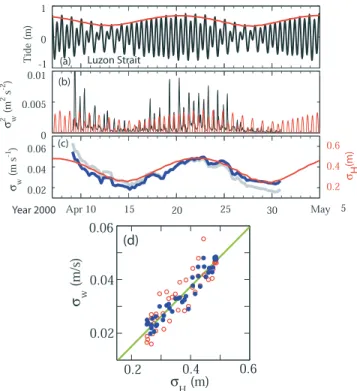
[15] NIW contain more than 80% of the vertical energy in
the internal wave band (Table 1). The vertical velocity variances at IW1, computed in 1-hr intervals, show a semidiurnal periodicity (Figure 5b). The barotropic tidal height in Luzon Strait, computed using Oregon Tidal Inversion Software (OTIS) [Egbert and Erofeeva, 2002] is also dominated by the semidiurnal tide (Figure 5a). Both variables show a fortnightly modulation and are correlated with the tide forward shifted by a 1.85-day time lag (Figure 5c). Considering the 1.85-day lag as the travel time, the speed of the semidiurnal internal tide should be 1.88 – 2.20 m s#1. The correlation between the rms tidal amplitude in Luzon Strait (sH) and the rms vertical velocity at IW1
(sw) is 0.89 and the linear regression fit (Figure 5d) yields
swðm=sÞ ¼ 0:11sHð Þ # 0:01 m=sm ð Þ: ð5Þ
This relation provides a simple model to predict the energy of NIW near TungSha Island based on the barotropic tide at Luzon Strait. The correlation increases to 0.96 and the linear regression fit is improved if the linear trend of sw is
removed (Figures 5c and 5d).
4. Discussion and Summary
4.1. Generation Mechanisms
[16] Observed internal wave properties combined with a
composite map of NIW from satellite images and results
Table 1. Characterization of Energy Measurements at Four Stations in the SCS Averaged in the Upper 100 m: Wiw
2
, Vertical Kinetic Energy in the Internal Wave Band; Eiw, Total Internal Wave Energy; W2 iw W2 GM , the Ratio of Wiw 2 to GM Vertical Kinetic Energy WGM2 ;EEiw
GM, the Ratio of Eiwto GM Total Energy EGM; WNIW 2
, the Vertical Kinetic Energy in the High-Frequency Regime (10#3s#1 <w < N); ENIW, the Total Energy in the High-Frequency Regime; %WNIW2 , the Percentage of WNIW2 in Wiw2; and %ENIW, the Percentage of ENIWin Eiw
Stn Wiw2 ðcm 2 s2Þ Eiwðcm 2 s2Þ W2 iw W2 GM Eiw EGM WNIW2 ðcm 2 s2Þ ENIWðcm 2 s2Þ %WNIW2 (%) %ENIW(%) L2 NA 546 NA 10.2 NA NA NA 10 IW1 4.5 576 53.5 12.9 4 92 89 16 IW3 2.1 243 24.8 4.3 1.7 26 81 11 IW2 1.3 140 14.7 2.4 1.2 20 93 14
Figure 4. Average velocity and energy spectra. Spectra are WKB-normalized and averaged over the upper 100 m. Red, green, and black curves represent zonal, meridional, and vertical velocity spectra, respectively. Blue curves are total energy spectra. Black and red dashed curves are GM79 vertical and horizontal velocity spectra. The thick dashed gray lines represent the observed vertical velocity spectrum at IW3 averaged in 0.001 s#1<w < N, plotted for reference. Frequencies of diurnal tide S1, semidiurnal tide M2, and the
compound tide, M2+ S1, are labeled. The dashed blue curve
in the panel of IW1 represents the background high-frequency internal wave spectrum.
of numerical internal tide models supports the hypothesis that the nonlinear internal tide is the primary generation mechanism for NIW observed in the SCS (Figure 2b). Strong internal tides are generated in Luzon Strait. They propagate into the SCS in a narrow tidal beam (Figure 1). They are amplified by the shoaling continental slope near TungSha, become nonlinear, and evolve into NIW (Figures 3 and 4). Observed NIW are not evolved from escaping lee waves (Figure 2a) because they were not observed at L2. Within the internal tidal beam (e.g., IW1), NIW evolve primarily from the amplification of the trans-basin internal tides. Outside of the internal tidal beam (e.g., IW3), NIW may evolve from the locally generated internal tides. Considering the short period of observations at L2, we cannot exclude the possibility of NIW generated via the lee wave model in other parts of Luzon Strait under different oceanic conditions. Further observations are needed.
4.2. Big Wave Near Luzon Strait
[17] A long-crested NIW west of Luzon Strait was
captured by satellite on 16 June 1995 [Hsu and Liu,
2000]. During this event the barotropic tidal current in Luzon Strait was one of the strongest of 1995 according to the prediction by OTIS. We propose that this large wave near Luzon Strait was generated by very strong nonlinear internal tides (Figure 2c). These events occur only a few days each year. The chance is small for satellite images to capture these events; there has been only one captured in the "10-yr satellite record.
4.3. Energy Conversion and Dissipation of NIW [18] At mooring IW1 the total energy in the
high-frequency regime (10#3s#1<w < N) is "16% of the total internal wave energy (Table 1). The total energy of high-frequency internal waves that are not NIW is computed by integrating the background internal wave spectrum, extrap-olating aw#2slope from the observed spectrum at 10#3s#1 to N (blue dashed curve in Figure 4). It is"3% of the total internal wave energy. Therefore, the energy conversion rate from internal tides to NIW is "13%. Niwa and Hibiya [2004] report an internal tidal energy flux of 4.2 GW into the SCS (Figure 1). Applying a 13% conversion rate, NIW contain an energy flux of 0.54 GW. If all NIW dissipate within the 200! 200 km2area centered at TungSha Island in the 1 – 10-m thick interface, the turbulence kinetic energy dissipation rate e associated with breaking NIW would be "10#6– 10#5 W kg#1 and the eddy diffusivity Kr= 0.2eN#2="10#3– 10#2m2s#1, at least 100 times that
in a typical oceanic thermocline. 4.4. Prediction of NIW in SCS
[19] The energy content of NIW depends on 1) the
conversion rate from the barotropic to internal tides, 2) the conversion rate from internal tides to NIW, 3) the tidal beam properties, and 4) the dissipation of NIW. These processes are modulated by the barotropic tides, by the background shear and stratification associated with Kuroshio, mesoscale eddies, and by the surface wind and buoyancy forcing in the SCS. The simple relation (5) includes only one of many important parameters. It is successful because other param-eters are nearly invariant in a "20-day time scale, and at mooring IW1 internal tides generated remotely in Luzon Strait dominate those generated locally. The linear trend of sw (Figure 5c) represents the effects of processes
over-looked by (5). Further observations and numerical models are needed to improve our understanding of the details of these processes, and to improve the prediction of NIW.
[20] Acknowledgments. We thank Drs. Niwa and Hibiya for provid-ing their model results. Discussions with Drs. Wen-Ssn Chuang, Matthew Alford, Yiing Jang Yang, and Zhongxiang Zhao were very helpful. This work is supported by the Office of Naval Research and the National Science Council of Taiwan.
References
Apel, J. R., et al. (1997), An overview of the 1995 SWARM Shallow-Water Internal Wave Acoustic Scattering Experiment, IEEE J. Oceanic Eng., 22, 465 – 500.
Egbert, G. D., and S. Y. Erofeeva (2002), Efficient inverse modeling of barotropic ocean tides, J. Atmos. Oceanic Technol., 19, 183 – 204. Hsu, M.-K., and A. K. Liu (2000), Nonlinear internal waves in the South
China Sea, Can. J. Remote Sens., 26, 72 – 81.
Levine, M. (2002), A modification of the Garrett-Munk internal wave spectrum, J. Phys. Oceanogr., 32, 3166 – 3181.
Niwa, Y., and T. Hibiya (2004), Three-dimensional numerical simulation of M2internal tides in the East China Sea, J. Geophys. Res., 109, C04027,
doi:10.1029/2003JC001923.
Figure 5. Time series of (a) the barotropic tide east of Luzon Strait HLS(black curve) and the 1.7! the rms tidal
amplitude computed in 24-hr intervals sHLS (red curve);
(b) the vertical velocity variance computed in 1-hr intervals sw
2
(black curve), and the 1.85-day forward shifted HLS
(red curve); (c) the rms vertical velocity sw computed in
24-hr intervals (gray curve) and the 1.85-day forward shifted sHLS (red curve). The blue curve in (c) is the
detrendedsw. (d) Scatter plot between 1.85-day shiftedsHLS
andsw(red circles), and between 1.85-day shiftedsHLSand
detrended sw (blue dots). The green line represents the
linear regression fit to the detrended sw and 1.85-day