Electrochemical Deposition of Bis(N,N
′
-diphenylaminoaryl)
Substituted Ferrocenes, and Their Application as a Hole-Injection
Layer on Polymeric Light-Emitting Diodes
Chao Cheng Chiang,† Hong-Chun Chen,† Chin-sheng Lee,† Man-kit Leung,*,†,‡
Kun-Rung Lin,‡and Kuo-Huang Hsieh‡
Department of Chemistry and Institute of Polymer Science and Engineering, National Taiwan UniVersity, 1 RooseVelt Road, Section 4, Taipei 106, Taiwan, ROC
ReceiVed August 7, 2007. ReVised Manuscript ReceiVed October 30, 2007
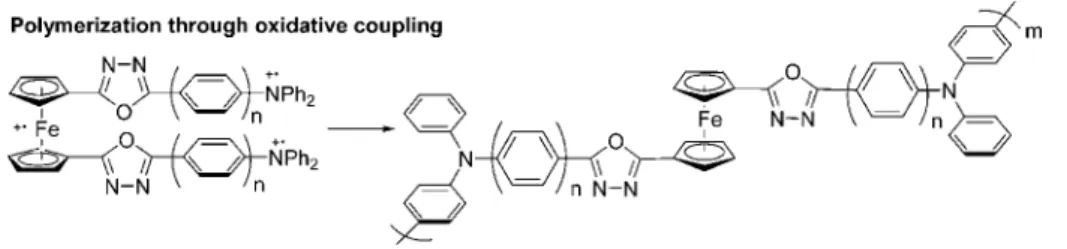
The synthesis, spectro-electrochemical study, and electrochemical polymerization of bis(diphenylamino) substituted ferrocenes (Fcs), including the family of the 1,3,4-oxadiazole (OXD) bridged 1,1′ -[p-(Ph2N)(C6H4)nOXD]2Fc and the vinylene bridged ferrocene 1,1′-[p-(Ph2N)(C6H4)-(E)-CHdCH]2Fc, have been carried out. The ferrocene compounds underwent three stepwise one-electron oxidations to form the (3+) radical cations that further electrochemically polymerized on a Pt or an indium tin oxide (ITO) electrode surface. The polymeric layers showed extremely good hole-injection properties. The polymeric light emitting devices (PLEDs) of ITO/ED-1,1′-[Ph2N(C6H4)3OXD]2Fc/PVK:Ir(PPy)3:PBD/Mg-Ag showed a turn-on voltage (at 100 cd/m2) of 11 V, with a maximum brightness of 27 700 cd/m2. The turn-on voltage was 1.5 V lower than that of the poly(3,4-ethylenedioxythiophene)poly(styrenesulfonate) based PLED and 2 V lower than the corresponding electrochemically deposited poly(4-(N,N-diphenylami-no)styrene) based PLED.
Introduction
Considerable efforts have been paid to the development of new electroactive polymers.1These materials can be used in organic electronic devices,2sensors,3polymer batteries,4 electrochromic devices,5or polymeric light emitting diodes.6 Conjugated polymers containing organometallic complexes or coordination complexes in the backbone or on the side chains are of particular interest because many metal contain-ing cores could be reversibly switched between the redox states.7By varying the redox states of the metal core, the conductivity, optical properties, and electronic behavior of the conjugated polymers could be modulated. Ferrocene is a well-known electrochemically active compound which
shows good electron-transfer properties.8 Incorporation of ferrocene units into polymers has therefore attracted a lot of attention.9 In addition, as a result of the substituent effect on the oxidation potential of the ferrocene, the highest occupied and the lowest unoccupied molecular orbital levels of the ferrocene could therefore be tuned by varying the substituent attached to the cyclopentadienyl rings.10 This provides a wide window for tuning and matching the energy levels with different types of electronic materials in multi-layer organic optoelectronic devices.
Electrochemical coupling is an established technique for the preparation of polymeric film on the conducting elec-trodes. Many heterocyclic moieties including thiophene, pyrrole, arylamine, and carbazole are active toward the coupling conditions and have been used as the handle for electrochemical polymerization.11 For example, Zhu and Wolf have reported the study of oligothienylferrocene 1.12 Constable and Hagfeldt et al. have prepared a rodlike * Corresponding author. E-mail: [email protected].
†Department of Chemistry.
‡Institute of Polymer Science and Engineering.
(1) Vinogradov, A.; Su, J.; Jenkins, C.; Bar-Cohen, Y. Mater. Res. Soc. Symp. Proc. 2006, 889, 51.
(2) (a) Chidsey, C. E. D.; Murray, R. W. Science 1986, 231, 25. (b) Garnier, F.; Hajlaoui, R.; Yassar, A.; Srivastava, P. Science 1994, 265, 1684. (c) Wrighton, M. S. Science 1986, 231, 32.
(3) (a) Thackeray, J. W.; White, H. S.; Wrighton, M. S. J. Phys. Chem.
1985, 89, 5133. (b) Fortier, G.; Brassard, E.; Belanger, D. Biosens.
Bioelectron. 1990, 473. (c) Bartlett, P. N.; Whithaker, R. G. J. Electroanal. Chem. 1987, 224, 27.
(4) Novak, P.; Muller, K.; Santhanam, K. S. V.; Haas, O. Chem. ReV.
1997, 97, 207.
(5) (a) Walczak, R. M.; Reynolds, J. R. AdV. Mater. 2006, 18, 1121. (b) Sonmez, G.; Sonmez, H. B.; Shen, C. K. F.; Wudl, F. AdV. Mater.
2004, 16, 1905.
(6) (a) Jungermann, S.; Riegel, N.; Müller, D.; Meerholz, K.; Nuyken, O. Macromolecules 2006, 39, 8911. (b) Deng, L.; Furuta, P. T.; Garon, S.; Li, J.; Kavulak, D.; Thompson, M. E.; Fréchet, J. M. J. Chem. Mater. 2006, 18, 386.
(7) Kaufman, F. B.; Schroeder, A. H.; Engler, E. M.; Kramer, S. R.; Chambers, J. Q. J. Am. Chem. Soc. 1980, 102, 483.
(8) (a) Kurihara, M.; Kubo, K.; Horikoshi, T.; Kurosawa, M.; Nankawa, T.; Matsuda, T.; Nishihara, H. Macromol. Symp. 2000, 156. (b) Kurihara, M.; Nishihara, H. Coord. Chem. ReV. 2002, 226, 25. (9) (a) Abd-El-Aziz, A. S.; Manners, I. J. Inorg. Organomet. Polym. 2005,
15, 157. (b) Hudson, R. D. A. J. Organomet. Chem. 2001, 637–639, 47–69. (c) Wong, W. Y.; Wong, W. K.; Raithby, P. R. J. Chem. Soc., Dalton Trans. 1998, 2761.
(10) Hennig, H.; Guertler, O. J. Organomet. Chem. 1968, 11, 307. (11) (a) Roncali, J. J. Mater. Chem. 1999, 9, 1875; Chem. ReV. 1992, 92,
71138. (b) Sabouraud, G.; Sadki, S.; Brodie, N. Chem. Soc. ReV. 2000, 29, 283. (c) Wolf, M. O.; Zhu, Y. AdV. Mater. 2000, 12, 599. (d) Natera, J.; Otero, L.; Sereno, L.; Fungo, F.; Wang, N.-S.; Tsai, Y.-M.; Hwu, T.-Y.; Wong, K.-T. Macromolecules 2007, 40, 4456. (e) Turbiez, M.; Frere, P.; Allain, M.; Gallego-Planas, N.; Roncali, J. Macromolecules
2005, 38, 6806. (f) Bueschel, M.; Ajayaghosh, A.; Eldo, J.; Daub, J.
Macromolecules 2002, 35, 8405. (g) Deng, S.; Advincula, R. C. Chem. Mater. 2002, 14, 4073. (h) Hay, C.; Fischmeister, C.; Hissler, M.; Toupet, L.; Reau, R. Angew. Chem., Int. Ed 2000, 39, 1812.
10.1021/cm702217u CCC: $40.75 2008 American Chemical Society Published on Web 12/22/2007
Downloaded by NATIONAL TAIWAN UNIV on July 29, 2009
polymer containing Ru(terpy)2units by the electrochemical coupling of 2.13 Balch et al. adopted the approach of reductive coupling using C60-Pd as the active components to prepare the ferrocene-containing thin film from 3.14
Triphenylamine (4) and its derivatives are known hole-transport materials that played important roles in organic light emitting devices as well as in organic electronics.15Recently, we have been interested in using triarylamine derivatives as handles for electropolymerization.16 4 is an electron-rich
compound that could be oxidized to form the radical cation
5 (Scheme 1). The radical cation is reactive and dimerizes
to form 4,4′-bis(N,N-diphenylamino)biphenyl (6). Although
6 could also be oxidized to form the radical cation 7, the
oxidative coupling of the radical cations is relatively sluggish because of the resonance stabilization.17 Therefore, only oligomers would be obtained even when electropolymeriza-tion of 4 was carried out at a high concentraelectropolymeriza-tion.18
Interestingly, the resonance stabilization could be blocked by inserting an electron-deficient group in between the triphenylamine units.16b In this situation, the chemical reactivity of the terminal triphenylamine units could therefore be resumed and the electropolymerization would occur effectively even in a diluted solution (Scheme 2).
Herein, we integrated the ferrocene and the triphenylamine moieties to form new families of electrochemically active materials. We were interested in understanding the
elec-tropolymerization behavior of the two types of ferrocene derivatives 8-10 and 11.
In the first type of ferrocene compounds, the ferrocene cores of 8–10 were separated from the electron-rich triphenylamine moieties by electron-deficient oxadiazole units. On the other hand, the ferrocene core of 11 was conjugatively linked to the triphenylamine moieties by two olefinic bridges. In addition, the possibility of using the electrochemically deposited thin films as the hole-injection layer (HIL) for the polymeric light emitting diodes was investigated.
Results and Discussion
Preparation of the Target Ferrocene Derivatives 8– 11. The starting ferrocenedicarboxylate dimethyl ester 12 was
prepared from the esterification of the commercially available 1,1′-ferrocenedicarboxylic acid in MeOH using concentrated sulfuric acid as the catalyst.19 The treatment of 12 with NH2NH2· H2O in toluene-ethanol at the reflux temperature afforded the carbohydrazide intermediate that was further reacted with benzoyl chloride to give 13 in a high yield (Scheme 3).20 Compound 14 was obtained smoothly from
12 under similar reaction conditions. However, we faced
difficulty in the subsequent step of the dehydrative ring-closure reaction. The common cyclization-dehydration of the hydrazide precursors using POCl3 as the dehydrating agent was unsuccessful, resulting in an unidentified product that was highly insoluble in organic solvents. Another approach of oxadiazole formation through intermolecular condensation of 5-(4-bromophenyl)-1H-tetrazole21with 1,1′ -(12) Zhu, Y.; Wolf, M. O. Chem. Mater. 1999, 11, 2995.
(13) Hjeim, J.; Constable, E. C.; Figgemeier, E.; Hagfeldt, A.; Handel, R.; Housecroft, C. E.; Mukhtar, E.; Schofield, E. Chem. Commun. 2002, 284.
(14) Plonsk, M. E.; de Bettencourt-Dias, A; Balch, A. L.; Winkler, K. Chem. Mater. 2003, 15, 4122.
(15) (a) Shirota, Y. J. Mater. Chem. 2005, 15, 75. (b) Shirota, Y. J. Mater. Chem. 2000, 10, 1.
(16) (a) Chou, M.-Y.; Leung, M.-k.; Su, Y. O.; Chiang, C. L.; Lin, C.-C.; Liu, J.-H.; Kuo, C.-K.; Mou, C.-Y. Chem. Mater. 2004, 16, 654. (b) Leung, M.-k.; Chou, M.-Y.; Su, Y. O.; Chiang, C. L.; Chen, H.-L.; Yang, C. F.; Yang, C.-C.; Lin, C.-C; Chen, H.-T. Org. Lett. 2003, 5, 839.
(17) Seo, E. T.; Nelson, R. F.; Fritsch, J. M.; Marcoux, L. S.; Leedy, D. W.; Adams, R. N. J. Am. Chem. Soc. 1966, 88, 3498.
(18) (a) Petr, A.; Kvarnstr¨om, C.; Dunsch, L; Ivaska, A. Synth. Met. 2000, 108, 245. (b) Lambert, C.; Nöll, G. Synth. Met. 2003, 139, 57.
(19) (a) Anderson, J. C.; White, C.; Stenson, K. P. Synlett 2002, 1511. (b) Pagel, K.; Werner, A.; Friedrichsen, W. J. Organomet. Chem. 1994, 481, 109.
(20) (a) Li, M.; Cai, P.; Duan, C.; Lu, F.; Xie, J.; Meng, Q. Inorg. Chem.
2004, 43, 5174.
(21) Schmidt, B.; Meid, D.; Kieser, D. Tetrahedron 2007, 63, 492. Scheme 1. Oxidative Coupling of Triphenylamine Scheme 2. Electropolymerization of Bis-diphenylamino
Substituted Compounds
Downloaded by NATIONAL TAIWAN UNIV on July 29, 2009
bis(chlorocarbonyl)ferrocene22was also unsuccessful, giving rise only to an insoluble black solid. Finally, we discovered that 2-chloro-1,3-dimethylimidazolinium chloride23was an effective reagent to convert 13 and 14, respectively, to 1524 and 16 in high yields. However, the purification procedure was relatively tricky. The product needed to be first prepu-rified by liquid column chromatography on silica gel, using EtOAc/CH2Cl2as the eluent. The product collected some-times contained small amounts of 1,3-dimethylimidazolidin-2-one, the byproduct from the reaction, as the impurity. Fortunately, this polar byproduct could be washed away with MeOH to give essentially pure 15 and 16.
Amination of 16 under the Buchwald-Hartwig condi-tions25led to 8 in high yield (Scheme 4). On the other hand, Suzuki coupling26of 16 with the corresponding boronic acids led to 9, 10, and 17 in moderate to high yields.
We have also prepared 21–23 from 18 on the basis of similar synthetic strategies that are shown in Scheme 5. Compounds 21–23 contained only one triarylamine sidearm and one ferrocene unit. Their electrochemical behaviors were less complicated than those of the target molecules and were
used as references in the later voltammetric and spectro-electrochemical studies.
The synthesis of 11 was started from 2427 (Scheme 6). The Horner-Wadsworth-Emmons reaction28of 24 with 25 under basic conditions provided 26. Only the trans isomer was isolated from the reaction. The geometry of the olefinic bond was confirmed by the large J3
coupling constant of 16 Hz. The (n-Bu)3Sn substituted compound 26 was then lithiated through a lithium-tin exchange, followed by the reaction with dimethylformamide (DMF) to give the alde-hyde 27. By repeating the Horner-Wadworth-Emmons reaction, 27 was transformed to 11. It is interesting that 26 was relatively unstable and was partially hydrolyzed on a silica gel during liquid chromatography to give 28. The trans structure of 28 was further confirmed by X-ray crystal-lographic analysis.
Single Crystal X-Ray Crystallographic Analyses of 10, 16, and 28. Single crystals of 10, 16, and 28 were
prepared by the slow evaporation of the solvents. The constitution of 28, which was obtained by destannylation of (22) Gonzalez, B.; Alonso, B.; Losada, J.; Garcia-Armada, M. P.; Casado,
C. M. Organometallics 2006, 25, 3558.
(23) Isobe, T.; Ishikawa, T. J. Org. Chem. 1999, 64, 6984.
(24) Lorkowski, H. J.; Pannier, R.; Wende, A. J. Prakt. Chem. 1967, 35 (3–4), 149.
(25) (a) Hartwig, J. F. Synlett 1997, 2046. (b) Hartwig, J. F. Angew. Chem., Int. Ed. 1998, 37, 329. (c) Wolfe, J. P.; Wagaw, S.; Marcoux, J.-F.; Buchwald, S. L. Acc. Chem. Res. 1998, 31, 805. (d) Yang, B. H.; Buchwald, S. L. J. Organomet. Chem. 1999, 576, 125. (e) Wolfe, J. P.; Wagaw, S.; Buchwald, S. L. J. Am. Chem. Soc. 1996, 118, 7215. (f) Wolfe, J. P.; Buchwald, S. L. Tetrahedron Lett. 1997, 38, 6359. (g) Wolfe, J. P.; Buchwald, S. L. J. Org. Chem. 2000, 65, 1144. (26) Bellina, F.; Carpita, A.; Rossi, R. Synthesis 2004, 15, 2419.
(27) (a) Sammakia, T.; Latham, H. A. J. Org. Chem. 1996, 61, 1629. (b) Roberts, R. M. G.; Silver, J.; Azizian, J. J. Organomet. Chem. 1986, 303, 387. (c) Wright, M. E. Organometallics 1990, 9, 853. (d) Nakamura, S.; Fukuzumi, T.; Toru, T. Chirality 2003, 16, 10. (e) Bolm, C.; Hermanns, N.; Classen, A.; Muniz, K. Bioorg. Med. Chem. Lett.
2002, 12, 1795.
(28) Motoyoshiya, J. Trends Org. Chem. 1998, 7, 63. Scheme 3. Synthesis of 15 and 16
Scheme 4. Synthesis of 9, 10, and 17
Scheme 5. Synthesis of 21-23
Scheme 6. Synthesis of 11 and 28
Downloaded by NATIONAL TAIWAN UNIV on July 29, 2009
26 on silica gel, has been verified by X-ray crystallographic
analysis, and the C-C and C-Fe bond lengths of the ferrocene units are summarized in Tables 1 and 2.
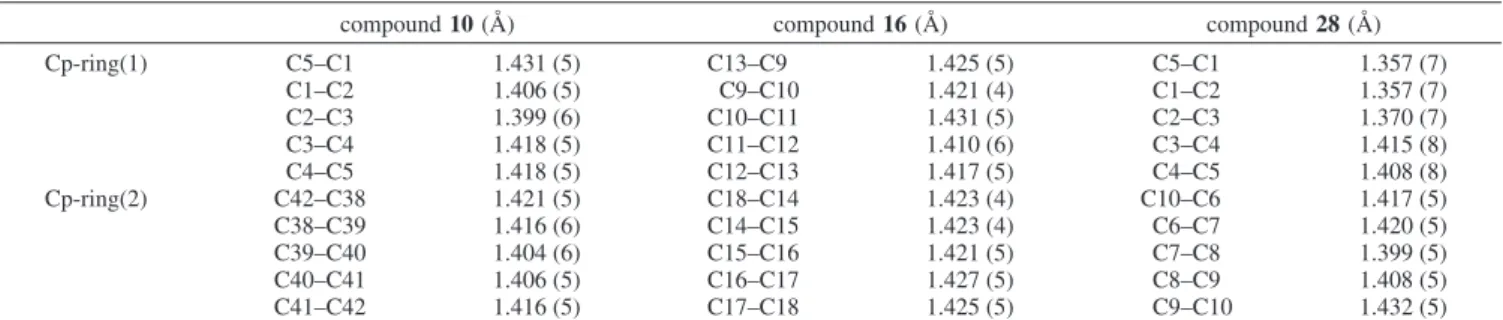
The single crystal of 28 was P1j with Z – 2, R(Fo) ) 0.0562 (I > 2σ(I)) and R(Fo) ) 0.140 (all data). The substituent effects were reflected on the C–C bond lengths of the cyclopentadienyl (Cp) ring that were unevenly distributed. The bond lengths of 1.357 Å, 1.357 Å, and 1.370 Å for C1–C2, C1–C5, and C2–C3, respectively, were relatively short in comparison to those of 1.415 Å and 1.408 Å for C3–C4 and C4–C5, respectively. On the other hand, the Fe–C bond distances of 2.019, 2.020, and 2.027 for C3, C4, and C5 were shorter than those of 2.038 and 2.040 for C1 and C2, respectively. These observations suggested that the chemical bonding interactions between the Fe atom and the
π-array of C3–C5 were relatively strong and desymmetrized
the ferrocene group. The Fe atom was located away from the center of the Cp ring and was placed closer to C3–C5. On the other hand, the carbon–carbon bond of C9–C10 was relatively long. The bond length of 1.432(5) was recorded while the other four C–C bonds were 1.399 Å, 1.408 Å, 1.417 Å, and 1.420 Å, respectively. The average C–C bond length of the two Cp rings was 1.398 ( 0.027 Å.
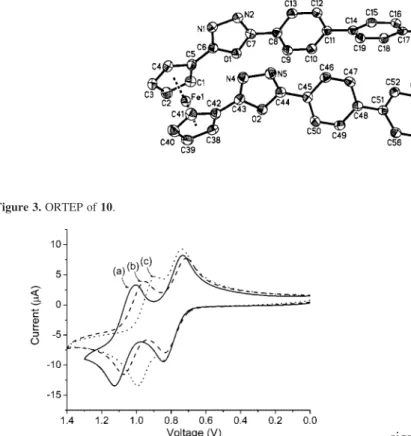
The structures of the other two oxadiazole substituted ferrocenes were somewhat different from those of 28 (Figure 1). The single crystal of 10 was P21/c with Z ) 4, R(Fo) ) 0.0631 (I > 2σ(I)) and R(Fo) ) 0.1344 (all data). The single crystal of 16 was P21/n with Z ) 4, R(Fo) ) 0.0389 (I > 2σ(I)) and R(Fo) ) 0.062 (all data). In spite of the unevenly distributed Cp C–C bond length of 28, the Cp C–C bond lengths of 10 and 16 were relatively homogeneous. The average C–C bond lengths for 10 and 16 were 1.414 ( 0.009 Å and 1.422 ( 0.006 Å, respectively. The C–C average bond length was slightly larger than that of ferrocene, in which the C–C bond distance of interest was 1.389 Å.29
Noteworthy are the almost eclipsed conformations of the Cp rings and their nearly coplanarπ-orbital alignment with
the vinyl group of 28 and with the oxadiazole rings of 10 (Figure 2) and 16 (Figure 3). According to the analysis of
28,thedihedralangleof8.4°wasmeasuredforC6–C10–C11–C12. On the other hand, the dihedral angles of 11.0° and 18.7° for C13–C9–C8–O1 and C14–C18–C19–O2 of 16 as well as the dihedral angles of 20.6°and 25.8°for C1–C5–C6–O1 and C38–C42–C43–O2 of 10, respectively, were recorded. The nearly coplanar arrangements would allow a strong
π-conjugation between the Cp rings of the ferrocene (Fc)
unit and the substituents. The redox behavior of the Fc core would therefore be significantly modulated by the electronic
(29) (a) Hughes, R. P.; Kowalski, A. S.; Lomprey, J. R.; Rheingold, A. L. Organometallics 1994, 13, 2691. (b) Steudel, R.; Hassenberg, K.; Pickardt, J. Organometallics 2002, 21, 2604.
Table 1. Fe-C Bond Lengths of the Ferrocene Moieties of 10, 16, and 28
compound 10 (Å) compound 16 (Å) compound 28 (Å)
Cp-ring(1) Fe–C1 2.047 (4) Fe–C9 2.041 Fe–C1 2.038
Fe–C2 2.037 (4) Fe–C10 2.022 Fe–C2 2.040
Fe–C3 2.043 (4) Fe–C11 2.036 Fe–C3 2.027
Fe–C4 2.040 (4) Fe–C12 2.051 Fe–C4 2.020
Fe–C5 2.038 (3) Fe–C13 2.056 Fe–C5 2.019
Cp-ring(2) Fe–C38 2.059 (4) Fe–C14 2.051 Fe–C6 2.050
Fe–C39 2.034 (4) Fe–C15 2.047 Fe–C7 2.044
Fe–C40 2.025 (5) Fe–C16 2.041 Fe–C8 2.032
Fe–C41 2.024 (4) Fe–C17 2.034 Fe–C9 2.030
Fe–C42 2.034 (4) Fe–C18 2.044 Fe–C10 2.059
Table 2. C–C Bond Lengths of the Cp Rings of 10, 16, and 28
compound 10 (Å) compound 16 (Å) compound 28 (Å)
Cp-ring(1) C5–C1 1.431 (5) C13–C9 1.425 (5) C5–C1 1.357 (7) C1–C2 1.406 (5) C9–C10 1.421 (4) C1–C2 1.357 (7) C2–C3 1.399 (6) C10–C11 1.431 (5) C2–C3 1.370 (7) C3–C4 1.418 (5) C11–C12 1.410 (6) C3–C4 1.415 (8) C4–C5 1.418 (5) C12–C13 1.417 (5) C4–C5 1.408 (8) Cp-ring(2) C42–C38 1.421 (5) C18–C14 1.423 (4) C10–C6 1.417 (5) C38–C39 1.416 (6) C14–C15 1.423 (4) C6–C7 1.420 (5) C39–C40 1.404 (6) C15–C16 1.421 (5) C7–C8 1.399 (5) C40–C41 1.406 (5) C16–C17 1.427 (5) C8–C9 1.408 (5) C41–C42 1.416 (5) C17–C18 1.425 (5) C9–C10 1.432 (5)
Figure 1. Oak Ridge thermal ellipsoid plot (ORTEP) of 28.
Figure 2. ORTEP of 16.
Downloaded by NATIONAL TAIWAN UNIV on July 29, 2009
properties of the organic substituents. This conclusion was in good agreement with the results of later voltammetric studies.
Electrochemical Behavior of the Ferrocene Deri-vatives. The electrochemical properties of 8–11, 15, 21–23,
and 28 were investigated by cyclic voltammetry (CV) in CH2Cl2, using a platinum disk electrode as the working electrode and Bu4NClO4(0.1 M) as the supporting electro-lyte. The scan rate was 100 mV/s–1. The applied electrical potential was reported against a AgCl/Ag couple as reference and calibrated in situ against Fc/Fc+(E1/2) 0.51 V) as an internal standard.
Cyclic Voltammetric Behavior of the Mono-OXD Substituted Ferrocene System. Compounds 21–23 showed
two oxidation waves in Figure 4; the first one is for the redox couple of Fc/Fc+while the second one is for the redox couple of the amino group. These assignments were evidenced on the basis of their spectro-electrochemical behavior that will be discussed in the latter sections.
The half-potential of the Fc/Fc+couples fell into a narrow region of 0.80 ( 0.02 V, with the E1/2(1)values showing up at 0.82 V, 0.79 V, and 0.80 V, respectively (Scheme 7). These values were apparently higher in comparsion to that of the ferrocene standard (E1/2Fc/Fc+) 0.51 V). We attributed this to the electronic effects arising from the electron-withdrawing properties of the oxadiazole substituents. On the other hand, the electronic effects of the terminal Ph2N– groups on the Fc/Fc+ couple were small. The variation of the length of the phenylene bridge did not significantly alter the E1/2(1) values of the ferrocene moieties. This result indicated that the blocking effects of the OXD ring are
significant. On the other hand, the E1/2(2)values of the second oxidation waves of 21–23 covered a relatively wide range. Their E1/2(2)values appeared at 1.10 V, 1.01 V, and 0.95 V, respectively. These values could be explained in terms of a combination of the electronic effects arising from the withdrawing OXD rings as well as the electron-donating methyl substituents. First of all, the presence of the electron-withdrawing OXD rings conjugated to the Ar2N– groups retarded their electrochemical oxidation. However, when the length of the phenylene bridge increased, the effect of the oxadiazole group on the amino oxidation diminished. Therefore, the lower oxidation potential for the triarylamino moieties of 22 (E1/2(2)) 1.01 V) was expected in comparison to that of 21 (E1/2(2) ) 1.10 V). On the other hand, the presence of electron-donating methyl substituents on the terminal phenyl groups of 23 stabilized the cationic states, leading to a reduction of the oxidation potential to 0.95 V. These results indicated the existence of a strong electronic coupling between the Ar2N and the OXD groups.
Cyclic Voltammetric Behavior of the Bis-OXD Substituted Ferrocene System. 1,1′ -Bis[5-(phenyloxadiazol-2-yl)]ferrocene 15 showed a reversible oxidation wave at
E1/2) 0.95 V. Because there are two electron-withdrawing oxadiazole rings conjugated with the ferrocene unit, the oxidation of the Fc core of 15 should be relatively difficult in comparison to that of 21–23. This was reflected in the higher Fc/Fc+oxidation half-potential of 15 (0.95 V) when comparing against the E1/2(1)of 21–23 (0.80 ( 0.02 V).
The oxidation behaviors of 8–10, shown in Figure 5, were similar to those of 21–23. In the first CV cycle of 8 (Figure 5, line d), two anodic waves with peaks at 0.98 V and 1.22 V, respectively, were observed in the forward scan. The maximum current of the first anodic wave was about one-half of that of the second wave, indicating that the second wave corresponded to a two-electron oxidation. Because the
Figure 3. ORTEP of 10.
Figure 4. Cyclic voltammetric diagrams of the mono-OXD substituted
ferrocenes: (a) 21, (b) 22, and (c) 23.
Scheme 7. Electrochemical Oxidation of 21–23
Downloaded by NATIONAL TAIWAN UNIV on July 29, 2009
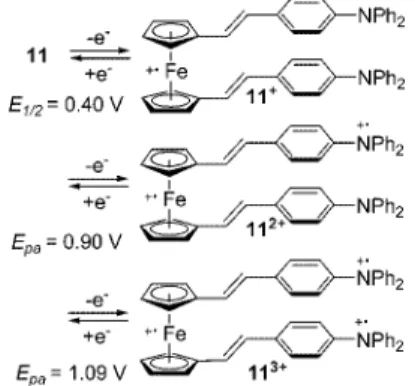
anodic current intensity usually correlated to the number of the oxidation sites on the molecules, we therefore assigned the first wave to the oxidation of the ferrocene unit and the second wave to the oxidation of the triarylamine units (Scheme 8). Because the interactions between two amino groups were blocked by the oxadiazole units, the electronic coupling between the amino lone pairs was expected to be weak. Therefore, the splitting of the E1/2 of the second and the third oxidations should be small and could not be resolved. These assignments were further supported by spectro-electrochemical analysis.
Compound 9 showed a major anodic wave, peaking at 1.09 V, with a shoulder that appeared at 0.94 V (Figure 5, line c). The shoulder at 0.94 V was close to the first Epaof 8 at 0.98 V and was assigned to the ferrocene oxidation. Increasing the length of the phenylene ring bridges did not significantly affect the Fc oxidation potential, indicating that the electronic communication between the amino groups and the ferrocene unit was small. On the other hand, the oxidation potential of the triarylamine units of 9 shifted forward to 1.09 V. This could be rationalized because the electron-withdrawing effect arising from the oxadiazole group
decreased when the length of the phenylene bridge increased. Therefore, the amino units became easily oxidized.
The methyl substituted reference compound 17 showed a broad CV wave, shown as an inset in Figure 12, that ranged from 0.85 to 1.3 V. Although the CV waves covered a similar voltage region as that of 9, the waves could not be resolved. However, the latter spectro-electrochemical analysis provided the necessary and independent evidence to verify the stepwise oxidation mechanisms.
When the number of the phenylene rings of 10 increased to three, the oxidation waves of the ferrocene unit and the amino cores merged (Figure 5, line b) and became indistin-guishable in the cyclic voltammogram.
Cyclic Voltammetric Behavior of the Vinyl Subs-tituted Ferrocene System. When the electron-withdrawing
oxadiazole linkers were replaced by vinylene groups, the ferrocene oxidation occurred significantly earlier (Figure 6). The CV of 28 (Scheme 9) showed two waves at E1/2) 0.48 and 0.94 V, respectively (Figure 6, line a). The first wave was assigned to the Fc/Fc+couple that was further proved in the spectro-electrochemical study. The second wave was due to the redox couple of the amino group. Similar CV features for 11 (Scheme 10) were observed in which the first oxidation occurred slightly earlier at E1/2) 0.40 V and the amino oxidations occurred at a similar voltage region, with the Epaat 0.90 and 1.09 V, respectively (Figure 6, line b). The shifts of the E1/2Fc/Fc+to the lower voltages of 0.48 V for 28 and 0.40 V for 11 in comparison to the ferrocene standard at 0.51 V were expected in consideration of the
π-electron donating ability of the vinyl substituents.
Note-worthy is the splitting of the amino oxidation waves in the CV of 11. Unlike the CV of 8, the splitting of the amino oxidation waves indicated the existence of a relatively strong electronic coupling between the amino groups through the vinyl–ferrocene–vinyl linker.
Figure 5. Cyclic voltammetric diagrams of the di-OXD substituted
ferrocenes: (a) 15, (b) 10, (c) 9, and (d) 8.
Scheme 8. Electrochemical Oxidation of 8–10
Figure 6. Cyclic voltammetric diagrams of the vinyl substituted ferrocenes:
(a) 11 and (b) 28.
Scheme 9. Electrochemical Oxidation of 28
Downloaded by NATIONAL TAIWAN UNIV on July 29, 2009
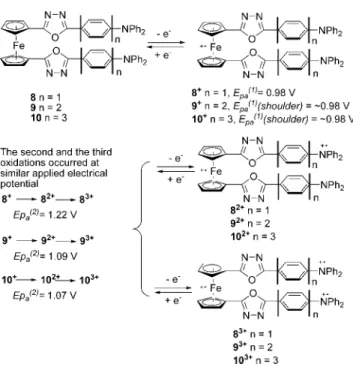
Electropolymerization of 8–11. Upon repetitive scanning
for 8–11 over the voltage range from 0 to 1.4 V, new redox patterns were found to grow in intensity on the Pt electrode. An example of 10 is shown in Figure 7. This indicates the formation of the electrochemically active polymeric film of
10 on the electrode surface (Scheme 11). A new wave
appeared as a shoulder at 0.85 V since the second scan. As seen in the inset of Figure 7, the absolute value of the anodic current intensity at 0.85 V was linearly proportional to the number of the scan. This is a typical oxidation wave of the benzidine group, indicating the occurrence of the oxidative coupling between –ArNPh2units.
More important was that similar growth occurred on an indium tin oxide (ITO) glass surface. Because ITO glass is a common transparent conductor, the electropolymerization of the ferrocene—triarylamine containing materials on the electrode surface would modify the electronic properties of the electrode. This surface modification tactic could then be applied to a wide range of optoelectronic device fabrications. A similar growth of the current intensity was again observed for 11 in the repetitive CV study (Figure 8). Although the splitting of the Epaand Epcof a redox couple, denoted as∆Ep, usually increased during the electrochemical polymerization, the increment of the potential splitting of the Fc/Fc+couple is much larger in comparison to that of the amino units. In the first CV cycle, the∆Ep values for the Fc/Fc+and the -C6H4NPh2/-C6H4NPh2(+ · ) couples were 0.17 and 0.20 V, respectively. After repeated scanning for 10 cycles, the∆Epvalues for the Fc/Fc
+
and the -C6H4NPh2/
-C6H4NPh2(+ · ) couples increased to 0.55 and 0.42 V, respectively. This result indicated that the oxidation of the ferrocene units was kinetically retarded more seriously than that of the triarylamino moieties during polymerization. This might be due to the fact that steric hindrance around the ferrocene cores was larger, leading to a sluggish diffusion of the counterions when the film thickness increased.
On the contrary, the electropolymerization became inef-fective for 17 when the 4-position of the terminal phenyl groups was blocked by the methyl substituents. This result evidenced that the oxidative polymerization of 8–11 occurred at the para-position of the terminal phenyl units.30
The CV behavior of the singly Ph2N- substituted 21 and
22 was quite different from that of 8–10. Compounds 21
and 22 showed reversible CV patterns (Figure 5) in the electrochemical studies. No current growth or pattern change was observed upon repetitive CV scanning, indicating that the deposition of 21 and 22 was slugguish.
Repetitive scanning for 28 showed a new shoulder wave that appeared at Epa ) 1.05 V (Figure 9). However, the growth rate of the current intensity was slow, implying that the deposition rate of the electroactive materials on the electrode surface was also sluggish. All this suggested the necessity of having dual diphenylamino side-arms for suc-cessful electrochemical depositions.
Spectro-Electrochemical Studies of the Electroactive Species: 9, 11, 15, 17, 21–23, and 28. The
spectro-electrochemical experiment31is a convenient and effective tool for the elucidation of the reaction mechanisms. A setup of 1 mm thick quartz cuvette equipped with a Pt gauze as the working electrode, a Pt wire as the counter electrode, and a Ag/AgCl electrode as reference were employed. The UV—vis—near-infrared (NIR) absorption spectra of the newly generated electro-active species were directly recorded during electrochemical oxidation. It took about 5 min to reach equilibrium after each voltage adjustment. Through monitor-ing the change of their absorption spectra, one can collect information about the reaction intermediates in the oxidation processes.
In the following study, we first examined the spectral change of 15 (Figure 10) during the electrochemical oxida-tion. Because 15 does not contain any amino moiety, we could single out the spectral change of the ferrocene moiety on the basis of the results.
The reference compound 15 started to be oxidized at 0.9 V. When the applied potential was gradually raised from 0.9 to 1.34 V, the ferrocene absorption intensity at 350 nm slightly dropped and a new shoulder band appeared at 400–500 nm with tailing extended to over 700 nm.
Next, the reference compounds 23 and 17 were examined, in which the coupling process was blocked by the introduc-tion of the methyl protective substituents. Because the oxidative coupling process was retarded, the spectral changes were clearly due to the formation of the cationic states of
23 and 17.
(30) Nelson, R. F.; Adams, R. N. J. Am. Chem. Soc. 1966, 88, 3498. (31) Bard, A. J.; Faulkner, L. R. Electrochemical Methods: Fundamentals
and Applications; Wiley: New York, 2001. Scheme 10. Electrochemical Oxidation of 11
Figure 7. Electropolymerization of 10 on the Pt working-electrode surface.
The repetitive scans were performed between 0 and 1.4 V. A pattern change with increasing current intensity was observed. The inset is a linear plot of the absolute value of the anodic current intensity grown at 0.85 V vs the number of scans.
Downloaded by NATIONAL TAIWAN UNIV on July 29, 2009
The oxidation of 23 started to occur at 0.66 V (Figure 11). When the applied electrical potential was gradually increased from 0.66 to 0.86 V, the ferrocene absorption band shown at 375 nm decreased and a new absorption shoulder band appeared at 400–500 nm. When the Eapplwas adjusted to 0.88 V or above, another absorption band originated from the ArN(tolyl)2(+ · ) moieties showed up at 600–800 nm.32,33 These results indicated the occurrence of a two-step oxidation sequence during the oxidation of 23.
A similar spectral change was observed for compound 17 at the early stage of the oxidation (Figure 12). Although the oxidation waves could not be well-resolved in the CV analysis, the stepwise oxidation processes were clearly evidenced by the spectro-electrochemical experiments. The absorption band between 600 and 800 nm started to appear when the applied potential was set at 0.88 V and reached the maximum at Eappl) 1.0 V. Parallel to the rising of this band, the ferrocene absorption at 300 nm also dropped. This
result illustrated that the first two oxidations occurred almost simultaneously, one for the Fc/Fc+couple and the other for the —ArN(tolyl)2/-ArN(tolyl)2(+ · ) couple. The third oxida-tion appeared later at a higher voltage. Further increase of the applied electrical potential over 1.0 V led to the drop of the absorption intensity at 600–800 nm. This result indicated the occurrence of the third oxidation.
To elucidate the mechanism of the electrochemical cou-pling reaction, we adopted 21 as an example to study. Because the terminal Ph2N- group was unprotected in this case, compound 21 would undergo oxidative coupling during the electrochemical study. We have mentioned previously that 21 gave rise to a reversible pattern in the CV scan. Therefore, one may not be able to conclude the occurrence of the oxidative coupling process based on the CV experi-ment. However, the spectro-electrochemical study provided us an opportunity to re-examine this puzzle. If the oxidative coupling process did occur, the newly formed cationic Scheme 11. Electropolymerization of 8–10 through Benzidine Formation
Figure 8. Electropolymerization of 11 on the Pt working-electrode surface.
The repetitive scans were performed between 0 and 1.4 V. A pattern change with increasing current intensity was observed.
Figure 9. Repetitive CV scans of 28 for 10 cycles. A new shoulder wave,
pointed to by an arrow, was observed at Epa) 1.05 V.
Figure 10. Spectral change of 15 along with increasing of the applied
voltage: (a) 0 V, (b) 0.9 V, (c) 1.0 V, (d) 1.1 V, and (e) 1.34 V vs Ag/AgCl couple as reference.
Figure 11. Spectral change of 23 along with increasing of the applied
voltage: (a) 0 V, (b) 0.74 V, (c) 0.82 V, (d) 0.90 V, (e) 0.94 V, (f) 0.98 V, and (g) 1.20 V versus Ag/AgCl couple as reference.
Downloaded by NATIONAL TAIWAN UNIV on July 29, 2009
benzidine moiety would lead to an intervalence charge-transfer (IVCT) absorption at the NIR region, usually ranged between 1000 and 2000 nm.18 The results of the spectro-electrochemical experiments could therefore give us a conclusive picture about the oxidative coupling reaction.
Compound 21 was first oxidized at 0.6 V, leading to a drop of the ferrocene absorption intensity at 390 nm. However, when the Eappl was raised to 0.88 V or above, unlike 23 which showed an absorption band at 600–800 nm, a new absorption band peaked at 1450 nm arose instead (Figure 13). This characteristic NIR absorption band was arising from the IVCT absorption of the benzidine units,6b,30,32,33 a product derived from the intermolecular oxidative coupling of the -C6H4NPh2(+ · ) groups (Scheme 12).
Similar phenomena were observed in the studies of 28 and
8–11. All these supported the oxidative benzidine formation
mechanisms in the electropolymerization process.
Electrochemically Deposited Polymer Films (EDPF) as the HIL for PLED Applications. It has long been known
that the properties of the hole-injection and hole-transport layers are critical for the performance of the polymeric light emitting devices (PLEDs). The commercially available
PEDOT-PSS (Bayer Inc.), a conductive polymer system containing poly(3,4-ethylenedioxythiophene) doped with poly(styrenesulfonic acid), has been widely used as the HIL PLED application.34 Although PEDOT-PSS is a suitable polymeric hole-injection system for most of the applications because of its good electrical conductivity and mechanical strength, the deep green color of the coating might hamper its role on full-color display applications. In our device, we first electrochemically deposited (ED) a layer of 8, 10, or
11 directly on ITO by CV. The chemically modified ITO
was then washed with CH2Cl2 to remove the residual supporting electrolyte. The ITO plate was then dried under vacuum at 100°C for 30 min, followed by spin-coating (3000 rpm, 90 s) an emissive layer of PVK-Ir(PPy)3-PBD35on top. The emissive layer was then dried under vacuum at 100°C for another 30 min. The composition of the solution used to construct the emissive layer is PVK/Ir(PPy)3/PBD ) 100:20:40 mg in CHCl3(8 mL). The solution was filtered through a PVDF filter (0.2 µm) before use under a clean
environment. Finally, a metallic cathode of Mg/Ag was fabricated by thermal evaporation and deposition under vacuum. The overall structure of the devices used in the study is ITO/ED-HIL/PVK:Ir(PPy)3:PBD (50 nm)/Mg (2 nm)/Ag (100 nm). In additon, a device of ITO/PEDOT-PSS (30 nm)/ PVK:Ir(PPy)3:PBD (50 nm)/Mg (2 nm)/Ag (100 nm) was used as a standard device for comparison. Since it has been known in literature that poly(4-(N,N-diphenylaminostyrene) (PDPAS) could be electropolymerized on the electrode surface, we have also adopted this electrochemically depos-ited thin film as a reference for comparison36(Scheme 13). The layers of 8, 10, or 11 were prepared by repetitive scanning over the voltage range from 0 to 1.3 V. The film
(32) Amthor, S.; Noller, B.; Lambert, C. Chem. Phys. 2005, 316, 141. (33) Low, P. J.; Paterson, M. A. J.; Goeta, A. E.; Yufit, D. S.; Howard,
J. A. K.; Cherryman, J. C.; Tackley, D. R.; Brown, B. J. Mater. Chem.
2004, 14, 2516.
(34) (a) Cao, Y.; Yu, G.; Zhang, C.; Menon, R.; Heeger, A. J. Synth. Met.
1997, 87, 171. (b) Berntsen, A.; Croonen, Y.; Liedenbaum, C.; Schoo,
H.; Visser, R.-J.; Vleggaar, J.; van de Weijer, P. Opt. Mater. 1998, 9, 125.
(35) (a) Kohler, A.; Wilson, J. S.; Friend, R. H. AdV. Mater. 2002, 14, 701. (b) Beeby, A.; Bettington, S.; Samuel, I. D. W.; Wang, Z. J. Mater. Chem. 2003, 13, 80.
(36) Compton, R. G.; Laing, M. E.; Ledwith, A.; Abu-Abdoun, I. I. J. Appl. Electrochem. 1988, 431.
Figure 12. Spectral change of 17 along with increasing of the applied
voltage: (a) 0 V; (b) 0.88 V; (c) 0.92 V; (d) 0.96; (e) 1.00 V; (f) 1.06 V; (g) 1.10 V; (h) 1.16 V vs Ag/AgCl couple as reference. Inset is the CV diagram of 17.
Figure 13. Spectral change of 21 along with increasing of the applied
voltage: (a) 0 V, (b) 0.85 V, (c) 0.95 V, (d) 0.97 V, (e) 0.99 V, (f) 1.01 V, and (g) 1.20 V.
Scheme 12. Dimerization of 21 through Oxidative Coupling
Scheme 13. Electropolymerization of PDPAS
Downloaded by NATIONAL TAIWAN UNIV on July 29, 2009
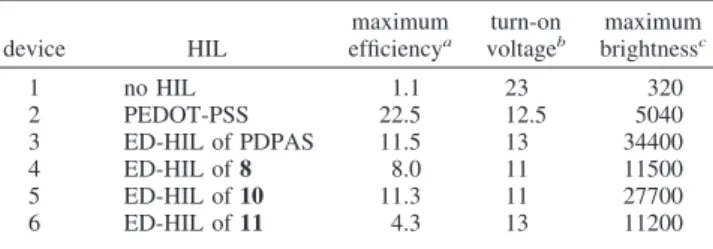
was almost colorless to slightly yellowish after deposition, with the CV scans ended at 0 V. The optimized scan number for the PLED was two to three cycles. The brightness versus voltage curves are shown in Figure 14. Their performances are summarized in Table 3.
Without being modified by any HIL, the reference device of ITO/PVK-Ir(PPy)3-PBD/Mg-Ag showed the turn-on volt-age of 23 V, with the maximum brightness of 320 cd/m2 and the current efficiency of 1.10 cd/A. The high turn-on voltage was due to the high energy barrier for the hole-injection process from the ITO electrode into the emissive PVK layer. When the ITO surface was modified by a PEDOT-PSS coating, the hole-injection energy barrier was significantly reduced so that the turn-on voltage dropped significantly to 12.5 V, with the current efficiency going up to 22.5 cd/A. The high current efficiency of the PEDOT-PSS modified PLEDs was probably due to the balanced hole and electron injection processes. However, the brightness versus voltage curve climbed up slowly when the applied electrical potential increased. The maximum brightness could only reach 5040 cd/m2. On the other hand, when an electrochemically deposited layer of PDPAS (MW: 2800, PDI ) 1.45) was used, the turn-on voltage of 13 V was slightly higher than that of the PEDOT-PSS device. However, the maximum brightness could be boosted up to 34 400 cd/ m2with the maximum current efficiency of 11.5 cd/A.
When 8 was used, the PLED performance was also improved dramatically in comparsion to the primitive device. The turn-on voltage was reduced to 11 V, with the maximum brightness of 11 500 cd/m2and the current efficiency of 8.0 cd/A. When 10 was used the turn-on voltage was 11 V, with the maximum brightness of 27 700 cd/m2 and the current efficiency of 11.3 cd/A. These results indicated that the
electrochemically deposited layers were good hole-injecting layers that could significantly reduce the energy barrier of the hole-injection process. It is noteworthy that the turn-on voltage of the devices 4 and 5 were even lower than that of the PEDOT-PSS modified device 2. On the contrary, the PDPAS did not show such a turn-on voltage reduction effect. These results reflected that the ferrocene core played an important role on the reduction of the turn-on voltage of the PLED. Perhaps because of the unbalanced hole injection over electron injection, the device efficiency, on the other hand, decreased.
When 11 was used as the precursor for the hole-transport layers, the turn-on voltage increased to 13 V, with the maximum brightness of 9000 cd/m2and the current efficiency of 3.8 cd/A. The turn-on voltage was apparently higher than that of the devices 4 and 5 and close to that of device 3. We are reminded that the E1/2 of the Fc core was 0.5 V lower than that of the corresponding benzidine linker in this case. Some Fc+cations might therefore be formed as space charges and trapped in the benzidine matrix. The mobility of this type of positive charge might be low and would only have a small contribution to the hole-injection process. However, the presence of excessive positive charges trapped in the matrix might inhibit the hole-injection process, leading to an increment of the hole-injection energy barrier and a consequently increased turn-on voltage. In addition, electrons might migrate into the layer and recombine with the Fc+. Because this process would only consume the electrical current without a contribution to the light emitting function, the current efficiency of the PLEDs would therefore be reduced, leading to a low current efficiency of 4.3 cd/A.
Scanning Electron Microscopy (SEM) Studies of the Polymeric Films of 8, 10, and 11 on ITO Glass. The high
performance of the devices attracted us to further investigate the morphology of the electrochemically deposited thin films on ITO. The thickness of the films was evaluated by an alpha-step instrument. The morphology of the films was studied by using field-emission SEM (15 KV) with magni-fication of 1.2× 10⁵times. The films were prepared under the same conditions as those for PLED fabrication.
The thickness of the electrochemically deposited layers from the CV method was indeed very thin. The film thicknesses were estimated to be less than 10 nm according to the alpha-step measurement. Figure 15 shows SEM images obtained from the bare ITO glass, purchased from the Merck company, and the thin films of 8, 10, and 11 on the ITO plates for comparison. The granular structure of the bare ITO glass was observed (Figure 15a), with the diameters around 10–20 nm, in the SEM study. When the ITO was treated with electropolymerization, the polymeric materials were evenly deposited onto the surface (Figure 15b-d). Because the thickness of the layers was thin, the presence of the deposition layers only slightly altered the morphology of the ITO surface and the granular patterns could still be observed. However, the presence of the thin layers signifi-cantly altered the properties of the electrode, leading to a reduction of the turn-on voltage of the PLEDs.
In summary, we demonstrated the use of diphenylamino substituted ferrocenes as effective precursors for
electro-Figure 14. Brightness vs voltage curves for devices 1–6. (a) device 1 (1);
(b) device 2 (]); (c) device 3 (O); (d) device 4 (b); (e) device 5 (9); (f) device 6 (2).
Table 3. Comparison of the Device Performances of the PLEDs with Different Types of HIL Layer
device HIL maximum efficiencya turn-on voltageb maximum brightnessc 1 no HIL 1.1 23 320 2 PEDOT-PSS 22.5 12.5 5040 3 ED-HIL of PDPAS 11.5 13 34400 4 ED-HIL of 8 8.0 11 11500 5 ED-HIL of 10 11.3 11 27700 6 ED-HIL of 11 4.3 13 11200 acd/A.bV, at 100 cd/m2.ccd/m2.
Downloaded by NATIONAL TAIWAN UNIV on July 29, 2009
chemical deposition. The deposition tactics were success-ful, providing a new route to access ferrocene-based organic-organometallic hybrid polymeric thin films. The hole-injection performance of the films on PLED applications was indeed outstanding and led to low turn-on voltage of the PLEDs. Although the detailed mechanisms in the present cases were uncertain, previous research reports revealed that ferrocene containing redox-active polymeric materials that possessed controllable, spacer mediated metal-metal interactions would have interesting hole-transport properties.37 In particular, the electrical con-ductivity of those materials would be largely increased by 10 orders of magnitude after partial oxidation and up to semiconductor values. Perhaps similar mechanisms operated in the present cases. The ferrocene containing layer that was coated onto the ITO surface would be partially oxidized when the electrical potential was
applied. The hole-transport properties and conductivity would therefore be enhanced. This would be beneficial for the hole-injection and transport processes to take place, lowering the turn-on voltage of the PLEDs.
Experimental Section
Hexane and ethylacetate were dried over anhydrous CaCl2.
Dichloromethane was dried over P2O5or CaH2. Diethylether and tetrahydrofuran (THF) was dried over Na metal plates, using benzophenone as an indicator. All the solvents were freshly distilled before use.
N,N′-Bis(4-bromobenzoyl)-1,1′-ferrocenedicarbohydrazide (14). To a solution of 1,1′-ferrocenedicarbohydrazide (4.1 g, 15 mmol)
in N-methylpyrrolidone (NMP, 15 mL) at 0 °C was added
4-bromobenzoyl chloride (6.72 g, 30 mmol) under nitrogen. After reaction for 1 h, the reaction mixture was gradually poured into ice–water (500 mL). The product precipitated from the aqueous solution. The yellowish precipitates were collected by suction filtration and dried to give a yellowish powder 14 (9.34 g, 83%).
1H NMR (400 MHz, DMSO-d
6):δ 10.56 (s, 2H, N-H), 9.93 (s, 2H, N-H), 7.81 (d, J ) 8.0 Hz, 4H, Ar-H), 7.71 (d, J ) 8.0 Hz,
4H, Ar-H), 4.94 (m, 4H, Cp-H), 4.61 (m, 4H, Cp-H).13C NMR
(100 MHz, DMSO-d6):δ 168.9, 166.0, 131.9, 131.4, 129.7, 126.1, 74.8, 73.1, 70.4. HRMS-FAB m/z: calcd for C26H20O4N4Br2Fe, 665.9201; found, 665.9208.
(37) (a) Massey, J. A.; Power, K. N.; Winnik, M. A.; Manner, I. AdV. Mater.
1998, 10, 1559. (b) Rulkens, R.; Perry, R.; Lough, A. J.; Manners, I.;
Lovelace, S. R.; Grant, C.; Geiger, W. E. J. Am. Chem. Soc. 1996, 118, 12683. (c) Rulkens, R.; Gates, D. P.; Pudelski, J. K.; Balaishis, D.; McIntosh, D. F.; Lough, A. J.; Manner, I. J. Am. Chem. Soc. 1997, 119, 10976. (d) Rulkens, R.; Resendes, R.; Verma, A.; Manners, I.; Murti, K.; Fossum, E.; Miller, P.; Matyjaszewski, K. Macromolecules
1997, 30, 8165.
Figure 15. Field-emission SEM images (15 KV) of the (a) bare ITO and the electrochemically deposited polymeric films of (b) 8, (c) 10, and (d) 11 on ITO
glass. The films were prepared by repetitive CV scan of the precursor solutions for three cycles. The images were enlarged 120 000 times. The samples were treated with sputttering of Pt onto the surface before the SEM image collection.
Downloaded by NATIONAL TAIWAN UNIV on July 29, 2009
Bis-1,1′-(5-(4-bromophenyl)-1,3,4-oxadiazol-2-yl)ferrocene (16). To a solution of 14 (6.68 g, 10 mmol) and DMC (4.2 g, 25 mmol) in dichloromethane (30 mL) at 0°C under N2was added Et3N (5.30 mL, 40 mmol). The mixture was stirred for 1 h in an ice bath and warmed gradually to room temperature. After the reaction was complete, the reaction was quenched by addition of water. The product was extracted with CH2Cl2(100 mL× 2). The combined extracts were dried (anhydrous MgSO4), filtered, and concentrated by rotary evaporation. The collected crude solid residue was purified by using liquid chromatography on silica gel, using EtOAC/CH2Cl2 ) 1:1 as eluent to give an orange solid 16 (5.80 g, 92%): mp
240–241°C.1H NMR (400 MHz, CDCl
3): δ 7.65–7.62 (m, 4H, Ar-H), 7.52–7.49 (m, 4H, Ar-H), 5.07 (m, 4H, Cp-H), 4.55 (m,
4H, Cp-H).13C NMR (100 MHz, CDCl
3):δ 164.9, 163.0, 132.0, 127.8, 126.0, 122.3, 72.2, 69.7, 68.6. HRMS-FAB m/z: calcd for C26H17O2N4Br2Fe(79Br,81Br), 632.9047; found, 632.9041.
1,1′ -Bis(5-(4-(N,N-diphenylamino)phenyl)-1,3,4-oxadiazol-2-yl)ferrocene (8). To a mixture of 16 (0.19 g, 0.3 mmol), Pd(OAc)2
(2.5 mg, 0.0089 mmol), DPPF (7.70 mg, 0.01 mmol), and NaOt
Bu (0.23 g, 2.23 mmol) in toluene (5 mL) was added diphenylamine (0.11 g, 0.6 mmol) under N2. The mixture was heated at reflux for 12 h. When the reaction was complete, the reaction was quenched by addition of water. The crude product was extracted twice with CH2Cl2. The combined extracts were washed with water, dried (anhydrous MgSO4), filtered, and concentrated by rotary evapora-tion. The concentrated crude product was purified by liquid chromatography on silica gel, using a mixture of EtOAc and CHCl3 (1/6) as eluent to give a red-brownish solid 8 (0.13 g, 82%): mp
120–121°C.1H NMR (400 MHZ, CDCl
3):δ 7.73 (d, J ) 8.8 Hz, 4H, Ar-H), 7.28–7.23 (m, 8H, Ar-H), 7.13–7.07 (m, 12H, Ar-H), 7.01 (d, J ) 8.8 Hz, 4H), 5.02 (m, 4H, Cp-H), 4.47 (m, 4H,
Cp-H).13C NMR (100 MHz, CDCl
3):δ 164.1, 163.8, 150.4, 146.5, 129.4, 127.7, 125.4, 124.1, 121.0, 115.9, 72.2, 69.4, 69.0. HRMS-FAB m/z: calcd for C50H36O2N6Fe, 808.2249; found, 808.2258. Anal. Calcd for C50H36O2N6Fe: C, 74.26; N, 10.39; H, 4.48. Found: C, 74.57; N, 10.09; H, 4.08.
Suzuki coupling of 16 and 20 with arylboronic acids was used as a general procedure for the preparation of 9–10, 17, and 21–23. 1,1′-Bis(5-(4′ -(N,N-diphenylamino)bipheny-4-yl)-1,3,4-oxadia-zol-2-yl)ferrocene (9). A mixture of 16 (1.90 g, 3 mmol), 4-(N,N′ -diphenylamino)phenylboronic acid (2.9 g, 10 mmol), Pd(PPh3)4(0.4 g, 0.3 mmol), and Na2CO3(1.3 g, 12.0 mmol) in toluene (30 mL) and water (10 mL) under nitrogen was heated at 105°C for 8 h. When the reaction was complete, water was added and the organic
layer was extracted with CHCl3(150 mL×2). The extracts were
combined and washed twice with water, dried (anhydrous MgSO4), filtered, and concentrated by rotary evaporation. The crude solid obtained was purified by liquid column chromatography on silica gel, using EtOAc-CHCl3as eluent (1/6) to give a red-brown solid 9 (1.80 g, 62%): mp 296–297°C.1H NMR (400 MHZ, CDCl 3):δ 7.86–7.84 (d, J ) 7.8 Hz, 4H, Ar-H), 7.52–7.50 (d, J ) 7.8 Hz, 4H, Ar-H), 7.42–7.40 (d, J ) 8.8 Hz, 4H, Ar-H), 7.27–7.23 (m, 8H, Ar-H), 7.12–7.01 (m, 16H, Ar-H), 5.09 (m, 4H, Cp-H), 4.55 (m, 4H, Cp-H).13C NMR (100 MHz, CDCl 3): δ 164.7, 163.8, 147.8, 147.2, 143.2, 133.0, 129.2, 127.6, 127.0, 126.5, 124.6, 123.2, 121.6, 72.2, 69.7, 68.8. HRMS-FAB m/z: calcd for C62H44O2N6Fe, 960.2875; found, 960.2892. Anal. Calcd for C62H44O2N6Fe: C, 77.50; N, 8.75; H, 4.62. Found: C, 77.91; N, 8.86; H, 4.29.
1,1′-Bis(5-(4′′-(N,N-diphenylamino)-1,1′:4′,1′′ -terphenyl-4-yl)-1,3,4-oxadiazol-2-yl)ferrocene (10). Compound 16 (0.22 g, 0.3 mmol), Pd(PPh3)4(0.06 g, 0.05 mmol), 4′-(N,N′ -diphenylamino-)biphenyl-4-ylboronic acid (0.55 g, 1.5 mmol), and Na2CO3(0.21 g, 2.0 mmol) in toluene (7 mL) and water (2 mL) were reacted to give a red-brownish solid 10 (0.15 g, 40%): mp 244–245°C.1H
NMR (400 MHZ, CDCl3):δ 7.88 (d, J ) 8.4 Hz, 4H, Ar-H), 7.59–7.48 (m, 12H, Ar-H), 7.47 (d, J ) 8.4 Hz, 4H, Ar-H), 7.26–7.22 (m, 8 H, Ar-H), 7.11–7.10 (m, 12H, Ar-H), 7.03–7.00 (m, 4H, Ar-H), 5.10 (m, 4H, Cp-H), 4.57 (m, 4H, Cp-H).13C NMR (100 MHz, CDCl3): δ 164.8, 163.7, 147.4, 147.3, 143.2, 140.1, 137.8, 133.8, 129.2, 127.5, 127.2, 126.94, 126.91, 126.90, 124.4, 123.5, 123.0, 122.2, 72.1, 69.8, 69.0. HRMS-FAB m/z: calcd for C74H52O2N6Fe, 1112.3501; found, 1112.3514. Anal. Calcd for C74H52O2N6Fe: C, 79.85; N, 7.55; H, 4.71. Found: C, 79.91; N, 7.17, H, 4.33.
1-(Tri-n-butylstannyl)-1′ -(diphenylamino)styryl)fer-rocene (26). To a solution of 24 (5.7 g, 11.4 mmol), diethyl 4-(N,N-diphenylamino)benzylphosphonate (25, 4.5 g, 11.4 mmol), and LiCl
(0.95 g, 22.5 mmol) in DMF (50 mL) under nitrogen at 0°C was
added t-BuOK (5.6 g, 50 mmol). The mixture was further reacted
at 0°C for 2 h and gradually warmed to room temperature. The
reaction was monitored by thin-layer chromatography. When the reaction was complete, water was added to quench the reaction. The crude mixture was extracted twice with Et2O. The combined extracts were washed with water, dried (anhydrous MgSO4), filtered, and concentrated by rotary evaporation. The crude mixture was purified by column chromatography on silica gel, using hexane-CH2Cl2(4/1) as eluent to afford 25 as a red oil (7.3 g, 86%).1H
NMR (400 MHz, CDCl3):δ 7.3–7.21 (m, 6H, Ar-H), 7.10–7.07 (m, 4H Ar-H), 7.02–6.97 (m, 4H, Ar-H), 6.73 (d, J ) 16 Hz, 1H, vinyl-H), 6.61 (d, J ) 16 Hz, 1H, vinyl-H), 4.37 (m, 2H, Cp-H), 4.30 (m, 2H, Cp-H), 4.19 (m, 2H, Cp-H), 3.94 (m, 2H, Cp-H), 1.59–1.50 (m, 6H), 1.38–1.25 (m, 6H), 1.03–1.01 (m, 6H), 0.99–0.86 (m, 9H).13C NMR (100 MHz, CDCl 3):δ 147.1, 146.0, 132.0, 128.8, 126.2, 125.2, 125.0, 123.84, 123.76, 122.4, 83.5, 75.6, 72.0, 69.2, 69.0, 66.7, 29.6, 27.8, 14.2, 10.8. HRMS-FAB m/z: calcd for C42H51NSnFe, 745.2393; found, 745.2401.
NMR data of 28 obtained from hydro-destannylation on silica
gel are as follows.1H NMR (400 MHz, CDCl
3):δ 7.33–7.12 (m, 6H, Ar-H), 7.12–7.10 (m, 4H Ar-H), 7.05–7.00 (m, 4H, Ar-H), 6.76 (d, J ) 16 Hz, 1H, vinyl-H), 6.65 (d, J ) 16 Hz, 1H, vinyl-H), 4.45 (m, 2H, Cp-H), 4.27 (m, 2H, Cp-H), 4.15 (s,
5H, Cp-H).13C NMR (100 MHz, CDCl
3):δ 147.6, 146.5, 132.4, 129.3, 126.7, 125.7, 125.4, 124.3, 124.2, 122.9, 84.2, 69.7, 69.4, 67.2. The X-ray data was discussed in the article.
1′-(4-(N,N-Diphenylamino)styryl)ferrocenecarboxaldehyde (27). The synthesis of 27 was performed according to the procedure for 24. Compound 26 (1.64 g, 2.2 mmol) in THF (10 mL) under N2at -78°C was reacted first with n-BuLi in n-hexane (1.6 M, 2 mL, 3.2 mmol), followed by DMF (0.25 mL, 3.0 mmol) to give a crude oil that was purified by column chromatography on silica gel, using
EtOAc to give 27 (0.47 g, 52%).1H NMR (400 MHZ, CDCl 3):δ 9.91 (s, 1H, CHO), 7.32–7.24 (m, 6H, Ar-H), 7.12–7.10 (m, 4H, Ar-H), 7.04–7.01 (m, 4H, Ar-H), 6.69 (d, J ) 16 Hz, 1H, vinyl-H), 6.25 (d, J ) 16 Hz, 1H, vinyl-H), 4.75 (m, 2H, Cp-H), 4.56 (m, 2H, Cp-H), 4.54 (m, 2H, Cp-H), 4.36 (m, 2H, Cp-H). 13C NMR (100 MHz, CDCl 3):δ 192.9, 147.0, 146.6, 131.1, 128.9, 127.3, 126.5, 124.0, 123.3, 122.64, 122.60, 85.9, 79.7, 74.4, 70.6,
70.3, 68.0. HRMS-FAB m/z: calcd for C31H25NOFe, 483.1286;
found, 483.1291.
1,1′-Bis(4-(N,N-diphenylamino)styryl)ferrocene (11). Com-pound 11 was synthesized according to the general synthetic procedure for 26. Compound 27 (0.45 g, 1.14 mmol), diethyl 4-(N,N′-diphenylamino)benzylphosphonate (25, 0.47 g, 1.2 mmol), and LiCl (0.1 g, 2.4 mmol) in DMF(10 mL) were reacted with
t-BuOK (0.67 g, 6 mmol) to afford a crude oil that was purified by
column chromatography on silica gel, using a mixture of CH2Cl2 and hexanes (1/6) as eluent to provide 11 as a red oil (0.7 g, 85%):
Downloaded by NATIONAL TAIWAN UNIV on July 29, 2009
mp 210–211 °C.1H NMR (400 MHZ, CDCl
3):δ 7.26–7.21 (m, 12H, Ar-H), 7.11–7.08 (m, 8H, Ar-H), 7.02–6.98 (m, 8H, Ar-H), 6.72 (d, J ) 16 Hz, 2H, Ar-H), 6.63 (d, J ) 16 Hz, 2H, Ar-H),
4.40 (m, 4H, Cp-H), 4.26 (m, 4H, Cp-H).13C NMR (100 MHz,
CDCl3):δ 147.0, 145.9, 131.8, 128.7, 126.2, 125.5, 124.2, 123.8, 123.5, 122.4, 84.4, 70.0, 68.0. HRMS-FAB m/z: calcd for
C50H40N2Fe, 724.2541; found, 724.2555. Anal. Calcd for
C50H40N2Fe: C, 82.87; N, 3.87; H, 5.56. Found: C, 82.68; N, 4.00; H, 5.02.
Acknowledgment. The present research project was sup-ported by the National Science Council, Taiwan (NSC 95-2113-M-002-020).
Supporting Information Available: The synthetic procedures
for 13, 15, 17, and 20–24,1H and13C NMR of 8–17 and 20–28
(PDF), and CIF files for 10, 16, and 28. This material is available free of charge via the Internet at http://pubs.acs.org.
CM702217U
Downloaded by NATIONAL TAIWAN UNIV on July 29, 2009