國
立
交
通
大
學
光電工程研究所
碩
士
論
文
新型低溫配向膜材料研究
New Liquid Crystal Alignment Materials for
Low Temperature Process
研 究 生:林秀玉
指導教授:陳皇銘 博士
指導教授:許瑤真 博士
新型低溫配向膜材料研究
New Liquid Crystal Alignment Materials for
Low Temperature Process
研 究 生:林 秀 玉 Student:Xiu-Yu Lin
指導教授:陳皇銘 博士 Advisor : Dr. Huang-Ming Philip Chen
許瑤真 博士
Advisor : Dr. Yao-Jane Hsu
國立交通大學
光電工程研究所
碩 士 論 文
A Thesis
Submitted to Institute of Electro-Optical Engineering College of Electrical and Computer Engineering
National Chiao Tung University in Partial Fulfillment of the Requirements
for the Degree of Master in
Electro-Optical Engineering July 2010
Hsinchu, Taiwan, Republic of China
新型低溫配向膜材料研究
學生:林 秀 玉
指導教授:陳皇銘
指導教授:許瑤真
國立交通大學光電工程研究所
摘
要
液晶配向層材料在影像品質以及液晶顯示可靠度扮演重要的角色。對聚亞醯 胺層(Polyimide film)的配向摩擦(Rubbing)方法會影響配向膜的製備。然而,製備 此配向膜的烘烤溫度高於 200°C 是使其在軟性基板應用上的主要限制因素。此 外,可用於低溫製程之新型液晶配向材料為節能的新興需求。因此,各種具有明 顯的化學官能基例如聚乙烯醇(polyvinyl alcohol, PVA)、聚苯乙烯(polystyrene, PS) 、 聚 乙 烯 苯 磺 酸 (polystyrene sulfonic acid, PSSA) 、 聚 (4- 乙 基 苯 酚 )(poly- (4-vinylphenol, PVP)和聚乙烯吡咯烷酮(polyvinyl pyrrolidone, PVPD)皆列入研究 材料中。這些材料的製程溫度都可以低於 110°C。
我們研究了各種高分子表面在作為液晶顯示器上之新型液晶配向材料的光 學特性和表面定向。並檢驗這些新型液晶配向材料在機械摩擦配向處理後的光電 特性、指向秩序參數(order parameter)和極化錨定能(polar anchoring energy)等等表 現。這些新型液晶配向材料的鍵結定向可以透過表面選擇性技術,即近緣 X-射線
吸收細微組態(near edge X-ray absorption fine structure, NEXAFS)來作歸類。 NEXAFS 的測量結果明顯地顯示配向摩擦後的高分子表面面內和面外的不對稱 性。可證實這些新型液晶配向材料是適合用於平板液晶顯示器低溫製程的軟性基 板上。
New Liquid Crystal Alignment Materials for Low Temperature Process
Student: Lam Tu Ngoc Advisor: Dr. Huang-Ming Philip Chen
(Xiu-Yu Lin) Advisor: Dr. Yao-Jane Hsu
Institute of Electro-Optical Engineering National Chiao Tung University
Abstract
Liquid crystal alignment layer plays an important role to the image quality and liquid crystal display’s reliability. The rubbing method on polyimide (PI) film has dominated the alignment films’ preparation. However, high baking temperature over 2000C that is required for the film preparation is a major limitation for its applications into flexible substrates. New alignment materials for low temperature process are the emerging needs of energy conservation. Various alignment materials containing distinct chemical functional groups, such as polyvinyl alcohol (PVA), polystyrene (PS), polystyrene sulfonic acid (PSSA), poly- (4-vinylphenol) (PVP) and polyvinylpyrrolidone (PVPD) are studied. The process temperature for these materials can be as low as 1100C.
Optical properties and surface orientation of a variety of polymer surfaces were investigated as new liquid crystal alignment materials in liquid crystal displays (LCDs). The performances of these new liquid crystal alignment materials induced by mechanical rubbing treatment were examined by their electro-optical properties, order parameter and polar anchoring energy. The bonding orientation of these new alignment materials were characterized through surface sensitive technique, near edge
X-ray absorption fine structure (NEXAFS). The NEXAFS measurements clearly indicated the in plane and out of plane asymmetries at the surface of rubbed polymers. These new liquid crystal alignment layers are suitable for flexible substrates of low temperature process in flat panel liquid crystal displays.
Acknowledgement
The completion of this thesis could not be done without the help and support of many people who are gratefully acknowledged. I was lucky enough to receive this kind of aid from many sources.
First of all, I am honored to express my deepest gratitude to my advisors, Prof. Huang-Ming Philip Chen and Dr. Yao-Jane Hsu who have helped me a lot in finishing this thesis. I greatly appreciate their kindness. They not only have offered precious ideas, advices, and suggestions but also have encouraged and motivated me try my best to reach my target.
Secondly, I am really thankful to the professors who taught me useful and interesting courses at National Chiao Tung University as well as at National Synchrotron Radiation Research Center.
Thirdly, I am indebted to many of my friends to support me
during the master
program.
I highly appreciate all the input that I have received from my classmates. I especially owe sincere thanks to my good friends in NSRRC, who have helped and encouraged me very much during the whole time. Friendships will be with me wherever I go. I have learned a lot from everyone that I worked with. I will try to acquire valuable knowledge from my teachers and classmates to enrich my life.Last but not least, I would like to thank my family for their support all the way from the beginning of my study.
Table of contents
Abstract in Chinese i
Abstract in English iii
Acknowledgement v Table of contents vi List of Tables ix List of Figures x Chapter 1 Introduction 1 1.1 Display Technology 1
1.2 Introduction of Liquid Crystal 1
1.3 Liquid Crystal Displays 3
1.3.1 The Fundamental Concept of Liquid Crystal Displays 3 1.3.2 Operation Principle of Twisted Nematic Liquid Crystal 7
1.4 Liquid Crystal Alignment 8
1.4.1 Alignment Techniques 8
1.4.2 Alignment Materials 9
1.5 Motivation and Objective 9
Chapter 2 Principle of Liquid Crystal Alignment and Near Edge X-ray
Absorption Fine Structure (NEXAFS) Spectroscopy 12
2.1 Mechanical Rubbing Technique 12
2.1.1 Rubbing Strength 12
2.1.2 Alignment Mechanism Induced by Rubbing Method 14 2.2 Near Edge X-ray Absorption Fine Structure (NEXAFS) Spectroscopy 19
2.2.1 Elliptically Polarized Undulator (EPU) 19
2.2.2 Photoemission Electron Microscopic (PEEM) 20 2.2.3 The Operation Principle of NEXAFS Spectroscopy 21
Chapter 3 Measurement Systems and Sample Fabrication 26
3.1 Introduction 26
3.2 Atomic Force Microscope (AFM) 26
3.3 UV-Visible Spectrometer 28
3.3.1 Cell Gap Measurement 28
3.3.2 Order Parameter Measurement 31
3.4 Electro-Optical Measurement System 31
3.5 Anchoring Energy Measurement 32
3.6 NEXAFS Measurement 35
3.7 Fabrication Process 36
3.7.1 Flowchart 36
Chapter 4 Experimental Results and Discussion 40
4.1 Surface Morphology of Alignment Materials 40
4.2 Order Parameter 44
4.3 Electro-optical Characteristics of TN cells 45
4.4 Polar Anchoring Energy 47
4.5 NEXAFS Measurements 58
Chapter 5 Conclusions 64
5.1 Conclusions 64
5.2 Future Works 66
List of Tables
Table 2-1 Alignment obtained with various rubbed polymer films
Table 3-1 Specific parameters of spin coating process for solvent (top) and mixture solution (bottom)
Table 3-2 Specific parameters of different materials Table 4-1 Chemical structures of different materials Table 4-2 Order parameters of different rubbed polymers
Table 4-3 Specific parameters of V-T curves using different rubbed surfaces
Table 4.4 Rubbing parameters at three different rubbing conditions
Table 4-5 Necessary parameters for determining polar anchoring energy of
polyimide at different rubbing strength conditions
Table 4-6 Necessary parameters for determining polar anchoring energy of PSSA at different rubbing strength conditions
Table 4-7 Necessary parameters for determining polar anchoring energy of PVP at different rubbing strength conditions
Table 4-8 Order parameters of rubbed PI, PSSA, and PVP at strong rubbing strength
Table 4-9 Necessary parameters for determining polar anchoring energy of PVPD at different rubbing strength conditions
List of Figures
Fig. 1-1 Schematic illustration of crystal, liquid crystal, and liquid phases
Fig. 1-2 Device structure of transmissive LCD
Fig. 1-3 (a) Sketch of Transmissive LCD, (b) Reflective LCD, and (c)
Transflective LCD
Fig. 1-4 The operation principle of normally white twisted nematic LCD
Fig. 1-5 Typical orientations of nematic liquid crystals on alignment layer
Fig. 2-1 Photograph of rubbing machine
Fig. 2-2 Schematic of mechanical rubbing
Fig. 2-3 The geometry of shear deformation in cross section
Fig. 2-4 Plot of retardation induced by rubbing
Fig. 2-5 Liquid crystal orientation on rubbed surfaces
Fig. 2-6 NEXAFS spectra recorded by Auger (AEY) and total (TEY) electron
yield for rubbed BPDA-PDA polyimide (in the left) and rubbed 96K polystyrene (in the right), with the electric field parallel to x, y and 200 from the z axis
Fig. 2-7 The formation of linearly polarized light by EPU
Fig. 2-8 Experimental photon flux spectrum of the EPU beamline
Fig. 2-9 PEEM station at EPU
Fig. 2-10 Illustration of absorption region of XANEX and EXAFS
Fig. 2-11 NEXAFS spectrum of different elements in a polyimide polymer
Fig. 2-12 Near edge X-ray absorption fine structure spectrum (Carbon K-edge)
Fig. 2-13 Polarization dependent NEXAFS spectra of benzene chemisorbed on Ag
(110)
Fig. 2-14 Two techniques to record X-ray absorption spectra
Fig. 3-1 Concept of AFM and the optical lever
Fig. 3-2 Two reflecting surfaces separated by a layer causing a light interference.
The dotted line indicates first internal reflection
Fig. 3-3 The reflection as a function of wavelength using air gap of 5.0μm
Fig. 3-4 Schematic diagram of electro-optical measurement system
Fig. 3-5 Flow chart of fabrication process
Fig. 3-6 Schematic of a liquid crystal cell
Fig. 4-1 AFM images and RMS roughness values of PI, PVA, PS, PSSA, PVP,
and PVPD, respectively
Fig. 4-2 V-T curves of TN cells using rubbed PI, PVA, PS, PSSA, PVP, and
PVPD, respectively. The inset shows the normalized V-T curves
Fig. 4-3 Capacitance dependence on applied voltage for polyimide at strong,
medium, and weak rubbing conditions, respectively
Fig. 4-4 Electro-optical properties of TN cells using rubbed PI at weak, medium,
and strong rubbing strengths. The inset shows normalized V-T curves
Fig. 4-5 Capacitance dependence on applied voltage for PSSA at strong (top) and medium (bottom) rubbing conditions
Fig. 4-6 Electro-optical properties of TN cells using rubbed PSSA at medium and
strong rubbing strengths. The inset shows the normalized V-T curves
Fig. 4-7 Capacitance dependence on applied voltage for PVP at strong (top) and
medium (bottom) rubbing conditions
Fig. 4-8 Electro-optical properties of TN cells using rubbed PVP at medium and
strong rubbing strengths. The inset shows the normalized V-T curves
Fig. 4-9 Electro-optical properties of TN cells using rubbed PI, PSSA, and PVP
at strong rubbing strength. The inset shows the normalized V-T curves
medium (bottom) rubbing conditions
Fig. 4-11 Experimental geometries of in-plane and out-of-plane asymmetries used
for the NEXAFS measurements
Fig. 4-12 Polarization-dependent C K-edge NEXAFS spectra of rubbed PSSA for
in-plane asymmetry (top) and out-of-plane asymmetry (bottom). Inset shows the magnification of
orbitals.Fig. 4-13 Illustration of in-plane phenyl ring orientation (left) and a preferential
tilt of phenyl planes by an angle from the z axis (right) of PSSA
Fig. 4-14 Polarization-dependent C K-edge NEXAFS spectra of rubbed PS for
in-plane asymmetry (top) and out-of-plane asymmetry (bottom)
Fig. 4-15 Polarization-dependent C K-edge NEXAFS spectra of rubbed PVP for
in-plane asymmetry (top) and out-of-plane asymmetry (bottom). Inset shows the magnification of
orbitals.Fig.4-16 Illustration of phenyl ring orientation (left) and a preferential tilt of
phenyl planes by an angle from the z axis (right) of PVP
Fig. 4-17 Polarization-dependent C K-edge NEXAFS spectra of rubbed PVPD for
Chapter 1
Introduction
1.1 Display Technology
Display technology has expanded incessantly since the last few years of the 21st century, especially for the flat panel displays (FPDs) which are everywhere in our daily lives, for example, mobile phones, camera screens, monitors, televisions, notebooks, traffic signals, and electronic signage [1]. With such great development, display technology becomes indispensable for a human being’s life. As a result, human demand impulses the formation and the growth of more and more display technologies. FPD technologies can be divided into several kinds such as Liquid Crystal Displays (LCDs), Plasma Display Panels (PDPs), Light Emitting Diodes (LEDs), Organic Light-Emitting Devices (OLEDs), and Field Emission Displays (FEDs). Each technology has its own strengths and applications. Among such kinds of technology, desired features of thin format, compact size, light weight, high image quality, and reasonable cost can be achieved by LCDs.
1.2 Introduction of Liquid Crystal
Liquid crystalline phase was first discovered by Friedrich Reinitzer [2] in 1888 and the well known term “liquid crystal” (LC) was introduced by Otto Lehmann [3] in 1889. Liquid crystal is an intermediate phase of matter between the crystalline solid and isotropic liquid. There are some different types of liquid crystal phases, also called
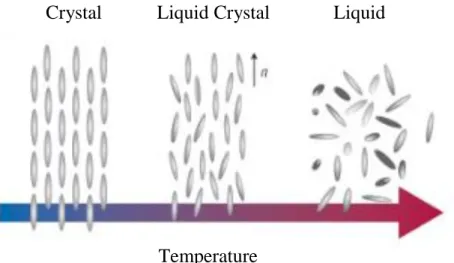
“mesophases”, can be distinguished based on their own properties. The illustration of crystal, liquid crystal, and liquid phases is given in Fig. 1-1
Liquid crystals consists of two basic groups: lyotropic phases and thermotropic phases [4]. Lyotropic liquid crystals are formed when a suitable concentration of a material is dissolved in some solvents [5] while thermotropic liquid crystals exhibit temperature dependence of various liquid crystalline phases. Based on the molecular shape of the constituent molecules, thermotropic liquid crystals can be classified into two main kinds: calamitic (rod-like) mesogens and discotic (disk-like) mesogens. Calamitic mesogens are mainly composed of nematic, smectic, and cholesteric.
The change of liquid crystal phase depends on temperature. The molecules are in the isotropic liquid state, having no either orientational order or positional order when the temperature is higher than the clearing point.
Among calamitic mesogens, the nematic phase is the simplest and the most common liquid crystal phase in which the molecules have orientational order but no positional order [6]. The long axis of the molecules reveals preferred direction, orienting along a specific direction, is called liquid crystal director and denoted by the unit vector n. The molecules align in parallel directions but not in layers. The
Fig. 1-1 Schematic illustration of crystal, liquid crystal, and liquid phases
Crystal Liquid Crystal
Crystal
Liquid Crystal
nematic liquid crystals are widely applied into monitors, televisions because of its prominent advantages: small viscosity, fast response time [7-8].
To describe the orientational order of the molecules in nematic liquid crystals, the order parameter is given and defined as below
2
1
3cos 1
2
S
Where is the angle between the molecular axis and the director axis. The order parameter is an average through the whole system, providing a measure of the long-range orientation order. The smaller the fluctuation of the molecular axis from the director axis orientation direction, the closer the magnitude of order parameter is to unity [5]. The order parameter S = 1 shows a perfectly orientational order (crystalline phase). Otherwise, the order parameter S = 0 expresses no orientational order (isotropic phase). In general, the order parameter of liquid crystal has the typical value in the range of 0.4 < S < 0.7.
A striking difference between liquid crystal and ordinary anisotropic or isotropic liquid is the existence of a short-range order in the isotropic phase, meaning molecules within a short distance of one another are correlated by intermolecular interactions. Short-range order in the isotropic phase gives rise to critical behavior of the liquid crystals under the effect of externally applied fields [5].
1.3 Liquid Crystal Displays
1.3.1 The fundamental concept of Liquid Crystal Displays
Liquid crystals are widely commercial applied over the last decades in electro-optical flat panel displays, for example, watches, calculators, portable
telephones, notebooks, laptop computers, ect [9]. Nowadays, LCDs have gradually replaced Cathode Ray Tubes (CRTs) in the computer monitor market as well as have dominated displays market in portable instruments because of their great strengths such as small size, low weight, low operation voltage, and low power consumption.
The first generation of liquid crystal displays was dynamic scattering mode displays. However, this type of display is more and more obsolete since the appearance of twisted nematic displays, except for some special applications. The basic difference between these two modes is purely dielectric and non-purely dielectric effect. The dynamic scattering mode is based on the principle of dielectric as well as conductivity alignment while the rest of LC displays including twisted nematic mode is based on purely dielectric effect.
Liquid Crystal Displays is known as passive electro-optical displays, which can not produce the light by itself but only modulate the light. Liquid Crystal Displays comprises three main types: transmissive, reflective, and transflective. Transmissive LCD was demonstrated by Sharp Corporation in 1989 [10]. A backlight system is very necessary for transmissive LCD to illuminate the LCD panel and the transmission light is controlled by the change of liquid crystal molecular orientation for the purpose
Liquid Crystal Color Filter Polarizer Inner Reflector Quarter Wave Plate
of image display. LCDs are composed of polarizer, color filter, liquid crystal, and backlight as shown in Fig. 1-2.
The displayed images of transmissive LCD are not appropriate for outdoor applications because the ambient light is stronger than emit light from backlight. Hence, the appearance of reflective LCDs [6, 11] is a better choice. Reflective LCDs can be divided into direct-view and projection displays. A direct-view reflective LCD uses ambient light to display the images. Cholesteric liquid crystal materials which can reflect specific wavelength of light were paid much attention in the research of reflective LCDs [6, 12].
A major disadvantage of reflective LCDs is unreadable in dark ambient conditions. Transflective LCD [13] appears like the combination of transmissive LCD and reflective LCD. Transflective LCD uses an inner reflector to reflect ambient light in reflective area while light was displayed by backlight system in transmissive area. Among three kinds of LCDs, transmissive LCD is the most promising candidate for the multimedia display applications due to its simple fabrication process. Fig. 1-3 (a), (b), and (c) show three typical kinds of LCDs.
Liquid Crystal Polarizer
Color Filter
Polarizer Inner Reflector
Quarter Wave Plate Quarter Wave Plate
PPlate
Backlight
The most widespread LCDs applications in transmissive LCDs are the twisted nematic (TN) modes. Like the other modes, twisted nematic mode has particular strengths and weaknesses. High contrast ratio and low driving voltage are main advantages of TN mode. The twisted nematic LCDs have been used extensively to a mass commercial production because of its simple fabrication process, high production throughput, and low production costs. However, slow response time and narrow viewing angle are the critical drawbacks of TN LCDs applications. In this thesis, TN cells will be used to examine the electro-optical characteristics of different alignment materials.
Fig. 1-3 (a) Sketch of Transmissive LCD, (b) Reflective LCD, and (c) Transflective LCD
Ambient Light
1.3.2 Operation principle of twisted nematic liquid crystal
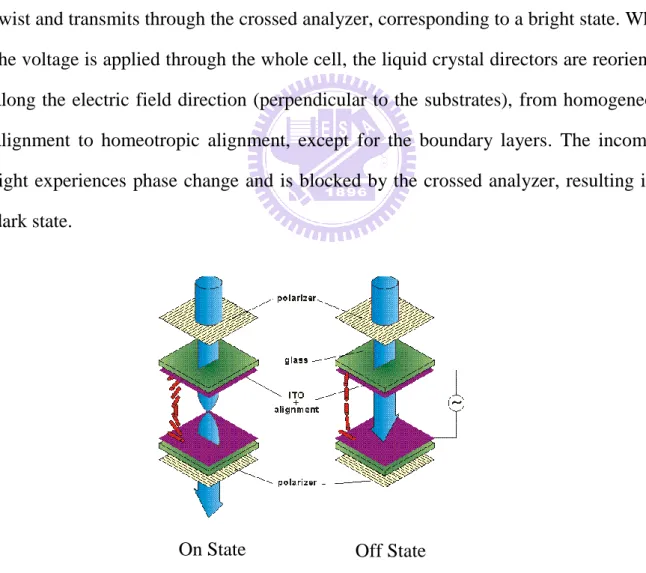
In twisted nematic [6, 14] liquid crystal displays, the nematic liquid crystal of positive permittivity is used. Figure 1-4 shows the LC director configurations of the normally-white TN cell in the voltage-off (on state) and voltage-on (off state) states.
The TN cell is placed between two crossed polarizers. In the voltage-off state, the top LC directors are parallel to the transmission axis of the top polarizer while the bottom LC alignment direction is twisted 90 degree and parallel to the transmission axis of the bottom analyzer. The incident linearly polarized light follows the molecular twist and transmits through the crossed analyzer, corresponding to a bright state. When the voltage is applied through the whole cell, the liquid crystal directors are reoriented along the electric field direction (perpendicular to the substrates), from homogeneous alignment to homeotropic alignment, except for the boundary layers. The incoming light experiences phase change and is blocked by the crossed analyzer, resulting in a dark state.
On State Off State
Fig. 1-4 The operation principle of normally white twisted nematic LCD
1.4 Liquid Crystal Alignment
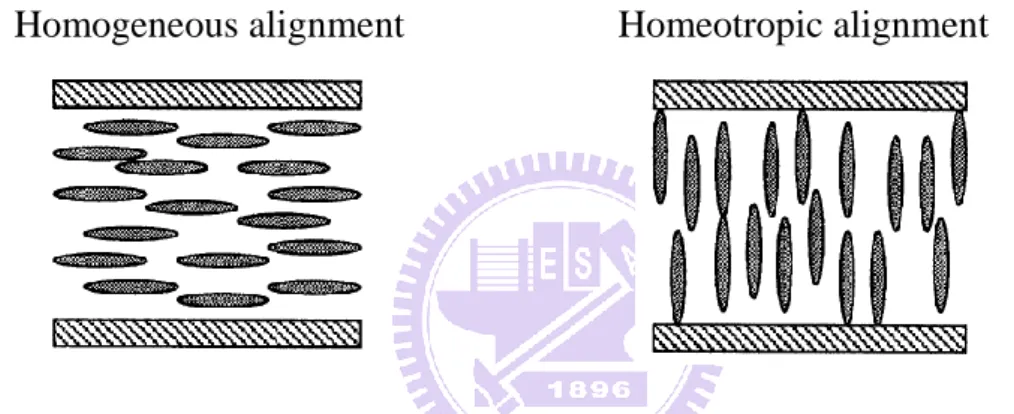
In liquid crystal displays devices, alignment layer is to align liquid crystal molecules toward the preferential direction on its surface. A uniform and defect free alignment of the liquid crystal molecules on the surface of alignment layers is prerequisite condition for the quality of liquid crystal displays since LC devices are operated through the variation of nematic liquid crystal molecular orientations. Fig. 1-5 illustrates typical orientations of LCs induced on alignment layer.
The aligning ability of alignment materials depends on several following elements, namely, alignment layers’ direction order, interaction energies between LC and surface of alignment layer, and effective LC order.
2.4.1 Alignment techniques
Homogenous alignment of liquid crystal molecules on the surface of alignment layers can be achieved by a variety of methods. It could be highly uniform with desirable alignment parameters, such as selective pretilt angle and strong anchoring energy which play very important roles to the electro-optical performance of LCD
Homogeneous alignment Homeotropic alignment
devices. In general, liquid crystal alignment techniques can be divided into two main types, contact and non-contact method. Mechanical rubbing represents contact alignment method. Non-contact alignment method consists of oblique evaporation technology [15], photoinduced surface alignment [15-16], plasma treatment [17-21], and ion beam treatment [22-23]. Mechanical rubbing is adopted as the liquid crystal alignment method in this thesis.
2.4.2 Alignment materials
The quality of LCDs depends not only on the alignment technique but also on the alignment materials. A diversity of materials is tested as alignment materials for rubbing treatment such as polyvinyl alcohol, nylon, acrylics polymers, vinyl polymers, polyimide, ect. Among these materials, polyimide (PI) has been the dominate alignment material in the LCD market due to its outstanding benefits, for example, stability, superior electric characteristics, strong aligning ability, good electro-optical property, strong anchoring energy. However, the baking temperature over 2000 C is the critical drawback which limits the applications of polyimide for flexible substrates in flat panel liquid crystal displays.
In this research, different polymers having low baking temperature are tested as alignment materials.
1.5 Motivation and Objective
The rubbing method on polyimide surface has dominated the alignment films’ preparation for LCDs production. However, its major limitation is curing temperature over 2000C that is required for the film preparation. This is a considerable
disadvantage in applying polyimide into various flexible substrates.
As a result, new alignment materials for low temperature process are the emerging needs of energy conservation. In this thesis, various polymers containing distinct functional groups induced by mechanical rubbing technique such as polystyrene sulfonic acid (PSSA), poly (4-vinylphenol) (PVP), and polyvinylpyrrolidone (PVPD) are tested as new liquid crystal alignment materials in comparison with known materials, including polyimide (PI), polyvinyl alcohol (PVA), and polystyrene (PS). The process temperature for these materials can be as low as 1100C. The fabrication process of LC cells will be described in detail in the chapter 4. The commercial available indium-tin oxide (ITO) glasses are cleaned by standard process. After that, polymers tested as liquid crystal alignment layers are coated on the clean ITO glasses. The surface morphology of these new materials is observed by AFM. These alignment layers are treated by the mechanical rubbing method. Two substrates with their rubbing directions perpendicular each other are assembled to make TN cells. The cell gap of TN cell is controlled approximately 5 m by spacer and the space between two substrates is filled with the nematic LC E7 (Merck). The electro-optical performances of TN cells made from different alignment materials are investigated. Furthermore, antiparallel cells filled with the mixture of LC and dye are prepared to measure the order parameter. The polar anchoring energy is also examined to evaluate the aligning ability of new alignment materials. Moreover, the orientational order of chemical functional groups of alignment layers will be studied by surface-sensitive and polarization-dependent near X-ray absorption fine structure spectroscopy.
1.5 Organization of This Thesis
This thesis includes five main chapters. Chapter 1 introduces general information about liquid crystal displays. In chapter 2, the fundamental principle of PEEM using Synchrotron Radiation Source and the alignment mechanism of mechanical rubbing method are presented in detail. Chapter 3 describes measurement instruments which are used to examine the surface morphology, the order parameter, the electro-optic characteristics of TN cells, the polar anchoring energy, the preferential orientation order at the surface of alignment materials induced by rubbing treatment such as AFM, UV-Visible Spectroscopy, Electro-optical measurement system, LCAS, NEXAFS, respectively. The experimental results and discussion about the performance of TN cells using different alignment materials as well as the molecular orientation at rubbed alignment layer surfaces are clearly revealed in chapter 4. Finally, chapter 5 gives a conclusion of the whole research in this thesis and future work.
Chapter 2
Principle of Liquid Crystal Alignment and Near Edge X-ray
Absorption Fine Structure (NEXAFS) Spectroscopy
2.1 Mechanical Rubbing Technique
It can not be denied that a variety of surface treatments are able to obtain a homogenous alignment of LC layer. Among the possible surface treatments, mechanical rubbing of polymer surfaces is the most popular technique used to align liquid crystal molecules for the mass production in the LCD market. Rubbing method has been dominated for alignment technologies in terms of its simplicity, convenience and low-cost products. In the mechanical rubbing process, the surface of alignment layers is rubbed with a cloth during the rubbing procedure. The direct contact between the surface of alignment layer and the cloth is the main reason causing static electricity and dust which are serious problems of rubbing process, restricting the expansion of large size LCDs products.
2.1.1 Rubbing strength
Mechanical rubbing is found out as an effective method to align liquid crystal molecules over many decades by Mauguin [24]. Mechanical rubbing is generally carried out by moving the substrate with a constant velocity under a rotating roller covered with a velvet cloth, as depicted in Fig. 2-1.
The rubbing force is varied with the rubbing process parameters such as the roller diameter, the rotation speed, the substrate advancing speed, number of rubbings, and the pile impression (the depth of the rubbing cloth pressed down by roller), as shown in Fig. 2-2. The rubbing strength (RS) is defined as below [25]:
2 / 1
NM rn V
RS
Where N is the number of rubbings, M is the pile impression (mm), n is the rotation speed of the roller (s-1), V is the advancing speed of the substrate (mm/s), and r is the radius of the roller (22.5 mm). The RS is given in mm unit.
Rubbing parameters strongly influence the performance of LC devices, particularly, the electro-optical properties, pretilt angle, and anchoring energy [25].
Fig. 2-2 Schematic of mechanical rubbing process
Pile impression has great effects on rubbed alignment layers. The number of rubbings is related to the rubbing density and weak rubbing density causes poor electro-optical characteristics and non-uniform alignment.
2.1.2 Alignment mechanism induced by rubbing method
The understanding of alignment mechanism induced by rubbing treatment is not only an interesting theory but also an important industrial issue. A series of questions are proposed to satisfy the curiosity about alignment mechanisms as a result of rubbing treatment. What happens to the alignment layer as its surface is rubbed? Why such rubbed polymer surfaces can align liquid crystal molecules in a specific direction? Why can only some polymers produce good alignment? Many hypotheses are pointed out to explain such mysterious phenomenon. In the early period, one possibility was given that aligning ability of LC molecules on the surface of alignment layer was due to the grooves or scratches induced by the rubbing process. The LC molecules will reorient along the grooves created on rubbed alignment layer. Thus, the surface morphology of the rubbed surfaces was particularly considered, which was examined by scanning tunnel microscope (STM) and atomic force microscope (AFM) [26-29].
In the early stages, the alignment mechanism induced by rubbing treatment was explained based on the appearance of grooves or scratches on the rubbed surfaces [30]. However, such a mechanism is impossible to explain the behavior of alignment in many cases. Strong aligning ability of some rubbed polymer surfaces was found out even having no evidences of scratches or grooves [31].
Another concept for the alignment mechanism was that polymer chain orientation can act to align liquid crystal [31]. The polymer film was caught between one stationary (substrate) plane and the other moving (the fiber contact area) plane. As a
result, the polymer exhibited a shearing force. Shear deformation created by such shearing force can be obtained by rubbing process, as illustrated in Fig. 2-3. Fig. 2-3 (a) describes a polymer film contacting with a moving fiber of rubbing material. Fig. 2-3 (b) depicts a form of deformation under a shearing force. Fig. 2-3 (c) and (d) illustrate an extreme parallelogram form produced by the effect of large shear deformation. It was known that the orientation of the polymer chains could induce birefringence which is due to the difference in refractive index for light polarized parallel and perpendicular to the polymer chains. Fig. 2-4 shows the plot of retardation of different materials induced by rubbing method. All rubbed surfaces exhibited positive retardation, except for rubbed PS showing negative retardation. Positive retardation pointed out that the slow axis was parallel to direction of rubbing and negative retardation indicated that the slow axis perpendicular to rub axis.
Fig. 2-4 Plot of retardation induced by rubbing
The existence of birefringence demonstrates the orientation of the polymer chains induced by the rubbing method. Such orientation happened through a shearing deformation of the polymer film and this deformation accumulated in narrow streaks during the rubbing process. In this hypothesis, the streak accumulation and shearing force were the main mechanisms of the rubbing treatment.
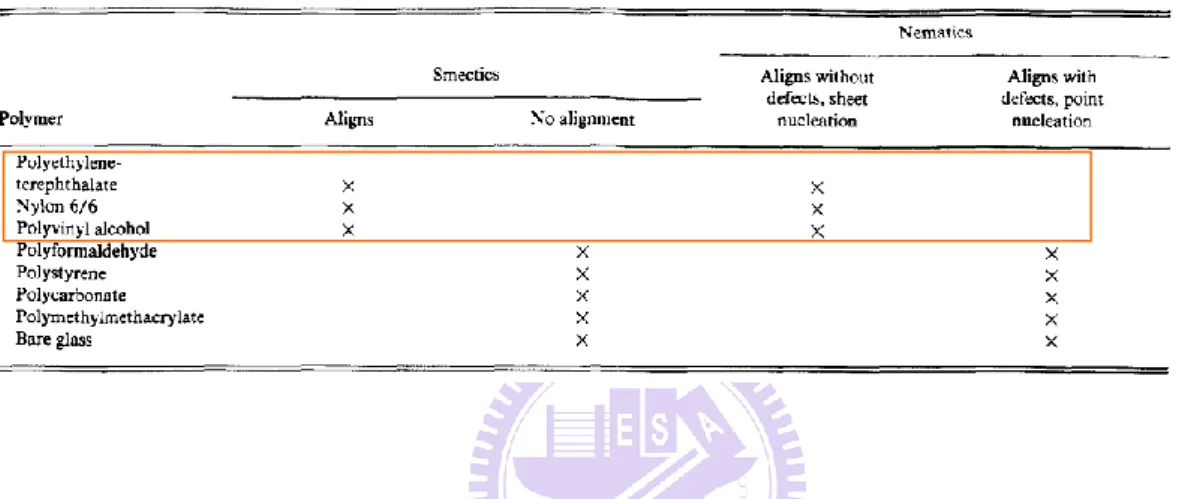
Table 2.1 describes the aligning ability of various rubbed polymer films. Those rubbed polymer surfaces were divided into two categories. The first category included rubbed films having strong aligning ability while the second category consisted of rubbed polymers causing weak alignment in the nematic material. The polymers of the first category were highly crystalline materials, while those of the second category were strongly amorphous. The crystallinity of the polymer was considered as the difference in aligning ability of these two categories. Therefore, both polymer chain orientation and polymer crystallinity are the necessary conditions for alignment induced by rubbing treatment in this hypothesis.
In company with the appearance of surface-sensitive techniques, thorough insights into the alignment mechanism have been gradually understood obviously. In general, liquid crystal alignment originates from symmetry breaking at the surface of the polymer substrate [32]. A microscopic bond orientation model for liquid crystal
alignment by rubbed polymer surfaces, examined by surface-sensitive and polarization dependent near X-ray absorption fine structure (NEXAFS) measurements, was proposed by J. Stohr group [32-34]. Based on NEXAFS spectra, Stohr groups proposed the LC alignment model based on the existence of a statistically significant unidirectional bond asymmetry at polymer surface. In this model, the LC direction followed the preferential orientation of the phenyl rings which was explained in terms of the preferential chain segment alignment through a pulling action of the rubbing cloth fibers. This model demonstrated that the LC alignment was not related to the crystalline order of rubbed polymer surfaces.
NEXAFS spectroscopy has been a powerful tool to study the origin of alignment process.
To have deeper viewpoints into the alignment process, two different kinds of materials are chosen to examine by NEXAFS measurements, rubbed polyimide and rubbed polystyrene, for a special reason. Rubbed surfaces of these two materials show the opposite behavior of their aligning abilities. Rubbed polyimides align liquid crystal molecules along the rubbing direction with the pretilt angle points toward the rubbing direction. In contrast, rubbed polystyrene aligns LCs perpendicular to the rubbing direction with zero pretilt angle [35-36], as indicated in Fig. 2-5. NEXAFS
measurements clearly indicate the preferential in-plane and out-of-plane asymmetries at the rubbed polymer surfaces.
The orbitals of phenyl rings have a preferred in-plane alignment along the direction perpendicular to the rubbing direction. In the case of rubbed polystyrene, by contrast, there is an increase in the number of phenyl rings with their orbitals along the rubbing direction, as illustrated in Fig. 2-6. The liquid crystal molecules are understood to be preferentially oriented with their long axis perpendicular to the orbitals of the phenyl rings or C=O groups [32-34]. Thus, LC molecules align along the rubbing direction for rubbed polyimide and perpendicular to the rubbing direction for rubbed polystyrene.
Fig. 2-6 NEXAFS spectra recorded by Auger (AEY) and total (TEY) electron yield for rubbed BPDA-PDA polyimide (in the left) and rubbed
96K polystyrene (in the right), with the electric field parallel to x, y and 200 from the z axis
2.2 Near-Edge X-ray Absorption Fine Structure (NEXAFS) Spectroscopy
2.2.1 Elliptically Polarized Undulator (EPU)
The Sasaki type Elliptically Polarized Undulator (EPU) with 5.6 cm magnets is used for the BL05B2 beamline. The elliptically polarized undulator is capable of both delivering high photon flux with energy in the range of 60eV – 1400eV and producing elliptically, right or left circularly, or linearly polarized light.
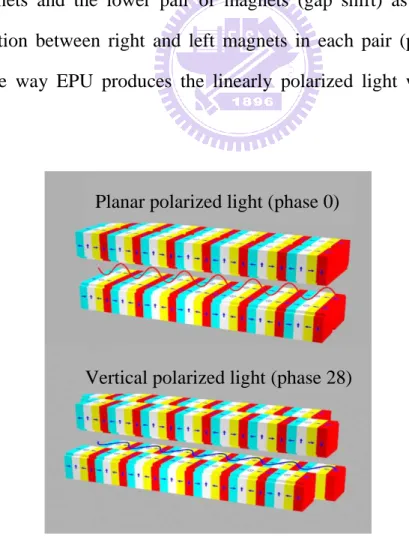
The elliptically polarized undulator is composed of two pairs of permanent magnets arrayed above and below the electron beam [37-38]. The energy and polarization state of light can be varied by changing the gap width between the upper pair of magnets and the lower pair of magnets (gap shift) as well as shifting the relative position between right and left magnets in each pair (phase shift). Fig. 2-7 illustrates the way EPU produces the linearly polarized light which is used in my experiment.
Fig. 2-7 The formation of linearly polarized light by EPU Planar polarized light (phase 0)
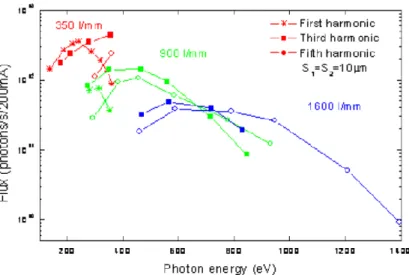
Fig. 2-8 describes photon flux spectrum of EPU as well as the used corresponding grating as a function of photon energy.
2.2.2 Photoemission Electron Microscopic (PEEM)
Fig. 2-9 PEEM station at EPU
Fig. 2-9 is a typical photograph of Photoemission Electron Microscopic (PEEM) end station at EPU beamline in NSRRC. The PEEM [39] end station is located at beamline BL05B2. PEEM is a “photon in – electron out” technique. X-ray PEEM (X-PEEM) using linearly polarized soft X-ray is determined to investigate the molecular orientation of rubbed polymer surfaces by combining high spatial resolution imaging with near edge X-ray absorption fine structure (NEXAFS) spectroscopy [40-41]. NEXAFS measurements used in my experiment will be presented in detail later.
2.2.3 The operation principle of NEXAFS measurements
The microscopic origin of liquid crystal alignment on rubbed polymer surfaces has been discussed since its discovery in 1911 [42]. The alignment mechanism is of significant technological problem because flat panel displays are mainly based on the light transmission from the back to the front of display through the orientation changes of liquid crystal molecules [43-45]. As a result, discovering the origin of the alignment mechanism has become imperative issue, challenging and attracting too much attention to researches.
A series of diverse measurement techniques has been suggested to investigate the molecular orientation at rubbed polymer surfaces, for example, atomic force microscope observation [27], bulk-sensitive optical measurements [31, 46], infrared (IR) birefringence studies [31, 47], surface sensitive studies using optical second-harmonic generation (SHG) [48], X-ray photoelectron spectroscopy (XPS), X-ray diffraction [49], the near edge X-ray absorption fine structure [32-34, 40, 50-63], and grazing incidence X-ray scattering (GIXS) [64-66] techniques. Among these technologies, polarization-dependent near edge X-Ray absorption fine structure
spectroscopy has been applied to the study of liquid crystal alignment in recent years.
NEXAFS is also called X-ray absorption near edge structure (XANES). The term NEXAFS is typically used for soft X-ray absorption spectra and XANES for hard X-ray spectra. Near edge X-Ray absorption fine structure spectroscopy mentions to the absorption fine structure close to an absorption edge, about the first 30eV above the actual edge while extended X-ray absorption fine structure (EXAFS) refers the higher absorption energy region, as illustrated in Fig. 2-10. NEXAFS region usually shows the largest variations in the X-ray absorption coefficient and is often dominated by intense, narrow resonances.
Fig. 2-11 NEXAFS spectrum of different elements in a polyimide polymer Fig. 2-10 Illustration of absorption region of XANEX and EXAFS
NEXAFS is element-specific with respect to different energies of the X-ray absorption edges of different elements, as shown in Fig. 2-11. NEXAFS is of high sensitivity to the chemical bonding environment of absorbed atoms. Furthermore, these fine structures vary with different positions and the surroundings of absorbed atoms, as seen in Fig. 2-12. Overall, NEXAFS has the ability of partial chemical bonding environmental identification.
Polarization dependence is another remarkable benefit of NEXAFS spectroscopy due to the anisotropy of transition dipole moments. In NEXAFS measurements, linearly polarized X-rays are the best light source for the covalent systems like low-Z molecules, macromolecules and polymers, which possess directional bonds [41]. In this case, the electric field vector of the X-ray is like as a "search light" that can seek the direction of chemical bonds of the atom selected by its absorption edge [67].
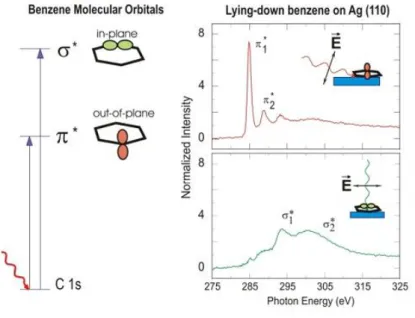
Fig. 2-13 shows polarization dependent NEXAFS spectra for benzene chemisorbed on Ag (110), demonstrating the ability of the molecular orientations. Benzene (C6H6) has unoccupied orbitals of σ and π symmetries which are oriented in and perpendicular to the ring plane, respectively. When the electric field vector E aligns along the surface normal, absorption intenstiy due to the out-of-plane π orbitals
are enhanced and when the electric filed vector E is parallel to the surface, resonant intensity due to the in-plane σ orbitals are dominant. This evidence confirms that benzene lies down on the Ag surface. The intensity of absorption is proportional to the amount of the specific chemical bonding. By changing the incident angle and the direction of polarization, the information of directional chemical bonding can be obtained.
Fig. 2-13 Polarization dependent NEXAFS spectra of benzene chemisorbed on Ag (110)
NEXAFS spectroscopy is one of the operation modes of photoelectron emission microscopy. Two main ways used to record NEXAFS spectra are transmission (also called total electron yield) and electron yield (often called Auger electron yield) measurements, as depicted in Fig. 2-14 [67]. The sampling depth in total electron yield (TEY) spectra is estimated to be about 10 nm, while Auger electron yield (AEY) spectra probe only the first nanometer from the surface [58, 67]. Total electron yield technique is studied in this thesis.
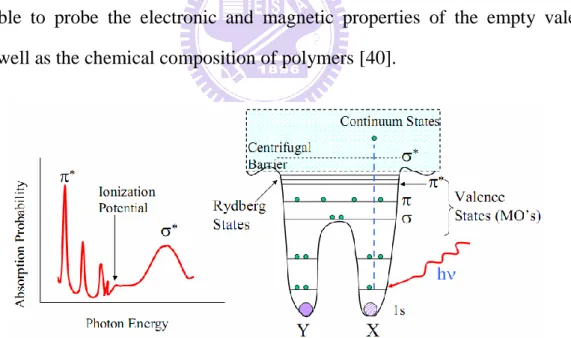
The operation principle of NEXAFS is involved the excitation of core electrons, as described in Fig. 2-15. NEXAFS spectra are formed by resonances arising from transitions from the 1s core level to unoccupied molecular orbitals of * and
*
symmetries, corresponding to peaks observed in NEXAFS spectra. Since such states are specific to the bonding within different functional groups, NEXAFS spectra are possible to probe the electronic and magnetic properties of the empty valence levels as well as the chemical composition of polymers [40].
Chapter 3
Measurement Instruments and Sample Fabrication
3.1 Introduction
In this chapter, measurement instruments which are used to investigate the performance of alignment materials are described in detail. The surface uniformity of each alignment material is tested by Atomic Force Microscope (AFM). The aligning ability of alignment materials are presented through the order parameter which is measured by UV-Visible Spectroscopy. Besides, Electro-Optical Measurement System is used to examine the electro-optic characteristics of TN cells. The polar anchoring energy which affects directly the electro-optic properties is measured by Liquid Crystal Analysis System (LCAS). Moreover, NEXAFS spectroscopy supplies us the information about the preferential orientation order at the surface of alignment materials induced by rubbing treatment.
3.2 Atomic Force Microscope (AFM)
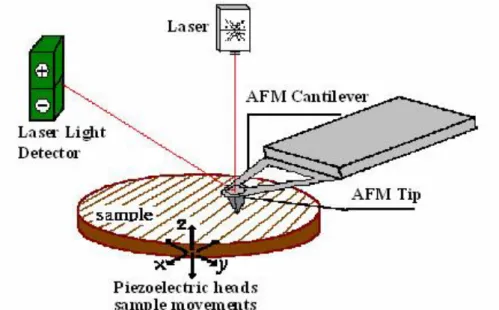
Atomic Force Microscope (AFM) [68] is composed of a sharp tip mounted at the end of a flexible micro-scale cantilever spring to probe the sample surface. The cantilever is often silicon or silicon nitride with radius on the order of nanometers. When the tip approachs the specimen surface, there is appearance of an interaction force between the tip and the specimen, can be explained by Hooke’s law. This force
creates deflection or shift in resonant frequency. The deflection is measured by using a laser spot reflected from the top of the cantilever into an array of photodiodes. To display an image, the interaction between the sample and the tip is mapped to the monitor as a function of position mechanically scanning the sample relative to the tip in a raster pattern into the photo-detector. By detecting the difference in the photo-detector output voltages, changes in the cantilever deflection or oscillation amplitude are determined. A schematic diagram of this mechanism is depicted in Fig 3-1.
There are two major operation modes of AFM:
a. Contact mode
Contact mode is the most common method to operate the AFM in which the tip and the sample remain in close contact as the scanning proceeds. One of the disadvantages of remaining in contact with the sample is that there exists a large lateral force on the sample as the tip is dragged on the substrate.
b. Tapping mode
Tapping mode consists of oscillating the cantilever at its resonance frequency (typically hundreds of kilohertz) and positioned above the surface so that it only taps the surface for a very small fraction of its oscillation period. The laser deflection method is used to detect the root-mean-square (RMS) amplitude of cantilever oscillation. The benefit of tapping mode over contact mode is that it eliminates the lateral, shear forces presented in contact mode, which enables tapping mode to image soft, fragile, and adhesive surfaces without damaging them. In this thesis, the tapping mode is used.
3.3 UV-Visible Spectrometer
3.3.1 Cell Gap Measurement System
For liquid crystal displays, the thickness of cell gap influences seriously the optical performance of the LC cell. Therefore, the cell gap measurement has to be understood in advance as the following procedure of the measurement. The measurement instrument used to measure the cell gap is UV/Vis spectrometer Lambda 950 from Perkin Elmer, and the principle of this method is presented as follow.
UV/Vis spectrophotometer Lambda 950 is operated in the range from visible to ultraviolet spectral with the resolution smaller than 0.17 nm. UV/Vis spectrophotometer is useful for a diversity of applications such as determining the absorption, transmittance, and reflection of materials.
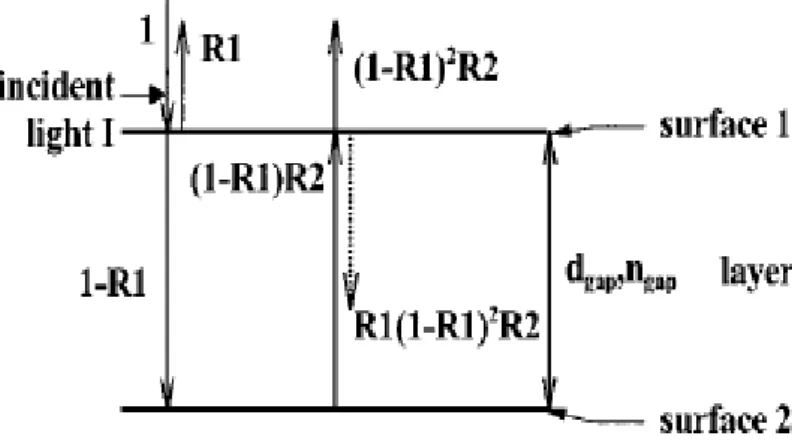
The basic concept of the measurement method is based on the interference of light reflected by the two reflecting surfaces [69-70], as illustrated in Fig. 3-2. The coefficient of reflection R1 is defined as the ratio of the light reflected by surface 1 to the incident light. Besides, R2 is the reflection coefficient of surface 2.
We assume the total incident light is I cost and there is no absorption of light at surface 1 and 2. The total reflected light R can be written as
k
o
k k k kt t R R R t R R
1 cos cos 1 1 1 2 1 1 1 (3-1) Where 2 2/ 1 gap cn and t 2dgapngap2/c
1
0 , c is the speed of light in the
vacuum, is the wavelength, dgap is the thickness of the layer, ngap is the
refractive index of the layer.
The cosine factors in Eq. 3-1 for k>1 are due to internal reflections. Since R1<1 and R2<1, the magnitude of the cosine factors for k>1 is much smaller than that for
k=1. As a result, the internal reflections can be neglected, leading to
ngapdgap t R R t R R 1cos 1 1 2 2cos 4 (3-2)Thus the reflected spectrum is
2 R12
1 R1
2R2
2 2R1
1 R1
2R2 cos
4ngapdgap/
R (3-3)
The periodic term in Eq. 3-3 causes an interference pattern. The periodicity of the reflected interference spectrum determines the optical thickness of the cell gap,
Fig. 3-2 Two reflecting surfaces separated by a layer causing a light interference. The dotted line indicates first internal reflection
gap
gapd
n .
If 1 and 2 are the two wavelengths showing extrema in Eq. 3-3, then
4 /
1cos ngapdgap for 1 and 2. Hence
2 / 2ngapdgap k11 (3-4) 2 / 2ngapdgap k22 (3-5)
Where k1 and k2 are natural numbers. We suppose 1 2, then x
k
k2 1 (3-6)
In which x is a natural number.
Based on Eq. 3-4, Eq. 3-5, and Eq. 3-6, we can obtain
1 2
2 1 4 x d ngap gap (3-7)The value of x-1 defines the number of extrema in R
2 between two wavelengths 1 and 2. It is better to choose the distance x between the two extrema as large as possible in order to improve the accuracy of the calculation ofngapdgap. Anexample of the measurement of a cell with the cell gap 5 m is shown in Fig. 3-3.
3.3.2 Order parameter Measurement
Besides measuring the cell gap of LC cell, UV/Vis spectrometer Lambda 950 is also used to determine the order parameter for various liquid crystal alignment materials. The principle of order parameter measurement is described as below
(3-8)
(3-9)
(3-10) Where S is the order parameter.
, , , are the optical densities (absorbances) and transmittances when the liquid crystal alignment direction of antiparallel cell is parallel and perpendicular to the transmission axis of polarizer, respectively.
is the transmittance before the incoming polarized light goes through the antiparallel cell.
3.4 Electro-Optical Measurement System
The electro-optical measurement system is described in Fig. 3-4. This optical system is responsible for the measurement of V-T characteristics. He-Ne laser is the light source in this system. The intensity of the laser source can be reduced within the acceptable range of the photodetector by using a 10% ND filter. The LC cell is put between a polarizer and an analyzer. The LC cell is driven by a waveform generator WFG500 from FLC Electronics AB which is connected with computer through GPIB interface. Any waveforms can be designed with the maximum output voltage for
// //
2
A
A
S
A
A
//A
log o I A I // // log o I A I A
I
//I
0I
100V
and the minimum pulse width for 200ns. The moderate unpolarized light becomes a polarized light after passing through the polarizer and then enters the LC cell. The LC cell acts as a phase modulator, changing the phase of the incident polarized light by retardation nd (n is the birefringence of LC and d is the thickness of LC). After that, the modulated light goes through the analyzer and the optical signals output are obtained by the photodetector PIN 20 from FLC Electronics AB as well as observed with the oscilloscope from Tektronix or the multimeter from Keithley. The V-T curve is recorded by using bipolar square wave 1 kHz.
3.5 Anchoring Energy Measurement
Anchoring energy is used to describe the interaction between liquid crystal molecules and the alignment layer. Anchoring energy is an important factor in liquid crystal alignment, influencing directly the electro-optical performance of TN cells. We can use anchoring energy to quantify the alignment strength and determine the
He-Ne Laser Photodetector Specimen Analyzer Polarizer ND Filter Multimeter Send Data Send Data Sending signals Sending waveform
feasibility of liquid crystal alignment method. Anchoring energy can be separated into two kinds: polar anchoring energy and azimuthal anchoring energy. The strength of polar anchoring energy will affect significantly the electro-optical properties and the tilt angle of liquid crystal while the strength of azimuthal anchoring energy will influence the orientational order and the orientation of liquid crystal molecules in azimuthal direction. In general, azimuthal anchoring energy is much smaller than polar anchoring energy so it is more difficult to measure azimuthal anchoring energy. Therefore, in this research, we concentrate on the measurement of polar anchoring energy by Liquid Crystal Analysis System (LCAS). Based on the value of measured polar anchoring energy, we give an explanation for the electro-optical performances of different alignment materials.
A variety of methods were proposed to measure polar anchoring energy such as surface disclination method, Freedericksz transition method [71-72], high electric field method [73-74], and capacitance method [75]. In this thesis, we use the capacitance method to determine polar anchoring energy of various alignment materials. The principle of the capacitance method is described in detail as below.
We consider a cell filled with positive dielectric anisotropy LC and rubbed anti-parallel direction. When no electric field is applied, all LC molecules are aligned parallel to the alignment direction on the surface of alignment layer. When the applied voltage is larger than the threshold voltage, LC molecules begin to tilt. Almost LC molecules in the cell will tilt up perpendicular to the surface (along the electric field) so the capacitance of the cell will nearly be the same with an increase of applied voltage. Due to the effect of the anchoring strength of LC-surface interaction, the tilted angle of LC molecules near the surface is smaller than that in the middle of the cell. Therefore, we can observe the optical properties of LC cell put in the electric field in order to obtain the polar anchoring energy. The calculation of the polar anchoring
energy is assumed based on the elastic continuum theory.
The capacitance of LC cell is determined by the cell gap d, area of electrodes S and the dielectric permittivity of LC which is a function of the applied voltage. For the high voltage V 6Vth, the capacitance of LC cell can be written as follow
V V Qd S C 0// 1 (3-11) where a th V V // a // a th K V 0 11 dy y y ky p y
1 ) 1 ( ) 1 )( 1 ( 1
// 11 11 33 K K K k 2 sin y yp sin2pS is the electrodes overlapping square.
//
, are the LC dielectric constants parallel and perpendicular to the LC director.
p
is pretilt angle.
11
K , K33 is the elastic constant of splay and bend state.
p p p y y ky Wd K Q 1 ) 1 )( 1 ( 2 1 11 (3-12)
For the small pretilt angle p 100, we have
Wd K
Q 2 11
1
(3-13)
We can find out the polar anchoring energy W from Fig. 3-12. By determining the value of capacitance Cinf at high voltage V , the value of threshold voltage Vth
and using Eq. 3-11, we can obtain
inf // 2 // 2 2 1 1 ) ( 2 C C C C C S V W th (3-14)
Where C is the capacitance of LC cell for planar orientation, can be obtained at the applied voltage smaller than the threshold voltage (V<Vth).
//
C is the capacitance of LC cell for homeotropic orientation, can be obtained at a very high voltage.
Cinf is the infinitive capacitance, can be obtained by a linear approximation fit. By substituting the value of Vth, S, C//, C, and Cinf into Eq. 3-14, we can calculate the value of polar anchoring energy.
3.6 NEXAFS Measurement
NEXAFS spectroscopy is a powerful tool to study the orientation of functional groups of organic molecules on surface. NEXAFS spectra are measured by resonances absorption arising from transitions of the core level electron to unoccupied molecular orbitals of * and * symmetries. In this research, the near-edge X-ray absorption
fine structure spectra are carried out at the undulator beam line 05B2 EPU-PEEM station of National Synchrotron Radiation Research Center by using linearly polarized soft X-rays. The energy resolution was 100 meV at the Carbon K-shell absorption edge. For the NEXAFS measurements, 0.7 x 0.7 cm2 pieces cut from rubbed polymer samples are used.Polarization-dependent NEXAFS spectra are recorded for in-plane and out-of-plane asymmetries with the electric field vector in the (x,y) plane and (x,z) plane, respectively, at the fixed X-ray incident angle. Both the in-plane and out-of-plane asymmetries at the rubbed surfaces of various new alignment materials will be examined in chapter 4.
3.7 Fabrication Process
3.7.1 Flow chart
ITO glass clean
Spin Coating Alignment Layer
Rubbing
Assemble Cell
Cell Gap Measurement
LC Injection
Measurement
Thickness and Uniformity NEXAFS Measurements UV-ozone Baking Spacer, UV UV-Vis Spectroscopy AFM 05B2 EPU PEEM Electro-Optical Characteristics Order parameter
Polar Anchoring Energy Laser System
UV-Vis Spectroscopy
LCAS
3.7.2 Fabrication Process
1. The glass is the most common substrate used in liquid crystal display technology. The glasses with the thickness of 1.1 mm are uniformly sputtered by ITO in one side to make the conductive layers on the surface of the glasses. Small glass pieces of 2 cm x 2.5 cm are cut from the big one by the cutting machine and marked the side containing ITO.
2. Clean substrates are very essential for the quality of all devices in general and LC devices in particular. Firstly, a holder containing 20 pieces of ITO glass is rinsed by DI water for 5 minutes. Next, each piece of ITO glass is covered with detergent solution and carefully rubbed by hands. Thirdly, ITO glasses are washed with deionized (DI) water. A remarkable sign to recognize the clean ITO glasses is that DI water can flow smoothly along their surfaces. Then, the holder loads the clean ITO glasses is immersed into clean DI water for 5 minutes and in ultra sonic for 40 minutes. After that, nitrogen gas is used to blow off water from the surface of ITO glasses. Finally, these clean ITO glasses are baked at 1100 C for 30 minutes to completely evaporate water on the surface.
3. In order to have better adhesion and hydrophilic of alignment layer, the surface of clean ITO glasses is treated by UV-Ozone for 30 minutes. A mixture solution is formed by mixing each material and its own solvent. The weight ratio of the mixture solution is controlled to get suitable thickness of alignment layer less than 100nm for display applications.
Clean ITO glasses are put on the truck of spin coater. The formation of uniform alignment layer on the surface of samples is processed by the following steps. Firstly, the pure solvent is drop on the whole surface of ITO glasses and spin. Secondly, these glasses are totally covered with the mixture solution and spin. Then, these samples are
baked to appropriate temperature for 1 h to remove the solvent and to relax the films. The parameters of spin coating process of alignment materials are shown in detail in Table 3-1.
Time (sec) Speed (rpm)
Solvent-waiting 5.0 0 Solvent-waiting 0.8 800 Solvent-low spin 10 800 Solvent-waiting 3.2 4000 Solvent-fast spin 20 4000 Solvent-waiting 5 0
Table 3-2 indicates specific parameters of various materials, namely, solvent of each material, the weight ratio for the mixture solution, the thickness of alignment film, and the baking temperature for each material.
Time (sec) Speed (rpm)
Mixture solution-waiting 5.0 0
Mixture solution-waiting 0.8 800
Mixture solution -low spin 30 800
Mixture solution -waiting 3.2 4000
Mixture solution -fast spin 60 4000
Mixture solution -waiting 5 0
Table 3-1 Specific parameters of spin coating process for solvent (top) and mixture solution (bottom)
4. The samples are rubbed by rubbing machine. The rubbing directions of top and bottom samples are perpendicular to each other to make a twisted nematic cell.
5. UV glue (NOA-65, from Norland) is mixed with 5% of 5.0um spacer. A small amount of above mixture is dropped at the edges of the bottom sample which is covered and uniformly pressed by the top sample, making an empty cell. Then, the empty cell is placed under a UV lamp for 5 minutes to fully cure the glue.
6. The cell gap of the empty cell is measured by UV/Vis Spectrophotometer Lambda 650 using interferometric method, is explained in detail in section 3.3.1.
7. The nematic liquid crystal (E7, from Merck) is injected into the empty cell by capillarity phenomenon, finishing a LC cell (as depicted in Fig. 3-6).
8. The ITO contact of LC cell is soldered by the wire, available for the electro-optical measurements.
Material PI PVA PS PSSA PVP PVPD
Solvent NBC-311 Water Toluene Water Pentanol Water Weight Ratio 50% 2.5% 0.5% 2.4% 0.5% 0.1%
Thickness 34nm 66nm 39nm 36nm 37nm 10nm
Temperature 2200 C 1100 C 1500 C 1100 C 1500 C 1100 C
Table 3-2 Specific parameters of different materials
Chapter 4
Experiment Results and Discussion
4.1 Surface Morphology of Alignment Materials
In this thesis, a variety of polymers having distinct chemical functional groups are tested as new liquid crystal alignment materials, namely polystyrene sulfonic acid (Mw = 75,000 from Alfa Aesar), poly (4-vinylphenol) (Mw = 8,000 from Sigma-Aldrich), and polyvinylpyrrolidone (Mw = 40,000 from TCI). Moreover, the performances of the other alignment materials such as polyimide (PIA-X201-G01 from Chisso), polyvinyl alcohol (Mw = 13,000-23,000 from Sigma-Aldrich), and polystyrene (from Alfa Aesar) are also examined to compare with those of new alignment materials. The glass transition temperature Tg of new materials is over 1500
C. The chemical structures of alignment materials presented in my thesis are described in Table 4-1.
Besides the phenyl rings in side chain like PS, the prepared polymers PSSA and PVP also contain additional specific chemical functional groups, namely, HSO3 and
OH in turn. The comparison in the performances of rubbed PS, PSSA, and PVP helps us realize whether the chemical functional groups play any role in liquid crystal aligning ability.
Among these materials, PVPD is one kind of non aromatic carbonyl containing polymers, having carbonyl group in the side chain and no phenylene in the main chain [76]. Particularly, the side chain of PVPD contains carbonyl groups connected with five-sides rings rotate freely in its side chain.
Besides, PVA is one type of saturated polymers which include only single bonds in their structure. The side chain of PVA is only composed of OH groups in specific. The aligning abilities of those materials in Table 4-3 are evaluated through their whole performances.
For LCD device applications, uniform alignment of liquid crystal molecules on the surface of alignment layer is of great importance because of LC-surface direct interaction. The surface morphology of all materials presented in my thesis is observed by atomic force microscope.