Cultural Differences in the Allocation of Attention to
Information Architecture Components
Wei Jeng
1, Hsin-Yuan Hu
2, Gao-Ming Tang
3, Shih-Yi Chien
4Abstract
Well-designed web information architecture (IA) supports the findability and usability of web content, with the wider aim of ensuring efficient, positive user experiences. Accordingly, this study investigates cultural differences in how web visitors allocate their attention to the four main IA components: labeling, organization, navigation, and searching. We conducted a user study with 33 student participants from Taiwan and the United States, comprising observation tasks, note-taking sessions, and questionnaires regarding participants’ attention allocation, as well as background questionnaires covering demographic, cultural, and personal factors. Our results indicated that, in general, the less complicated content a website displayed, the more aware the participants were of IA and its components. We also found that the US participants usually paid more attention to text labels on a webpage, whereas their Taiwanese counterparts were more likely to evenly distribute their attention across both text and image objects. These results shed new light on the cultural specificity of how existing IA is interpreted in global web communities and thus have important implications for future IA design.
Keywords: Information Architecture; Web Design; Cultural Dimensions
1 Department of Library and Information Science, National Taiwan University, Taipei, Taiwan 2 Kantar Taiwan, Taipei, Taiwan
3 Heinz College of Information Systems and Public Policy, Carnegie Mellon University, USA 4 Department of Management Information Systems, National Chengchi University, Taipei, Taiwan
* Corresponding Author: Wei Jeng, E-mail: wjeng@ntu.edu.tw
1. Introduction
Information Architecture (hereafter: IA) is the art and science of organizing and labeling information objects to facilitate website users’ seamless search and navigation activities, and thus to provide a positive overall user experience (Rosenfeld, Morville, & Arango, 2015). Rosenfeld et al. (2015) dissected IA into four aspects, namely organization system (how information is categorized and structured), labeling system (how information is named to convey the proper
message), navigation system (how one can easily locate themselves and find the needed information through browsing), and search system (how one can actively input search terms to locate specific information).
English-language content dominates today’s World Wide Web, the total number of non-English-speaking Internet users, notably in Chinese and Spanish, have both grown dramatically over the past decade, the sum of which is over one billion as of March 2020 measured by Internet World Stats (Internet World Stats, 2020). However, since
the majority of IA principles and practices are rooted and tested in English-language web content, few empirical IA studies have examined IA’s characteristics or influences across Anglophone and non-Anglophone cultures. Some prior studies touching on cultural characteristics of web design have been conducted, but have either focused on aesthetic judgments (Cyr & Trevor-Smith, 2004) or been non-empirical in character (Marcus & Gould, 2000). If the goal of the IA is to help users understand and manage information and allow users to make corresponding and correct decisions, we are curious that today, people generally believe that cultural roots will affect people’s decisions.
To deepen understanding of this topic and stimulate further discussion, we conducted a study of how web visitors from two cultures, one Anglophone and one non-Anglophone, allocated their attention to the four key aspects of an IA: namely, labeling, organization, navigation, and searching. In addition to attention allocation, we sought to capture the participants’ perceptions and preferences on web components regarding a website. In this study, we used the term web component to refer an element that provides affordance and functions for the users allowing for navigating or searching on a website. For example, as a web component, a search box on the right upper corner allows users to type in their query and actively search information on the site.
These investigations were guided by the following two research questions:
(1) How are web visitors’ cultural backgrounds associated with their attention allocation to web components?
(2) How are Anglophone and non-Anglophone web visitors’ preferences and perceptions regarding these components associated with each of the four main IA components (labeling, organization, navigation, and searching)? Our results are expected to contribute to information-science theorists and practitioners in two ways. First, they should be helpful to web developers and designers tasked with customizing websites in accordance with the expectations and habits of non-Anglophone societies, thus enhancing their work’s long-term sustainability. Secondly, on a theoretical level, they may modify Geert Hofstede’s work on the cultural dimensions of website design, in light of the rapid and extensive change in such design that has occurred in the half-decade since his final writings on that topic (Hofstede, Hofstede, & Minkov, 2010).
2. Literature Review
2.1 Cultural dimension
With regard to cultural characteristics, the most relevant prior frameworks include Hall’s concept of high-context and low-context cultures (Hall, 1976) and Hofstede’s cultural dimensions theory (Hofstede et al., 2010). The former uses the terms high and low context to describe how explicitly people encode messages in their communication. A high-context message not only can be communicated through language and rules, but also encoded and decoded through personal status and/or other contextual elements such as bodily gestures and facial expressions. Conversely, in a low-context culture, messages are mainly handled through wording or other protocol that is explicitly announced. Hofstede’s theory presents a
more categorical structure for describing different countries’ cultural differences (Hofstede et al., 2010), amounting to a cross-cultural conceptual framework that measures every culture in six dimensions. These are: Power Distance (PDI), the extent to which the less powerful accept and expect that power is unequal; Individualism (IDV), the degree to which people in a society are integrated into subgroups; Uncertainty Avoidance (UAI), the extent to which a society is tolerant of ambiguity; Masculinity (MAS), a society’s preference for achievement, heroism, assertiveness, and material rewards for success; Long-term Orientation (LTO), the connection of the past to current and future actions; and Indulgence (IVR), a society’s allowance for free gratification related to enjoying life.
2.2 Cultures and web-design components
Literature on the relationships of cultures and web-design components – mostly rooted in Hofstede’s cultural dimensions theory – began appearing in the 2000s. Marcus and Gould (2000), for example, compared how website interfaces differed across the spectrum of cultural dimensions, and reported that in high-PDI cultures, websites are usually very structured and focused on the representation of authority or expertise; whereas in high-UAI cultures, website interfaces are usually simple, with limited choices and restricted amounts of data, to prevent users from feeling lost. Singh and Pereira (2005) developed the Cultural Values Framework to identify the relations between features of websites and cultural factors, based on websites sampled from four countries, and reported results consistent with Hofstede’s and Hall’s theories. El mimouni and
MacDonald (2015) investigated 60 US English and Arabic websites’ main-page navigation hierarchical features, navigation diversity, number of hyperlinks, search options, and so forth, guided by Hofstede’s PDI dimension and Marcus and Gould’s (2000) elements of design. With the exception of navigation diversity, the focal aspects were confirmed to differ significantly between the two cultures, suggesting that cultural differences are associated with developers’ choice of web components.
Cyr and Trevor-Smith (2004) examined whether webpages in different cultures exhibited differences in web design in terms of eight design facets: language usage, layout, symbols, content/ structure, navigation, links, multimedia, and colors. Cyr and Trevor-Smith reported that most of the design facets were found significant different, excepting layout and multimedia, from German, Japan and US webpages in their investigations. The results provided evidence on there are design preferences across cultures. Goyal, Miner, and Nawathe (2012) later utilized Cyr and Trevor-Smith’s coding scheme to analyze whether cultural differences were manifested in designs of government websites from Brazil, Russia, India, China, and the US, and confirmed that they did, especially between China and the US. They also noted, however, that the sampled Brazilian, Russian, and Indian websites contained relatively few design features that could be deemed to reflect those countries’ respective cultures.
2.3 Users’ perception of stimuli in different cultures
Web visitors’ perceptions tend to be different across cultures even receiving the same stimuli. Several studies in the field of psychology have
addressed how people in different culture see and process same information differently. Chua, Boland, and Nisbett (2005) identified differences in the cognitive styles of East Asians and Westerners, and argued that these lead to different behaviors when viewing the same scenes (Boduroglu, Shah, & Nisbett, 2009). Specifically, they reported that East Asians tended to pay more attention to background context, whereas Westerners typically chased focal objects within the scene. This can be taken to reflect that East Asians value the concept of harmony and view things in a relatively holistic way, while Westerners tend to be more analytical and goal-driven. Singh and Pereira (2005) also pointed out that web users tend to have more agreement toward Web elements that are similar to their own cultural traits.
Taken together, the aforementioned studies provide an important foundation for the study of how cultural characteristics influence web design. However, some offer little empirical evidence (e.g., Marcus and Gould, 2000), and most were not carried out in the past decade. As well as bringing research based on Hofstede’s cultural dimension theory up to date, the goal of our study comprises an empirical experiment, thereby helping to fill both of these gaps.
3. Methodology
3.1 Research design
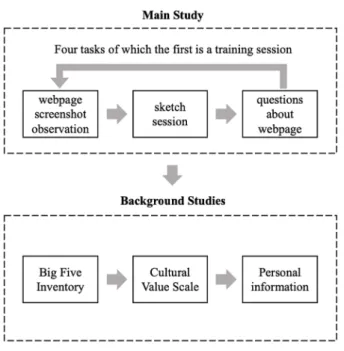
We decided to capture web visitors’ attention allocation and measure their perceptions and preferences regarding our four focal IA components via a laboratory experiment. Each experimental session was divided into two sequential sessions, the main study and
background studies, which are respectively discussed in detail in subsections 3.2 Main Study and 3.3 Background Studies.
Following Chien, Lewis, Sycara, Liu, and Kumru (2016), all Chinese-language versions of questions in both the main and background studies were translated into Traditional Chinese characters, and Chinese-language responses received in both studies were translated into such characters, if necessary, to facilitate comparison among all Chinese speakers’ responses.
3.2 Main study
In the main study, the participants were asked to observe four websites, the first as a training/ practice session, and answer a series of IA-related written questions about each of them. Because a website’s appearance and content may change at any time, we used a screenshot of each one to avoid biases that might otherwise have been caused by different participants seeing different content or layouts. Although using screenshots instead of live links limited how the participants could interact with each website (e.g., their mouse-clicks received no responses), they were still able to scroll up and down the webpage to browse it. Based on the results of a pilot testing we conducted with 10 college students, we had no reason to believe that viewing a static picture vs. live links would materially affect our investigation of the main study participants’ attention allocation. In line with previous studies’ findings that there was no apparent difference in attention allocation between a 5-second viewing limit and longer limits (Gronier, 2016; UsabilityHub, 2019), each participant in our main study was encouraged to spend up to 2 minutes observing each webpage.
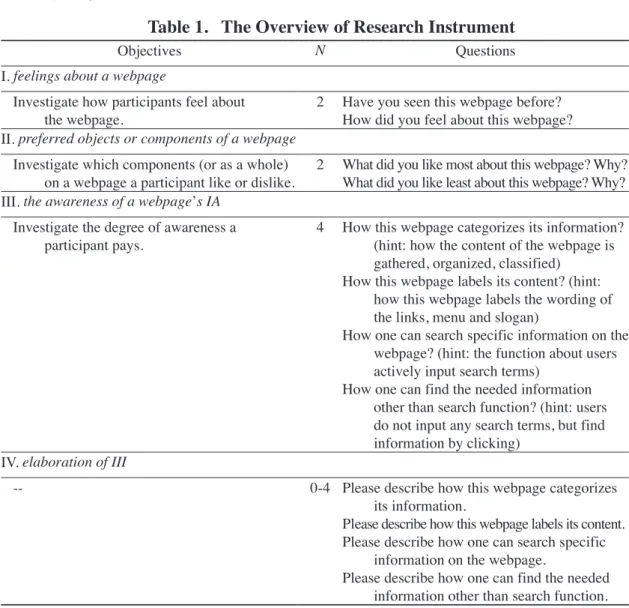
Table 1. The Overview of Research Instrument
Objectives N Questions
I. feelings about a webpage
Investigate how participants feel about
the webpage. 2 Have you seen this webpage before?How did you feel about this webpage? II. preferred objects or components of a webpage
Investigate which components (or as a whole)
on a webpage a participant like or dislike. 2 What did you like most about this webpage? Why?What did you like least about this webpage? Why? III. the awareness of a webpage’s IA
Investigate the degree of awareness a
participant pays. 4 How this webpage categorizes its information? (hint: how the content of the webpage is gathered, organized, classified)
How this webpage labels its content? (hint: how this webpage labels the wording of the links, menu and slogan)
How one can search specific information on the webpage? (hint: the function about users actively input search terms)
How one can find the needed information other than search function? (hint: users do not input any search terms, but find information by clicking)
IV. elaboration of III
-- 0-4 Please describe how this webpage categorizes its information.
Please describe how this webpage labels its content. Please describe how one can search specific
information on the webpage.
Please describe how one can find the needed information other than search function.
Note. Group III was measured on a five-point Likert scale ranging from 1 = not at all aware to 5 =
extremely aware.
3.2.1 Design of the research instrument
The main study’s research instrument, which we designed using Qualtrics, an online questionnaire software, consisted of seven open-ended and five closed-open-ended questions. Table 1 lists the overview of questions that we designed in the instrument, whereas the full version of questionnaire is available at OSF (Jeng, Hu, Tang, & Chien, 2021).
The instrument was divided into four groups, the first three themed around a particular concept we wanted to understand.
I. feelings about the webpage (n = 2);
II. likes and dislikes about specific webpage
objects or components (n = 2); and
III. awareness of each of the IA components (n = 4), measured on a five-point Likert scale
ranging from 1 = not at all aware to 5 = extremely aware.
The fourth group, only came into play if the participant assigned a rating of 2 or above to at least one of the focal IA components, and asked how his/ her awareness of that component came about.
The instrument mentioned above utilized an indirect approach when asking a question intended to avoid offering the participants any explicit information about particular IA components. Direct questions toward the researchers’ RQ may be convenient and quick, but participants’ responses may be unreliable in the user study: a participant may wrongly anticipate a researcher’s study inquiry; or, even anticipated accurately, one may intentionally give false information (Stull, 2018). Therefore, in our instrument, rather than ask the question directly to capture their ideas about the navigation system: “Are you aware of
the navigation features in this webpage?”, we
asked, “How could you find information you need
on this webpage, other than by using the search function?” for anchoring a participant’s activities
regarding browsing and navigating the Web content. It is also worth noting that, pilot-study participants had seemed unable to remember some details about the webpage they had been shown. We also observed that some of pilot-study participants were overwhelmed by the tasks, perhaps because they found it stressful to remember what they had just seen, and this could have negatively influenced the quality of data collected. Because participants performed differently upon memorizing details of the webpages shown in our pilot study, we revised the protocol and added into a new session in the Main Study that allows participants to take notes about
what they have just seen. Participants were freely to sketch or write notes in the note-taking session.
3.2.2 Selection of websites
Prior studies on similar topics have often utilized website content from political, charitable, or educational organizations as their experimental materials (e.g., Cyr & Trevor-Smith, 2004; El mimouni & MacDonald, 2015; Goyal et al., 2012). To help keep our results commensurate with that earlier body of work, we utilized the still images of university websites. Because the complexity of a website’s structure may influence users’ attention allocation, we ensured that the sampled websites were of varying complexity levels. In order to ensure the validity of selection, we randomly drew a sample of 15 university websites from the top 100 World University Rankings 2018 (The World University Rankings, 2018). Twenty college students unconnected with this research helped rate each site’s complexity on a nine-point Likert scale based on their perception, with 1 = the least complex and 9 = the most complex.
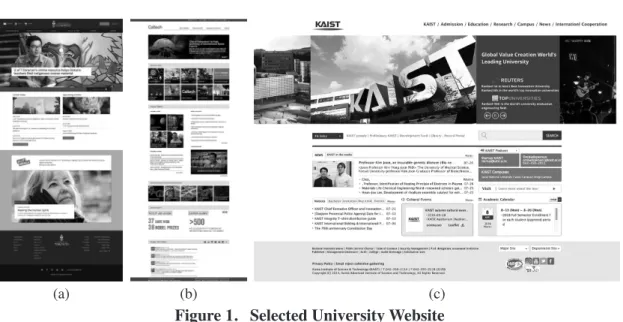
Based on their average scores, we sorted the 15 webpage screenshots in ascending order and grouped them into low, medium, and high complexity groups of equal size, and then randomly drew one from each group. Based on this procedure, the webpages chosen for use in our main study were those of the University of Toronto (U. Toronto), the California Institute of Technology (Caltech), and the Korea Advanced Institute of Science and Technology (KAIST), representing low-, medium-, and high-complexity designs, respectively (Figure 1).
3.2.3 Task design
The above-mentioned training/practice session focused on the University of Washington’s main
page, which was randomly chosen from among the 12 webpages that had not been selected for use in the main study. The three sets of tasks making up the main study itself (i.e., one each for the low-, medium-, and high-complexity pages) were arranged in a Latin Square design. Considering the first-language differences among our participants, we used the default language version of each university’s webpage, but applied an online translation tool where such language differed from that spoken by the participants (i.e., to the KAIST webpage for participants from the US, and to all three webpages for participants from Taiwan).
3.3 Background studies
To investigate the participants’ cultural and personal characteristics, we adapted two instruments for background studies, following the lead of Chien et al. (2016). The first is the
Big Five Inventory (John & Srivastava, 1999), which contains 44 questions about individual personality, such as “I see myself as someone who
is talkative,” “... tends to find fault with others,”
or “... does a thorough job,” responded to on a five-point Likert scale (1 = strongly disagree; 5 = strongly agree). The second is the Cultural Value Scale (CVS) (Yoo, Donthu, & Lenartowicz, 2011), a 26-item instrument also using a five-point Likert scale (i.e., strongly disagree (1) to strongly agree (5)) to assess Hofstede’s five cultural dimensions (PDI, IDV, UAI, MAS, LTO) at an individual level. It is worth mentioning that Hofstede’s cultural dimensions has been supplemented to six dimensions since 2010 (IVR is the latest added). However, as most literature regarding the matter, in the Web context, were still based on the original five dimensions. The CVS, with five dimensions, we applied in this study was considered sound
(a) (b) (c)
Figure 1. Selected University Website
Note. (a) University of Toronto (as low complexity); (b) California Institute of Technology (as medium
and classical to capture cultural characteristics, according to the previous studies.
3.4 Experimental procedure
The experimental procedure is presented in Figure 2. In the laboratory environment where the experiment was conducted, no more than five participants were present concurrently. Each was seated at a computer on which the consent form and research instruments were presented. The note-taking tool described above was also loaded onto these computers.
In the main study section, which took place first for all participants, they were asked to complete four tasks, the first being the above-mentioned training session to familiarize them with the experimental process.
Each participant was first shown a screenshot of a webpage, which they were allowed to spend
up to 2 minutes observing. After the 2 minutes expired (or sooner, if a participant deemed her observation to be finished earlier), the screenshot was taken down from the participant, and the researchers gave the participant a piece of blank sheet for notetaking. While the researchers did not suggest the form of notetaking, most participants were observed to sketch on the sheet. This session would lower the stress of what they have just seen and help them answer the research instrument.
After finishing their notes/sketches for a single screenshot, participants moved to the research instrument. The procedure illustrated in Figure 2 was set to be repeated four times, which means participants observed four webpages.
After completing four tasks, the participants were asked to complete the CVS and Big Five Inventory for the last stage and provide personal-background information, e.g., age, gender,
educational status. The total experiment’s length, including the main study and the background studies session, ranged from approximately 40 to 90 minutes.
3.5 Participants
We sought participants from Taiwan (“TW group”) and the United States (“US group”) who were currently enrolled in tertiary education and had attended K-12 education in their home countries, as shown in Table 2. Recruiting information was disseminated through social media, including but not limited to local online forums, Facebook, and Reddit, and via the Office of International Affairs at a research university in Taipei Area, Taiwan. This resulted in a participant pool of 33 participants (18 females, 15 males), of whom 15 were in the US group and 18 in the TW group, as shown in Table 2. Of the 18 participants
in the TW group, ten were currently enrolled in the graduate program (nine master and one doctoral), and the rest were in undergraduate (n = 8). Four undergraduate students, five graduate students, two language school students, and one faculty member were recruited in the US group; the rest were marked themselves as “Others” but seemed to graduate from higher education within a few years.
3.6 Data analysis
We analyzed both textual and visual data produced by all participants during the experiment, including their descriptions of IA and webpage notes (mostly sketches) from the main study; their scores for awareness as determined by our main research questionnaire; and their cultural values and Big Five scores from the background studies. To achieve the research goal,
Table 2. Participants by Nationality
TW (n = 18) (n = 15)US (n = 33)Total Gender Female 10 8 18 Male 8 7 15 Age 18-24 16 10 26 25-34 2 4 6 35-44 0 1 1 Education/Occupation Undergraduate students 8 4 12
Graduate (incl. master & doctoral) students 10 5 15
Language school students 0 2 2
Faculty member 0 1 1
we further discuss the differential influence of the three web-complexity levels on the perceptions of participants from the two focal cultures. The remainder of this paper focuses on their textual rather than visual productions, and on their cultural values rather than their other background characteristics.
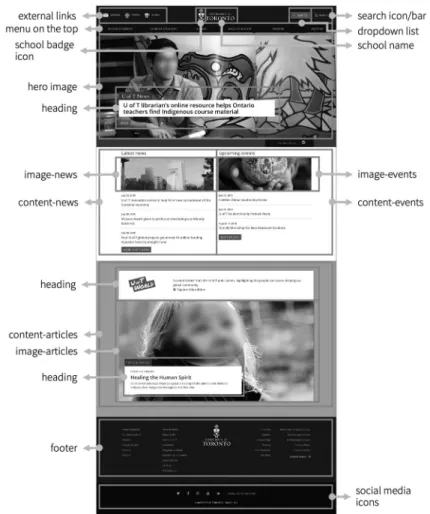
Data Preparation. We framed out the web
components used in three webpages respectively and qualified these components (see example in Figure 3). The qualifiers, i.e., the web components
under controlled vocabularies, were named in a neutral way and revised by our research team in order to clarify and efficiently aggregated the specific components that participants were noticing across different webpages. Secondly, we referred to the descriptions of the four focal IA components provided by our participants and matched them with our qualifiers. For example, in the descriptions of the organizational system of the U. Toronto webpage from participant US04: “future students, current student, alumni, faculty,
donors etc [sic]. close the top of the website, but had a search function in the top right. There was [sic] social media at the bottom too.” We
then coded “menu on the top,” “search icon/ bar,” and “social media icon” respectively for the organizational system (see Table 3 for more examples). After coding every response from both the TW group and the US group that touched on any or all of the four focal IA components, the connections of web components and IAs were produced using Gephi, and are shown in the next section as Figures 5 and 6.
Data Analysis. To answer our research
questions, we compared the TW and US groups’ respective cultural values and awareness of IA components using both quantitative and
qualitative analysis. We first arranged all the text documents they had created in spreadsheet form, and calculated each participant group’s average awareness for each of the three target webpages. Then based on data collected during the background studies, we calculated cultural values in the same manner as Chien et al. (2016). SPSS software and the Airtable platform was used for statistical analysis of all the quantitative data.
Visual Analysis. Additionally, we utilized
visual analysis to capture which aspects of webpages the participants paid the most attention to, and used Gephi to illustrate the relations among such participant-named aspects and our focal IA components. Since effective visualization can help enhance the readability and comprehension
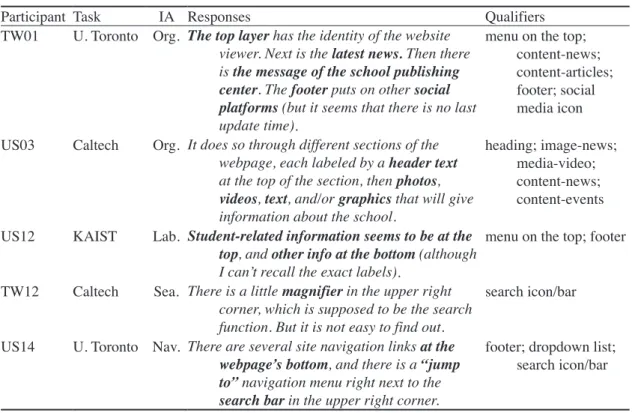
Table 3. Coding Examples of Textual Description
Participant Task IA Responses Qualifiers TW01 U. Toronto Org. The top layer has the identity of the website
viewer. Next is the latest news. Then there is the message of the school publishing
center. The footer puts on other social platforms (but it seems that there is no last
update time).
menu on the top; content-news; content-articles; footer; social media icon US03 Caltech Org. It does so through different sections of the
webpage, each labeled by a header text at the top of the section, then photos,
videos, text, and/or graphics that will give
information about the school.
heading; image-news; media-video; content-news; content-events US12 KAIST Lab. Student-related information seems to be at the
top, and other info at the bottom (although
I can’t recall the exact labels).
menu on the top; footer TW12 Caltech Sea. There is a little magnifier in the upper right
corner, which is supposed to be the search function. But it is not easy to find out.
search icon/bar US14 U. Toronto Nav. There are several site navigation links at the
webpage’s bottom, and there is a “jump to” navigation menu right next to the search bar in the upper right corner.
footer; dropdown list; search icon/bar
of complex data (Munzner, 2014), we expected that producing these graphics would help us gain deeper insight into the participants’ responses, complementing our previous analyses.
4. Results
Below, we begin with an overview of the participants’ cultural characteristics. This is followed by a discussion of the relationship between such characteristics and their awareness of IA components. Finally, we present graphics showing connections between webpage components as mentioned by the participants and key IA components.
4.1 Participants’ cultural values
Cultural Value Scale. The CVS results
suggested that there were significant differences between the TW and US groups in terms of both UAI and MAS, as Table 4 illustrates. This echoes some prior work, e.g., Chien et al. (2016). Both UAI and IDV were higher in the US group, while PDI was relatively higher in the TW group.
4.2 Effects on awareness: Culture and complexity
A mixed-model analysis of variance (ANOVA) was performed to determine the mean differences in IA awareness. Country (US/TW) and complexity (low/medium/high) were used as the between-subject variables, and four types of IA-specific awareness (organization, labeling, searching, and navigation) as the within-subject variables. No interaction effect between the country and complexity variables was found on any type of IA awareness. However, statistically significant effects on both website complexity and country were found.
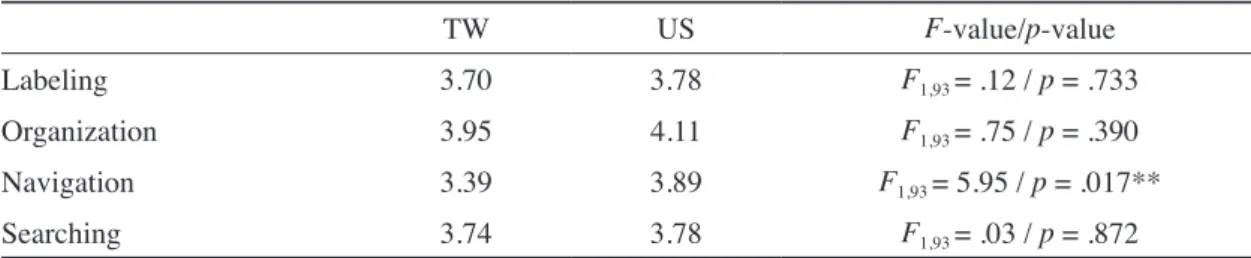
Cultural Effects. As shown in Table 5,
US group members rated significantly higher in navigation awareness than their TW-group counterparts (F1,93 = 5.95, p = .017). However,
there were no statistically significant cultural effects on any of the other IA-awareness measures at α = .05 level.
Complexity Effects. The results of a further
ANOVA suggest that website complexity was negatively associated with awareness scores for all IA components (Table 6). This could mean that
Table 4. Cultural Value Scale Scores
TW (n = 18) US (n = 14a) p value PDI 2.00 1.76 .247 UAI 3.44 3.90 .041 IDV 3.04 3.13 .691 MAS 2.18 1.64 .043 LTO 3.72 4.06 .139
Note. PDI = Power Distance Index; UAI = Uncertainty Avoidance Index; IDV = Individualism; MAS
= Masculinity; LTO = Long-term Orientation. The result was based on a five-point Likert scale: strongly disagree (1) to strongly agree (5).
a One of the UAI data points from the US group was two standard deviations below that group’s mean
increased website complexity leads to lower IA awareness. However, among participants who had a good grasp of search functions, this effect was marginal.
4.3 Analysis of textual descriptions
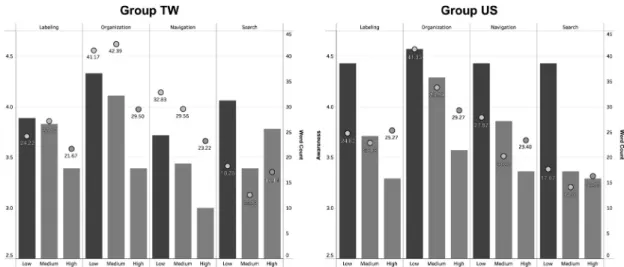
Figure 4, illustrates two measures based on participants’ text response: (1) the word counts (shown as circle dots) of the participants’ descriptions of the four focal IA components webpage, as well as (2) their rating of awareness (1 = not at all aware to 5 = extremely aware). Two measures were sorted by the webpage complexity level (low, medium, and high) and their culture groups (TW and US). Since elaboration quantity tends to be higher when a topic is familiar, we adopted the word count of our participants’
responses as an objective index of their awareness. In both groups, the participants tended to describe organizational systems at greater length, and search systems briefly, irrespective of webpages’ complexity levels.
Word-frequency computations also revealed cultural difference in focus on IA components. For example, the word “heading” only appeared in the TW group’s answers, whereas “navigate” was only mentioned by US participants.
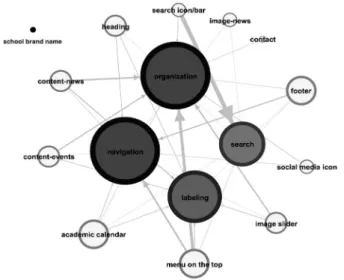
4.4 Visualization of textual descriptions
Figures 5 and 6 use a network visualization layout to represent how the participants’ descriptions of actual webpage features (outer circles) relate to the four key IA components as understood by theorists (inner circles). The more
Table 5. Information Architecture Awareness, by Culture and Component
TW US F-value/p-value Labeling 3.70 3.78 F1,93 = .12 / p = .733 Organization 3.95 4.11 F1,93 = .75 / p = .390 Navigation 3.39 3.89 F1,93 = 5.95 / p = .017** Searching 3.74 3.78 F1,93 = .03 / p = .872 **p < .05.
Table 6. Information Architecture Awareness, by Degree of Webpage Complexity
Degree of webpage complexity
F-value/p-value (Bonferroni)Post-hoc
High Med Low
Labeling 3.30 3.82 4.11 F2,93 = 4.880 / p = .010 Low > High (p = .008)
Organization 3.43 4.22 4.43 F2,93 = 10.084 / p < .001 Low > High (p < .001)Low > Med (p = .003)
Navigation 3.17 3.69 4.06 F2,93 = 6.406 / p = .002 Low > High (p = .002)
the participants mentioned an IA component, the bigger and darker in color it is in the inner circles; and the more they mentioned a particular webpage feature, the bigger and darker it is in the outer circles. The width of an edge represents the degree
of participants’ attention, e.g., the thicker the link, the more the participants mentioned this web component in the main study.
There were also some webpage features that, though linked to particular IA components in
Figure 4. Participants’ Awareness Scores and Description Word Counts for Each of the Four Focal Information-architecture Components
Figure 5. Participants’ Perceptions toward IA Components by the Low Degree of Webpage Complexity
theory, were not mentioned by any participants and thus are represented as black dots beyond the outer circles. However, it should be borne in mind that these figures only record the relations between webpage features and IA components that we could clearly capture from participants’ responses, and not all such relations that exist; nor does a participant’s failure to mention an IA component by name imply that he/she was unaware of its existence. It should also be noted that the links between webpage features and IA components are inherently imprecise. Since there were no bottom-up user studies at the time of the establishment of IA principles by Rosenfeld et al. (2015), our figures could help us understand what webpage features really help individuals access IA components, which is one of the important contributions of the present research.
4.5 Website complexity’s relation to attention allocation
A careful look at Figure 5-7, indicates that there were important differences among the three-complexity levels. The arrows represent the connections between particular webpage features and information-architecture components. Counterintuitively, based on the participants’ responses, the more complex a website was, the less complicated the network formed by its webpage components was perceived to be. For example, as shown in Figure 7, the KAIST webpage – which was rated as the most complex of the three by our independent panel – had the fewest nodes in its webpage-component network. This may mean that participants were only able to identify a few of KAIST’s webpage features within the time allowed by the experiment. Conversely, the lowest-complexity website had more user-reported nodes (Figure 5), and
Figure 6. Participants’ Perceptions toward IA Components by the Medium Degree of Webpage Complexity
participants were better able to distribute their attention across all four of its IA components, as evidenced by the similar sizes of the circles representing them.
Turning to the intersection of culture with webpage complexity, we can also see in Figure 8 that the patterning of graphics for the TW group is distinct from that of the US group. In low- and medium-complexity tasks, the US participants mentioned several features associated with the IA component organization (Figures 8D and 8E). However, when looking at the most complex website, the same participant group tended to pay more attention to the other three IA components (Figure 8F). Unlike with the US group’s patterns, however, the size of the nodes in the network layouts perceived by the TW group did not change dramatically as webpage complexity increased (Figures 8A, 8B, and 8C). This may reflect that the TW participants focused roughly the same
amount of attention on organization, navigation, and labeling components across all three degrees of webpage complexity. It is also noteworthy that, while the size of the searching system in Figure 8C is the smallest among the IA components, its link is the thickest: showing that participants used a narrow range of terms for webpage features, such as “search icons/bar,” to refer to the IA component searching.
As noted above, there were some webpage components that were not mentioned by any participants, and therefore depicted as having no connection with IA components, e.g., “school brand name” in Figure 8A. However, these components could have been overlooked due to their obscurity. For instance, the purposes of the “external links” on the low-complexity website are inherently confusing (Figure 8A), using jargon that only students or professors of that university would likely be familiar with.
Figure 7. Participants’ Perceptions toward IA Components by the High Degree of Webpage Complexity
4.6 Perception of information- architecture components
Drawing upon multiple data sources from the experiment, including the instrument in the Main Study and the CVS results in the Background Studies, we further elaborate our results regarding four IA systems to deliver a comprehensive look at our findings.
4.6.1 Labeling
Regarding the labeling systems of webpage features, we noticed that the TW and US participant groups shared several browsing patterns. Most participants were able to identify both textual and visual labels during the experiment. For example, participant US09 stated,
Figure 8. Participants’ Perceptions toward IA Components by Degree of Webpage Complexity and Cultural Group
“The webpage labels their content with brief,
one to three word explanations: ‘Did you know?’ ‘Student Life’ ‘Admissions.’” We also found that
some US participants disliked imprecise textual labels and vague taglines, such as the “Discover” tagline on the Caltech website (participant US01). And, unlike US participants who paid relatively more attention to text than to images, TW group members distributed their attention relatively evenly across both.
4.6.2 Navigation
Our CVS results showed that the US participants were inclined to avoid ambiguous situations, instead of merely relying on a search function. That is, they appeared to allocate more attention to navigating the website for the purpose of gathering rich information, and this led to better awareness of its navigation architecture. The TW group, in contrast, were found to allocate more attention to organization-related features.
4.6.3 Organization and searching
The majority of our participants from both cultures were highly aware of how the focal websites organized their information objects, irrespective of the webpages’ complexity levels. While observing the low-complexity webpage, both groups of participants described themselves as satisfied with its organizational architecture, and could clearly describe how the website it was drawn from arranged its content. However, when the Taiwanese participants were presented with more complicated webpages, they focused more on its organizational system, in contrast to the US participants, who focused on its search function.
Participants from both cultures gave briefer descriptions of search functions than of the other three IA components. After cross-validating
this result with the awareness scores from the background studies, we found that participants from both groups rated searching components highly, and were able to locate them quickly. This near-unanimity may simply reflect that the current development of searching systems in web IA is mature.
5. Discussion
5.1 Awareness of and attention allocation to information-architecture components
The cross-cultural differences in our participants’ attention allocation were triangulated with our background questionnaire results. Our CVS result that the US participants’ UAI was higher suggests that they may have been more sensitive than their Taiwanese counterparts to information ambiguity, and would likely seek to avoid it while interacting with a webpage. This could reflect the mean differences found in the awareness of the IA component navigation between two cultural groups: with the US group scoring higher in this respect across all four IA components, as shown in Table 5. While navigation represents an intuitive way of finding information in a webpage seen for the first time, the US group’s significantly higher awareness of navigation components, coupled with its members’ high UAI, may reflect a focus on navigation as a means of reducing information anxiety.
Our finding that the US participants valued textual labels over icons or images, whereas the Taiwanese ones valued them more or less equally, arguably implies that the TW group was not eager to seize upon any information at first sight, but rather, tended initially to feel out the webpage environment by browsing and observing it as
a whole. This finding is aligned with those of previous studies, including by Chua et al. (2005) and Boduroglu et al. (2009), who reported that East Asians tended to consider parts of objects in relation to the whole. On the other hand, our finding of a higher UAI among US participants— implying that they were inclined to process information as quickly as possible to avoid ambiguity—was inconsistent with Hofstede’s principles (Hofstede et al., 2010).
In Section 4.6.3, we also found that Taiwanese participants focused more on a webpage’s organizational system when being presented with highly complicated task, in contrast the US participants, who focused on its search system. While we did not locate direct evidence from previous literature that could adequately explain these findings associating with the cultural difference; nevertheless, a possible explanation can be yielded based on the indirect evidence: Japanese website visitors were used to browsing a highly complicated web page in terms of a webpage’s number of Web components (Cyr & Trevor-Smith, 2004). Since the cultures and languages of Taiwan and Japan were closer compared with the Anglophone culture, also classified as high-context cultures (in terms of the speech) countries in studies (Fu & Wu, 2010), we reasoned that the Web visitors from non-Anglophone cultures like Taiwan and Japan, may share similar characteristics.
5.2 Between-group similarities in cultural dimensions
Our findings’ strong inconsistency with Hofstede’s theory was apparent not only in the case of UAI, but also with LTO. One possible
reason for this was that our participants, being college students, were at a similar stage of life and, presumably, similar day-to-day environments, and this could have influenced their preferences to some degree. Hofstede’s study, in contrast, was conducted among people with a much wider array of working conditions, as well as in more countries.
6. Design Implications
In light of our findings, we can offer several recommendations to web designers and developers seeking to build websites that are more cross-culturally friendly.
Visitors from different cultures prefer less complicated designs. First, our findings suggest
that web visitors prefer low-complexity websites, irrespective of cultural background. The simplicity of a webpage’s features considerably enhances its usability, by increasing user awareness of all four key IA components. If a website must be constructed in a complicated way, however, increasing the prominence of its search feature could effectively compensate for the lower findability of its information.
Visitors from different cultures may behave differently with a complicated design. Our US
participants tended to seek out the search function on the most complicated webpage we showed them, whereas our Taiwanese ones maintained similar browsing behavior across all three complexity levels. Therefore, to optimize the user experience of US website visitors, we suggest that web developers/designers enhance search features and on the navigation component of IA: for instance, by enlarging search icons and navigation menus. Selection and organization of content,
on the other hand, were the IA components most important to the members of our TW group. Therefore, web developers/designers should be careful when arranging content to avoid information being overlooked by those who rarely employ search features.
US visitors care more about text labels.
Finally, the US group expressed extensive concern about the clarity of labeling systems, whereas the TW group distributed their attention holistically across both text and images. From this, it can be inferred that websites built for US visitors should display precise wording as well as informative images.
7. Concluding Remarks
This study of how web visitors’ cultural backgrounds were associated with their attention to webpage features related to the four key IA components has revealed that both American and Taiwanese web visitors are less aware of the IA of complicated websites, due to such sites’ overwhelming array of information objects. We also found cultural differences in how our participants allocated their attention to different IA components.
7.1 Limitations and future directions
As mentioned in the Methodology section, website screenshots were used in our experiment to minimize bias that might otherwise have been caused by changes in webpage content over time, had live links been used, as well as to allow the participants to focus on their general impressions of the webpage rather than its details. However, this meant that they could not interact with web page features by clicking on them during their
2-minute observation windows, which may have hindered them from navigating a webpage in a natural way. The experimental setting itself could also have diminished the navigation component of the focal webpages’ IA, e.g., because many present-day navigation systems around the world are hover-driven.
Finally, the participants in the US group were recruited while they were in Taiwan, either as full-time foreign students or short-term exchange/ visiting students, and this could have resulted in a sampling bias: i.e., having lived in Taiwan, the US group members could reasonably be expected to be more immersed in Asian culture than their counterparts who were lifelong US residents, and this could have muted the observed inter-cultural differences somewhat. Future work is quite necessary to deepen this topic that analyzes participants’ personal traits, controls or gathers more parameters such as academic performance, major, prior experience of using Web, or experience living in Anglophone or non-Anglophone cultures.
Our future work on this topic will include additional independent variables, such as the participants’ personality traits. We are also interested in analyzing participants’ notes and sketches of each task as a potentially rich supplemental data source. We would also recommend that future researchers adopt other cultural theories to interpret these and similar findings more comprehensively.
Acknowledgments
The authors would like to thank research assistants Jian-Sin Lee for helping conduct the
user experiments, as well as Huei-Hsin Liu and Yu-Jen Chen for assisting in data collection and management. This work was financially supported by the Ministry of Science and Technology (MOST) in Taiwan, under MOST 110-2636-H-002-001- and MOST 110-2634-F-002-045, and the Center for Research in Econometric Theory and Applications (Grant no. 110L900204) from The Featured Areas Research Center Program within the framework of the Higher Education Sprout Project by the Ministry of Education (MOE) in Taiwan.
References
Boduroglu, A., Shah, P., & Nisbett, R. E. (2009). Cultural differences in allocation of attention in visual information processing. Journal of
Cross-cultural Psychology, 40(3), 349-360.
doi: 10.1177/0022022108331005
Chien, S.-Y., Lewis, M., Sycara, K., Liu, J.-S., & Kumru, A. (2016). Relation between trust attitudes toward automation, Hofstede’s cultural dimensions and Big Five personality traits. Proceedings of the Human Factors &
Ergonomics Society Annual Meeting, 60(1),
841-845. doi: 10.1177/1541931213601192 Chua, H. F., Boland, J. E., & Nisbett, R. E. (2005).
Cultural variation in eye movements during scene perception. Proceedings of the National
Academy of Science, 102(35), 12629-12633.
doi: 10.1073/pnas.0506162102
Cyr, D., & Trevor-Smith, H. (2004). Localization of web design: An empirical comparison of German, Japanese, and United States website characteristics. Journal of the Association for
Information Science & Technology, 55(13),
1-10. doi: 10.1002/asi.20075
El mimouni, H., & MacDonald, C. M. (2015). Culture and information architecture: A study of American and Arab academic websites. Proceedings of the Association for
Information Science & Technology, 52(1),
1-4. doi: 10.1002/pra2.2015.145052010091 Fu, C.-S., & Wu, W.-Y. (2010). The
means-end cognitions of web advertising: A cross-cultural comparison. Online
Information Review, 34(5), 686-703. doi:
10.1108/14684521011084573
Goyal, N., Miner, W., & Nawathe, N. (2012). Cultural differences across governmental website design. In R. Vatrapu, V. Evers, & K. B. Akhilesh (Chairs), Proceedings of the 4th
International Conference on Intercultural Collaboration (pp. 149-152). New York, NY:
Association for Computing Machinery. doi: 10.1145/2160881.2160907
Gronier, G. (2016). Measuring the first impression: Testing the validity of the 5 second test.
Journal of Usability Studies, 12(1), 8-25.
Hall, E. T. (1976). Beyond culture. New York, NY: Doubleday.
Hofstede, G., Hofstede, G. J., & Minkov, M. (2010). Cultures and organizations: Software
of the mind. New York, NY: McGraw-Hill.
Internet World Stats. (2020). Internet world users
by language. Retrieved from https://www.
internetworldstats.com/stats7.htmhttps:// www.internetworldstats.com/stats7.htm Jeng, W., Hu, H.-Y., Tang, G. M., & Chien, S.-Y.
of attention to information architecture components [Data set]. Retrieved from osf.
io/rkjh4
John, O. P., & Srivastava, S. (1999). The Big-Five trait taxonomy: History, measurement, and theoretical perspectives. In L. A. Pervin, & O. P. John (Eds.), Handbook of personality:
Theory and research (2nd ed., pp. 102-138).
New York, NY: Guilford Press.
Marcus, A., & Gould, E. W. (2000). Crosscurrents: Cultural dimensions and global web user-interface design. Interactions, 7(4), 32-46. doi: 10.1145/345190.345238
Munzner, T. (2014). Visualization analysis and
design. Boca Raton, FL: CRC Press. doi:
10.1201/b17511
Rosenfeld, L., Morville, P., & Arango, J. (2015).
Information architecture: For the Web and beyond
(4th ed.). Sebastopol, CA: O’Reilly Media. Singh, N., & Pereira, A. (2005). The culturally
customized web site: Customizing web sites
for the global marketplace. Burlington, MA:
Butterworth-Heinemann.
Stull, E. (2018). Qualitative research. In E. Stull (Ed.), UX fundamentals for non-UX
professionals (pp. 247-258). Berkeley, CA:
Apress. doi: 10.1007/978-1-4842-3811-0 The World University Rankings. (2018). World
university rankings 2018. Retrieved from
https://www.timeshighereducation.com/ world-university-rankings/2018/world-ranking#!/page/0/length/25/sort_by/rank/ sort_order/asc/cols/stats
UsabilityHub. (2019). Five second tests. Retrieved from https://fivesecondtest.com/
Yoo, B., Donthu, N., & Lenartowicz, T. (2011). Hofstede’s five dimensions of cultural values at the individual level: Development and validation of CVSCALE measuring. Journal
of International Consumer Marketing, 23(2),
193-210.
使用者於資訊架構要素注意力分配之文化差異
Cultural Differences in the Allocation of Attention to
Information Architecture Components
鄭 瑋
1胡馨元
2湯高銘
3簡士鎰
4Wei Jeng
1, Hsin-Yuan Hu
2, Gao-Ming Tang
3, Shih-Yi Chien
4摘 要
良好的網站資訊架構能夠強化網站內容的可尋性與易用性,亦能確保良好的使用者體 驗。本研究欲探索使用者將其注意力分配予四項資訊架構要素(命名、組織、導覽與搜尋 系統)時所存在的文化差異。本研究招募33位來自臺灣及美國的大專學生進行使用者研 究,上述測試涵蓋注意力分配、族群、文化、個人等因素。研究結果顯示,當網站內容的 複雜性越低,則整體受測者對網站資訊架構要素的覺察程度越高。來自美國的受測者通常 更注意網頁的文字標示,而臺灣受測者則較傾向將注意力平均分配予文字及圖像物件。本 研究揭示全球異質化的網路社群在理解、消化資訊架構要素的歧異度,對於未來的資訊架 構之設計具有重要啟示。 關鍵字:資訊架構、網頁設計、Hofstede文化維度理論 1 國立臺灣大學圖書資訊學系Department of Library and Information Science, National Taiwan University, Taipei, Taiwan
2 凱度洞察
Kantar Taiwan, Taipei, Taiwan
3 美國卡內基美隆大學海因慈學院
Heinz College of Information Systems and Public Policy, Carnegie Mellon University, USA
4 國立政治大學資訊管理學系
Department of Management Information Systems, National Chengchi University, Taipei, Taiwan * 通訊作者Corresponding Author: 鄭瑋Wei Jeng, E-mail: wjeng@ntu.edu.tw
註: 本中文摘要由作者提供。
以APA格式引用本文:Jeng, W., Hu, H.-Y., Tang, G.-M., & Chien, S.-Y. (2021). Cultural differences in the allocation of attention to information architecture components. Journal of
Library and Information Studies, 19(1), 19-41. doi: 10.6182/jlis.202106_19(1).019
以Chicago格式引用本文:Wei Jeng, Hsin-Yuan Hu, Gao-Ming Tang, and Shih-Yi Chien. “Cultural differences in the allocation of attention to information architecture components.” Journal of