Journal of Oceanography Vol. 50, pp. 691 to 711. 1994
Influence of the Seasonal Thermocline on the Intrusion of Kuroshio
across the Continental Shelf Northeast of Taiwan
CHING-SHENG CHERN and Joe WANO
Institute of Oceanography, National Taiwan University, Taipei, Taiwan, Republic of China (Received 2 May 1994; in revised form 27 June 1994; accepted 1 July 1994)
The hydrographic surveys in an area immediately northeast of Taiwan showed that the Kuroshio surface water intruded onto the shelf in the spring and there was a thick mixed layer and weak vertical stratification in the Kuroshio at that time. During the summer season, a strong thermocline was developed in the Kuroshio and the flow shifted offshore from Taiwan in front of the continental shelf break of the East China Sea. A numerical model is used to examine the effect of this seasonal thermocfine on the flow pattern of the survey area. We find that the surface strength of the disturbance above the Su-Ao ridge is closely related to the occurrence of t h e on-shelf intrusion of Kuroshio. The presence of a seasonal thermocline in the Kuroshio can greatly diminish this disturbance in the surface level.
1. Introduction
The Kuroshio originates from the Northern Equatorial Current and flows northward along the east coast of Taiwan. At the northeast offshore of Taiwan, it encounters the sharply curved continental slope of the East China Sea (ECS). The main stream of the Kuroshio turns northeast along the edge of the ECS. However, the path of the Kuroshio at this place is unstable. Recent hydrographic surveys at the area offshore northern Taiwan indicated that the path of Kuroshio has distinct seasonal variation there. In the summertime, the Kuroshio is blocked by the continental shelf break of the ECS (Hsueh et al., 1993). In winter and spring, the Kuroshio intrudes directly onto the shelf area (Chern and Wang, 1992; Hsueh et al., 1992). From the GEK data, Sun (1987) showed that the Kuroshio axis moves toward the shelf during fall and winter season and is shifted further offshore in spring and summer in this region.
According to a barotropic numerical model, Seung and Nam (1992) showed that the on-shelf intrusion of Kuroshio east of Taiwan in winter is due to blocking of the northward transport in the Taiwan Strait by the northeast monsoon. The baroclinic model of Chao (1991) indicated that the Kuroshio water usually intrudes into the ECS from both sides of Taiwan island and winter winds enhance the intrusion from northeast of Taiwan. However, the direct current observation showed that the on-shelf intrusion of Kuroshio in winter is about one month lag the onset of the northeast monsoon (Tang and Yang, 1993). In the late spring, the northward flow in the Taiwan Strait has already begun (Wang and Chern, 1988); the intrusion of Kuroshio's surface water still occurred in the northeast offshore region of Taiwan. Hence variation of transport in the Taiwan Strait and the monsoon change are not the only causes of the on-shelf intrusion of Kuroshio.
In this paper, we present two typical hydrographic surveys in the area between the Su-Ao ridge and the shelf break of the ECS during the late spring and the summer season. These data clearly show that the seasonal thermocline of the Kuroshio, developed in summer, affects the
692 C.-S. Chore and $. Wang
flow pattern there. We also use the ocean circulation model described by Semtner (1974, 1986) to investigate its influence on the on-shelf intrusion o f Kuroshio.
2. Hydrography
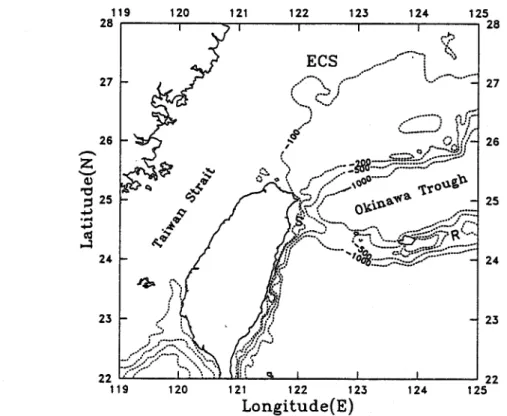
The hydrographic surveys were conducted on board the R/V Ocean Research I, during the periods May 6--11,1988 and August 23-27,1993 over the shelf/slope area northeast of Taiwan. Figure 1 shows the bottom topography in the vicinity of the survey area. The main features include the wide shelf of the ECS, a nearly zonal steep continental slope north of the Okinawa trough and the Ryukyu island arc. The western end of this island arc is the Su-Ao ridge; its shape is quite irregular with a depth in the range 100--500 m. Temperature and salinity data were obtained at each station with a Neff Brown Instrument Systems conductivity-temperature-depth (CTD) meter for the cruise in May and with a Sea Bird SBE 9/11 CTD meter for the cruise in August.
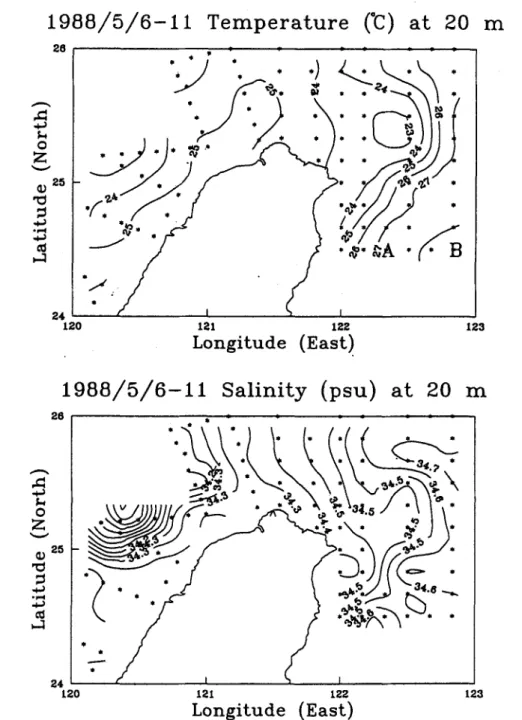
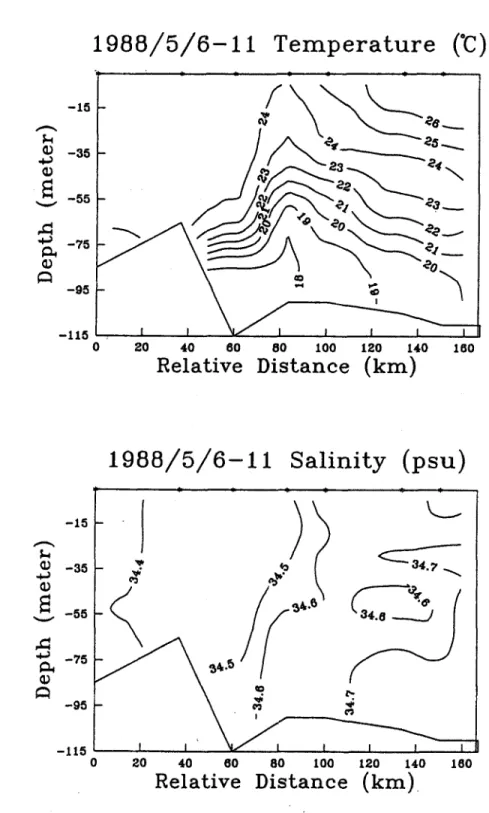
Figure 2 shows the temperature and salinity contour at 20 m of the first survey. It clearly shows that the Kuroshio water is characterized by high salinity (>34.4 psu) and large horizontal temperature difference (23--27~ across the flow. The presence of Kuroshio surface water on the shelf is evident. Figure 3 shows a zonal temperature and salinity transect at 26~ from 121010 ' E to 122050 ' E, of this survey. The origin of the relative distance in Fig. 3 is at 121~ ' E, 26~ We inferred from this figure that the Kuroshio-intruding water does not just
119 120 121 122 125 124 125 28 28 26 Z: ~D " 0 25 . ,.,.4 24 I I 27 - - ..o~ , , . : i ~ . . . . ,- ... :?'k/...:.~,:'::J~ . . ~':o" .~ ~ ~ ~ 1 7 6 , . . /~.'o,' t , . . , . . . : : . . . "~.::-:.. " ~ ? , . \ I ~.,".-:: 2 2 ;": .... ,-"~.~ t~i( ~. I I t ,- I "'~ J E C S
"/ :"] %
./~~ o.~176
~,
~176176176176176
c ,Sj
\~.% %.." t : f z. "}U'.. ,r';.." ,oo~
. . . .!,~ : 9 ~ 1 7 6 0~" . . . . o / ,.:::= I I I 119 120 121 122 123 124 L o n g i t u d e ( E ) 27 26 25 24 23 22 125Fig. 1. The seas surrounding Taiwan; the depth contours are in meters, S denotes the Su-Ao ridge and R denotes Ryukyu island arc.
Influence of the Seasonal Thermocline on the Intrusion of Kuroshio 693
1 9 8 8 / 5 / 6 - 1 1
2 0 0 Z 2 5 .F-.(Temperature ('C) at 20
9 .. " . .
: . > ~
i
:
9
. / i
121 122 123Longitude (East)
2 4 120 I n19B8/5/8-11
26 0 Z 2 5 -F..I I nSalinity (psu) at 20
* , i L . 9 ~ j : c =.~.~ >'.~.~.\ ~ k , ~ ~ ",,
121 112Longitude (East)
2 4 t20 123Fig. 2. Temperature and salinity contour at 20 m of the survey in May. Asterisks mark the CTD stations. A and B are the positions at which temperature profiles are shown in Fig. 6.
694 C.-S. Chern and J. Wang V 0
1988/5/6-11
- 1 5 - 3 5 - 5 5 - 7 5 - 9 5 - 1 1 5 0Temperature ('C)
20 40 6 0 8 0 100 120 140 160Relative Distance (kin)
3
v -115988/5/e-11
- 1 5 " - 3 5 - 5 5 - 7 5 - 9 5 0 2OSalinity
(psu)
r r 4O 60R e l a t i v e
I 80 1 0 0 120 140 160Distance (km).
Influence of the Seasonal Thermocline on the Intrusion of Kuroshio 695
occur in the surface. They are presented over the whole water column on the shelf. Figure 2 also shows that the warm (~25~ and less saline (<34.35 psu) water from the Taiwan Strait is confined at the western side of the Kuroshio-intruding water. This pattern is similar to the one observed during April 16-21, 1989 (Hsueh et al., 1992), that survey covered more shelf region north of 26~ and showed that the Kuroshio-intruding water can penetrate further north as a shallow surface current on the shelf of the ECS.
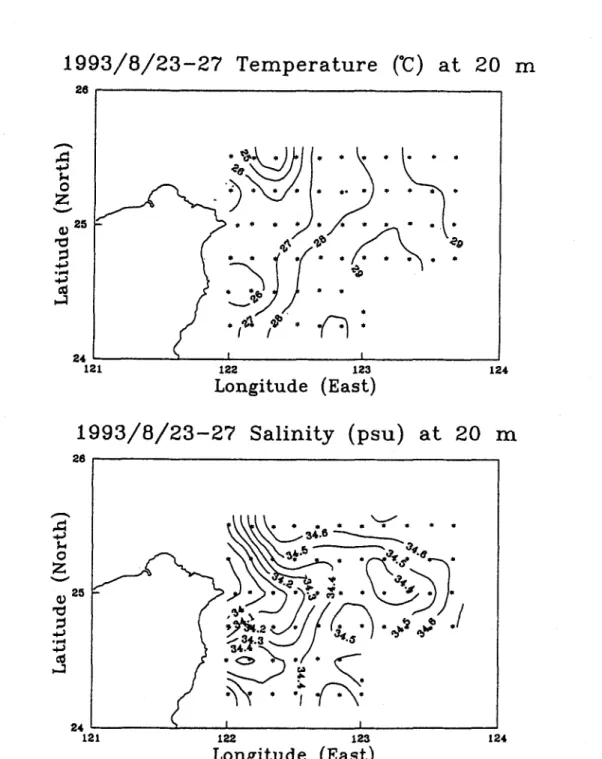
Figure 4 shows the temperature and salinity contour at 20 m of the second survey. At this time, the horizontal temperature gradient at the surface becomes quite weak as compared to that shown in Fig. 2. If we still use the high salinity (:-34.4 psu) to characterize the Kuroshio water, then the surface Kuroshio water has a temperature ~28~ except at two cold region above the Su- Ao ridge and the shelf break respectively. The Kuroshio surface water occurred at the seaward portion of the survey area. Between the east coast of Taiwan and the Kuroshio surface water, there is a pool of water with salinity ,:34.3 psu and temperature about 26-27~ The small salinity of these surface waters indicated that they are from the shelf area. Since the data shown in Fig. 4 have not covered the shelf region north of 25~ ' N, it is impossible to infer the flow pattern of Kuroshio as it approaching the shelf break of ECS. However, Hsueh et al. (1993), based on the survey during August 28-September 4,1991, showed that the surface Kuroshio is blocked by the shelf break at northeast offshore of Taiwan in the summer. Figure 2 of Hsueh et al. (1993) showed that the surface shelf water (at depth 50 m) has temperature about 26-27~ and salinity ,:34.3 psu, similar to the water along east coast of Taiwan shown in Fig. 4.
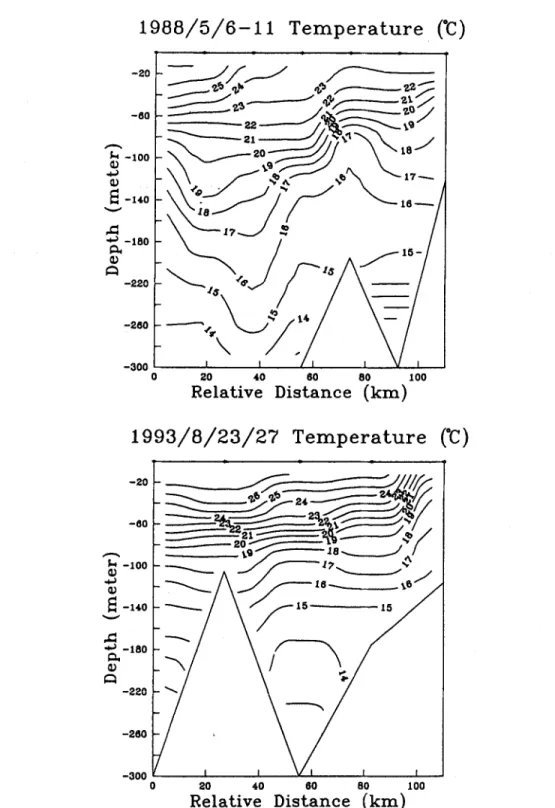
Figure 5 shows the meridional temperature transect of the upper 300 m at 122~ ' E, between 24~ ' N and 25~ N, of the two surveys respectively. The origin of the relative distance is at 122~ ' E, 24~ ' N. For the survey in May, the isotherms have a large-amplitude disturbance over the bottom topography. In contrast, the isotherms of the survey in August are flat; the disturbance associated with the bottom topography cannot extend to the surface at this time. In Fig. 5, there is a discrepancy about the shape and location of the bottom topography associated with the Su-Ao ridge. The reason is that the survey area has a large topographic variations and that the strong surface current makes it difficult to maintain the ship position during the CTD cast. Nevertheless, this condition does not alter the basic features shown in Fig. 5.
Figure 6 shows the vertical temperature profiles at 122o20 ' E, 24030 , N and 122050 ' E, 24030 , N, Sta. A and B shown in Fig. 2, of both surveys. Sta. A is within the Kuroshio front and Sta. B is at a seaward site from the stream. The profiles of the survey in May show that the Kuroshio has a thick mixed layer in the upper 140 m and that stratification is weak beneath the mixed layer. In contrast, for the survey in August, the profile at Sta. A shows that the surface mixed layer is shallow and that, beneath it, there is a strong thermocline, with a temperature jump about 10~ in 50 m. The profile at Sta. B also shows the existence of a weak thermocline in August. Figure 6 also shows that the presence of a thermoctine in August is not due to surface heating, but is caused by cooling of waters at depths about 50-100 m.
To summarize, the hydrographic data shown in this section indicate that the surface intrusion of Kuroshio into the ECS is accompanied by the presence of a thick mixed layer in the main flow and a large-amplitude internal disturbance over the bottom topography in spring. In summer, the Kuroshio emerges a strong seasonal thermocline and the strength of the disturbance, associated with the topography, above the thermocline is diminished. Then the shelf water from the ECS can outflow into the open sea and push the Kuroshio surface water further offshore.
696 C.-S. Chem and J. Wang
1 9 9 3 / 8 / 2 3 - 2 7
T e m p e r a t u r e
('C) a t 2 0 m
2O 0z
25 24 121 124 9 , , ~ b j l . 9 t . . i. 9 9/~'" "Z~/' ~ " "t;o
122 123Longitude (East)
1 9 9 3 / 8 / 2 3 - 2 7
Salinity (psu)
a t
20 m
2 8 0z
v 25 .i-4 24 121 124 ~ 9 ~ - . . .,X\\%,.~-- . .
~,~,~.~ .
~ s > ~ . )
9"o" ,~'_" ~ _ ~ .) 1"_
~" . ~ , . .~-J I / / / -X . i / /~ ; ~ . ' . . ~
".#4 f C~.
_. ). ,? ,,,," .I
9 < : ~ 9 , / 1 ..:
/ ' h ' ~
. ", ~,c,.
~ 1 ... I . . . 122 123L o n g i t u d e (East)
Influence of the Seasonal Thermocline on the Intrusion of Kuroshio 697
1988/5/6-11 Temperature (~
i * I ~ is
~--1,
=
~ , z : _ , , j
"
i
- 2 2 0__%
/
/ \ ~ /
'i/
- 3 0 0 I I I I I V o 2 0 ~ o 00 e o ~oo R e l a t i v e D i s t a n c e ( k m )1993/8/23/27
-2o ~-
~ -6o - l O O (1,),,•
- 1 4 0,.,r
"~-180 -220 -2~0 - 3 0 0Temperature ('C)
b i i~---~,~ ~ ~
20 ~ 1 ~ . ~ /\- f, ' -
I I VI I I 20 4O 60 80 1 O0Relative Distance (kin)
698 C.-S. C h e m sad J. W a n g E- 0 f. l I I I ! 0 0 e~ ,C o 0 e ~ o
Influence of the Seasonal Thermocline on the Intrusion of Kuroshio 699
3. Numerical Model
The ocean circulation model described by Semtner (1974,1986) is adopted to investigate the effect of the Kuroshio's seasonal thermocline on its intrusion onto the ECS northeast of Taiwan. The governing equations are the same as those used by Chao (1991), for which the density field is directly solved instead of computing the temperature and salinity field according to Semtner's original code.
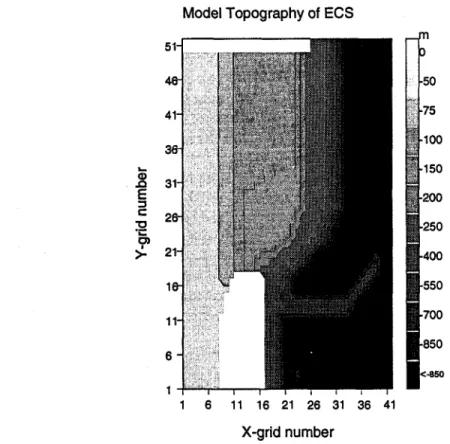
The model domain is a rectangular channel of 42 x 52 grids in the horizontal plane. For convenience, the x-axis is set in the cross channel direction and the y-axis is along the channel. The mesh size, Ax, Ay is 20 kin, except at eastern 5 grids, at which the Ax is altered to 50 kin. There are 12 levels in the vertical, the top four being 25 m thick, the next three being 50 m thick and bottom five being 150 m thick, yielding a maximum basin depth 1000 m. Figure 7 shows the bottom topography of our model basin. All main features shown in Fig. 1, which including the Taiwan Strait, the ECS, the Okinawa trough, and the Ryukyu island arc, are included in this
model.
A geostrophic jet is initialized to follow a curvilinear path, which is along the east coast of
Taiwan and follows the continental slope of the ECS after the jet leaves the island. If the location
of the jet axis is denoted by x = :d, the density field supporting this geostrophic current is
E ::3 t" '10 ~ =,,,. >. 1
Model Topography of ECS
6 11 16 21 26 31 X-grid number 36 41 r~ 0 -50 -75 -100 -150 -200 -250 -400 -550 -700 -850 <,.85o
Fig. 7. Topography of the model basin; the annotations are grid numbers in the horizontal axis and the depths are in meters.
700 C,-S. Chern and J. Wang
P(x'Y'z)=b(Z)+cosh~(~d~dd)
lot t Lx
/+1
(1)
for z , : - d , and
, ( x , y , z ) - for 0 > - d (2)
in which (x, y) are the horizontal coordinates and z is the vertical coordinate, positive upward, with z = 0 corresponding to mean semi level. In this equation, the density, p, is in the ~ unit, 2-Ap is the density jump across the jet, Lx is the half-width of the jct,.fis the Coriolis parameter, its value at the southern boundary of the model basin is f0, andD is the vertical extent of the jet. This density structure is similar to the one used by Chao (1991), except that the maximum horizontal density gradient along the jet axis, at x = x~, here occurs at the depth z = --d. The function
b(z)
= 23. + (Apl - y (z +dO)H(-z- d 0
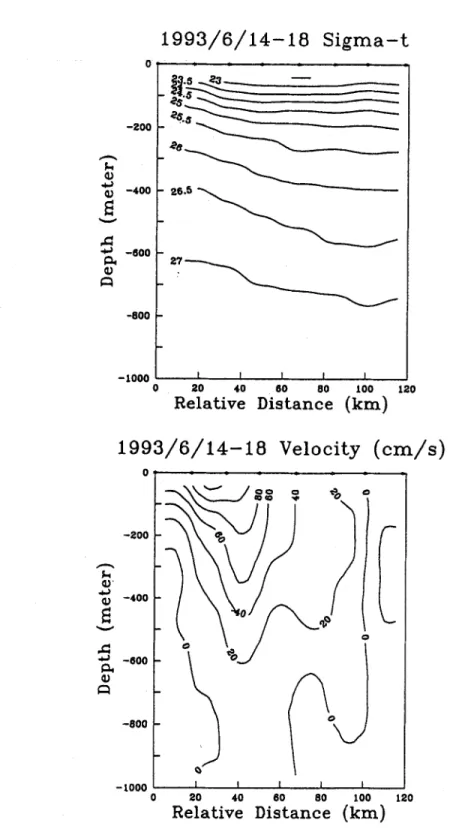
characterizes the background stratification and has no contribution to the velocity structure of the jet. dl is the thermocline depth far offshore from the jet, Apl is the density jump (in o~ unit) across the thermocline, H is the Heaviside step function, which is zero for z > -d~ and unity for z ~ -dl, and y characterizes the stratification below z = - d l .For the Kuroshio east of Taiwan, the information is inadequate about its structure and the associated variation. Chu (1976) showed that the Kuroshio transport at 24~ may vary from 19 Sv to 42 Sv. In the following discussion, the parameters used in the above density equation are based on a zonal density transect across the Kuroshio at 25~ from 122030 ' E to 123040 ' E, observed during 1993/6/14-18, Fig. 8. The origin of the relative distance in Fig. 8 is at 122~ ' E, 25~ The data at this transect may be regarded to represent the portion of Kuroshio that enters the southern Okinawa trough northeast of Taiwan. The velocity transect shown in Fig. 8 is the geostrophic velocity, calculated from the density transect with an assumed level of no motion at 1000 m.
According to Fig. 8, we infer that the jet is about 120 km wide, 500 m thick and has a total northward transport about 20 Sv. The density field shows that there is a surface mixed layer about 100 m thick, for which ~ is less than 23. Beneath the mixed layer, the ~ has a horizontal jump about 1-1.5. Far offshore from the jet, there is a thermocline at the depth range 100-200 m, and the ~ jump across the thermocline is about 1.5. Hence for the modeled Kuroshio, we chose Ap = 0.64, Lx = 70 km, D = 475 m, d = 125 m, d l = 150 m, and y = 3.6/1000 m. We also chose the level of no motion at 1000 m, the maximum depth of the model basin, then the jet has a total transport about 23 Sv, consistent with the above estimated Kuroshio transport that enters the southern Okinawa trough.
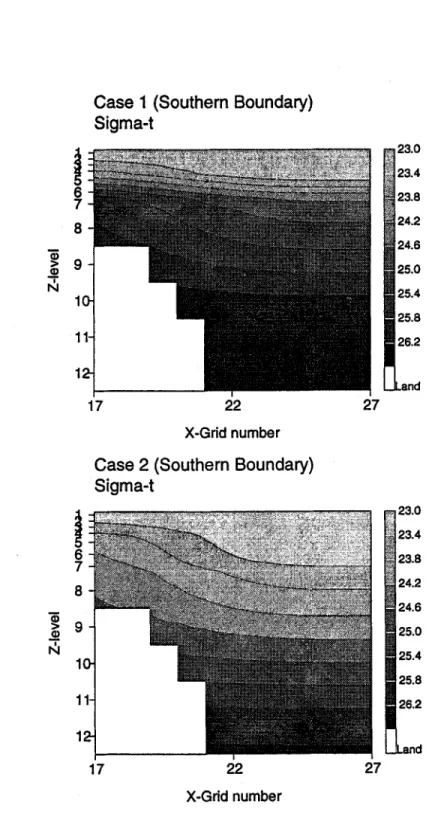
From the discussion in the previous section, we know that the presence e r a thermocline only occurs in summer. Hence we chose Ap~ = 1.2 to represent the summer condition, Case 1, and Apl = 0 to represent the spring condition, Case 2. Figure 9 shows the density transect across the jet at the southern boundary of our model basin of these two cases. In both cases, the incoming jet has the same horizontal density gradients, hence the same velocity structure, and the same volume transport about 23 Sv flowing into the southern open boundary. The northward transport in the Taiwan Strait is held at 1.5 Sv, with water density equal to 23 (in ~ unit) for both cases. The numerical method of computation is essentially the same as that of Chao (1991), except
Influence of the Seasonal Thermocline on the Intrusion of Kuroshio 701 0 I -ZOO ~'~ -400 "~ - 8 0 0 r -800
1993/6/14-18 Sigma-t
1, I 9 ~ J I 27 -1000 I I 1 I I 0 20 4.0 00 80 100 R e l a t i v e D i s t a n c e ( k i n ) 12.0 (D V1993/6/14-18
0 ~ t - 2 0 0 -400 -000 -800 - - t O 0 0 0Velocity (cm/s)
:L/.I
O I I 20 40 R e l a t i v e I I I 60 00 100 D i s t a n c e ( k m ) 120702 C.-S. Chcrn and J. Wang
m
>=
_v
Case I (Southern Boundary)
Sigma-t
17 22 X-Grid number 27 m=>
6 7 8 1[ .Case 2 (Southern Boundary)
Sigma-t
17 22 27
X-Grid number
Fig. 9. A zonal density (in at) section at the southern model boundary; the annotations are the grid numbers in the horizontal axis and the level numbers in the vertical axis.
Influence of the Seasonal Thermocline on the Intrusion of Kuroshio 703
that the sponge layer at the northern boundary is removed in the present work. At the northern open boundary, we use the condition of no normal gradient, which is equivalent to the radiation condition for the steady-state solution. At the southern open boundary, the density and velocity fields are held f'hxed at their initial values. The velocity fields, shown in Chao's model, have many small-scale meanders. To obtain a smooth flow pattern, we increased the horizontal viscosity to 10 ~ cm2/s, the vertical viscosity and diffnsivity to 2 cm2/s, whereas the horizontal diffusivity of the density field remained 4 x 1 ~ cm2/s. The flow still remains in geostrophic balance in the cross-stream direction and the nonlinear processes are important above obstacles.
The numerical model was integrated for 300 days. About 200 days after onset of the model, the flow reached a quasi-steady state. There is no appreciable alteration of the solution from this date until the end of the simulation period. Figures 10 and 11 show the horizontal distribution of the density and velocity fields at depths 12 m and 87 m at day 200 of the two cases. The main stream of Kuroshio turns northeast as it approaches the ridge south of the Okinawa trough in both cases. At the western end of the Okinawa trough, the velocity field is distinct for these two cases. In Case 1, Fig. 10, the surface velocity is fairly weak there and the Kuroshio surface water forms a weak front with the shelf water northeast of Taiwan. Near the bottom of the shelf (at 87 m), the upwelled high-density water intrudes onto the shelf and its front with the low density shelf water is located on the shelf. In Case 2, Fig. 11, the surface intrusion of the Kuroshio shoreward water onto the shelf area occurs, and the intrude water forms a F-shaped front with the shelf water.
Figure 12 shows a meridional density transect of the top 8 levels (the upper 400 In) at x-grid number 18, about 40 km from the east coast of Taiwan, of those two cases. It clearly shows that the presence of a thermocline inhibits the amplitude of the disturbance, created in the flow over the Su-Ao ridge. The surface intrusion of the shoreward Kuroshio water onto the shelf is associated with the large-amplitude internal disturbance between the Su-Ao ridge and the shelf break in Case 2.
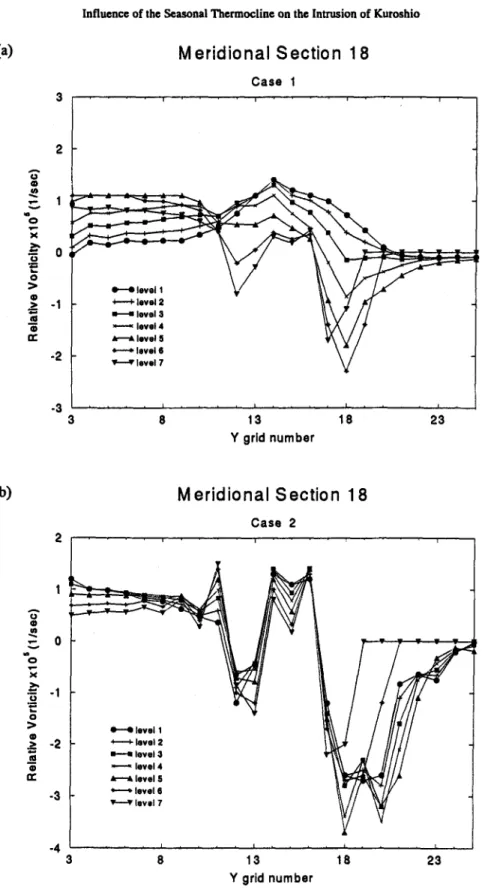
Figure 13 shows the vertical component of the relative vorticity in the top seven levels (the upper 250 m) at a meridional section x = 18 for both cases. As this section is at the west side of the Kuroshio main axis, Figs. 10 and 11, the relative vorticity is positive along this line upstream of the Su-Ao ridge, at gridy = 13. As the flow passes over the Su-Ao ridge, and the shelf break, at gridy = 18, a disturbance of negative relative vorticity is induced, consistent with conservation of the potential vorticity. The presence of a strong thermocline, Case 1, confines the disturbance beneath it. Then the flow above and below the thermocline forms a decoupled mode. In contrast, the disturbance associated with the bottom topography can extend to the surface level in Case 2. Figure 14 shows the horizontal distribution of the velocity and the vertical component of the relative vorticity at surface level in the vicinity of Taiwan northeast offshore of these two cases. In Case 1, the surface flow doesn't sense much about the variation in the bottom topography. The relative vorticity has a similar cross-stream distribution, positive near the coast and negative east of the main flow, along the east coast of Taiwan. The flow near the Taiwan east coast flows steadily northward. Meanwhile, part of the transport from the Taiwan Strait flows seaward along the coast of northern Taiwan. The Taiwan northeast offshore region is the convergence zone of these two waters. Then the surface velocity becomes weak there as shown in Fig. 14. As the northward flowing Kuroshio becomes a near-bottom current in front of the shelf break of the ECS, it will be deflected by the shelf break, according to the conservation of potential vorticity, shown by Hsueh et al. (1993).
In Case 2, the disturbances of negative vorticity induced by the Su-Ao ridge and the shelf break present in the surface level. Between these two negative vorticity regions, there is an area
704 C.-S. Chem and J. Wan 8 A E p..,. ~ . Q O O O > , > 9 =,.,. O qr=,= | O ) o3 r t O O O O O u 3 ";:l" 0 3 O,,! Jeqwnu pp6o)~ O~ ~ 03 ~'~ ~ ~ , ~ o'3 t ~ ~, ,~ ~ ~ ~ 9 . 0 o o t o 1,0 o o o o JequJnu p.uS- A o ..el t "~ E o0 r " O X ~J .9o q3
~=
I"O I "-= ;=.., O " r162Influence of the Seasonal Thermocline on the Intrusion of Kuroshio 705 04 04 __ ~1 04 r 04 04 ~1 (11 I ~ , ~ ~ = I E
=0>,
C 3 0 o 4 . ~, o o ( n O C ) 0 0 0 Jeqmnu PP~',L E O O ? O 143 o~ ',,'- 03 ~ P,,. o~ '="- 03 up "~ 04 o,I 04 o4 ~ 04 o,I 04 ._j O O O O '~" 0 3 r , r - Jeqtunu p.uB-A " 0 r 0 cJ 0 ..Q t ~ E o0 C r " 0 t~ o o " 0 t~ o " 0 0 ,.a 0 E"==
I~ o ~ t~ ~ o ~ • 0 N 0 9 t N706 C.-S. Chcm and J. Wang m _.r 1 2 3 4 5 6 7
Case 1 (Meridional Section 18)
Sigma-t
m>=
_v | N 1 2 3 4 5 6 7 8 13 18 Y-Grid numberCase 2 (Meridional Section 18)
Sigma-t
3 8 13 18 Y-Grid number 23 23.0 23.4 23.8 24.2 24.6 25.0 25.4 25.8 26.2 Land 23Fig. 12. Meridional density (in 5 ) section of the upper 8 levels at x-grid number 18 of the flows shown in Figs. 9 and 10.
(a)
Influence of the Seasonal Thermocline on the Intrusion of Kuroshio
Meridional Section 18
C a s e 1 707 2 A r . 1 v 1 0 -1 -2 -3 +"--+ level 2 I -- : level 3 level 4 level 5 : ~ level 6 level 7 8 13 18 2 3 Y g r i d n u m b e rCo)
Meridional Section 18
C a s e 2 1 A
i ~
-1 -3 -4 , , J i , I i I i , h i I , , , , [ 8 13 1 8 2 3 Y grid numberFig. 13. Relative vorticity o f the upper 7 levels at the meridional sectionx = 18 o f the flows shown in Figs. 9(a) and 10(b).
708 C.-S. Chem and J. Wang E CN 0 0 0 0 > , > v 0 0 A E 0 0 0 0 > , > > , o ~ (0 I 0 4" 0 0 0 0 CO 0,1 ",=" Jeq,,,nu
P!J6-A
e= I 0 + _.~ 0 0 0 0 CO 0 4 ",'- .~equJnu pU6-A-ax_~
. - ~~ , ~ x
0 - - a ~ o 0 U ~ o e- *,'~ t'Q " 0 X o ~ " 9Influence of the Seasonal Thermocline on the Intrusion of Kuroshio 709
of positive relative vorticity in the western end of the Okinawa trough, Figs. 13(I)) and 14. The negative vorticity above the Su-Ao ridge is accompanied with a seaward turning of the incoming flow and the positive vorticity north of the Su-Ao ridge will push the flow back toward coast. Then the flow encounters the shelf break and has to intrude onto the shelf. The velocity pattern and vorticity distribution shown in Fig. 14 clearly demonstrate this process.
According to the above discussion, the on-shelf intrusion of Kuroshio depends on the surface strength of the disturbance induced above the Su-Ao ridge. The presence of a strong thermocline in the Kuroshio can diminish this disturbance considerably in the surface layer. Then the flow is blocked by the shelf break.
4. Discussion and Concluding Remarks
The circulation on the shelf north of Taiwan is determined by the dynamic balance between the flow from both side of the island. Both flows show distinct seasonal variations. In the Taiwan Strait, this variation is driven mainly by the monsoon winds. Its northward transport reaches a maximum in summer and decreases to about zero in winter. In contrast, the seasonal variation of the Kuroshio intrusion onto ECS northeast of Taiwan has no direct link to the monsoon variations (Tang and Yang, 1993).
The hydrographic data presented here indicate that the interaction between the seasonal thermocline of the Kuroshio and the bottom topography is the main process to affect the intrusion of surface Kuroshio water onto the shelf there. As the Kuroshio flows over the Su-Ao ridge, a disturbance of negative relative vorticity is induced. When there is a thick surface-mixed layer in the Kuroshio,.which is the typical type in winter and spring, this disturbance can reach the surface-level. North of the Su-Ao ridge, the water becomes deep. Then the flow will get positive relative vorticity, by the stretching of water column, in this region. This alternating change sign of relative vorticity favors the shoreward movement of Kuroshio cold and saline water west of its main axis, as discussed in the previous section. Then some cold and saline Kuroshio surface water has to intrude onto the shelf.
As a strong thermocline is developed in the summertime, the disturbance above the Su-Ao ridge is limited below the thermocline. At this time, the movement of water above the thermocline is independent of the flow interaction with the bottom topography. Then the shoreward movement of Kuroshio surface water is absent at northeast offshore of Taiwan. Hence the warm and less saline shelf water can spread seaward along the northern coast of Taiwan and decelerate the northward flowing surface Kuroshio along the east coast of Taiwan.
A numerical model was used to examine this process. The numerical results are in good agreement with observation. As mentioned previously, in order to obtain a smooth flow field, we chose the horizontal eddy viscosity to be 107 cm2/s. This choice has not increased the relative importance of the frictional stresses over other terms in the momentum equation. Figure 15 shows the magnitude of all terms in the x- and y-components of the momentum equation at the surface level along the meridional sectionx = ! 8 at day 200 of Case 2. In Fig. 15, (U, V, W) are the velocity components in the (x, y, z) axes respectively, f i s the Coriolis parameter, P is
p/p,
in which p is the pressure and p is a reference water density, and the subscript denotes partial derivative. We infer that the x-component of the momentum equation remains in geostrophic balance, Fig. 15(a), and that the nonlinear terms are important in the y-component of the momentum equation near the topographic features at grid numbersy = 13 andy = 18, Fig. 15(b). Hence the model is capable of resolving the nonlinear interactions between the Kuroshio and the irregular topography in the offshore area northeast of Taiwan.710
(a)
A E . g v "o ~ O_a
r -1 -3 -5~-S. Charn and L Wang
Meridional Section 1 8
Case 2 (level 1) J J i I 3 8 13 18 23 28 33 Y grid n u m b e r H ( U U ) , (VU), H (WU), x--.~ N Vertical stre,=s Horizontal =tressCo)
2 1 E @ C -2Meridional Section 18
Case 2 (level 1) 9 . : . ! . . . L .... I ... I .... r . " , I 8 13 18 23 28 33 Y grid n u m b e r H ( u v ) , +--+ (VV), H (WV), -fU "PT 9 ~ 9 Vortical stress Horizontal stressFig. 15. Magnitude of terms in the x-component (a) andy-component Co) of the momentum equation at surface level along the meridional section x = 18 of the flow shown in Fig. 11.
Influence of the Seasonal Thermocline on the Intrusion of Kuroshio 711
In summary, both the hydrographic surveys and numerical model results show that the interaction of the Kuroshio seasonal thermocline, and the bottom topography is the main process to affect the intrusion of surface Kuroshio water, onto the shelf northeast of Taiwan. The seasonal variation of the Kuroshio's path at this area certainly depends on m~any other processes not considered here, e.g. surface winds, variation of Kuroshio transport, etc. At present, the information is insufficient to perform an accurate numerical simulations of the flow in this complicated topography area. More observational efforts are needed.
Acknowledgements
We thank the National Science Council of the Republic of China (Grant NSC 83-0209- M002a-15-K) for support.
R e f e r e n c e s
Chao, S. Y. (1991): Circulation of the East China Sea, A numerical study. J. Oceanogr. Soc. Jpn., 46(6), 273-295. Chern, C. S. and J. Wang (1992): On the seasonal variation of the Kuroshio intrusion onto the East China Sea.Acta
Oceanogr. Taiwanica, 29, 1-17.
Chu, T. Y. (1976): Study of the Kuroshio current between Talwan and Ishigakijima. Actu Oceanogr. Taiwanica, 6,
1-24.
Hsueh, Y., J. Wang and C. S. Chern (1992): The intrusion of the Kuroshio across the continental shelf northeast of Taiwan. J. Geophys. Rest, 97, C9, 14323-14330.
Hsueh, Y., C. S. Chern and J. Wang (1993): Blocking of the Kuroshio by the continental shelf northeast of Taiwan.
J. Geophys. Res., 98, C7, 12351-12359.
Semtner, A. J. (1974): An oceanic general circulation model with bottom topography. Numerical Simulation of
Weather and Climate, Tech. Rep. 9, Dept. of Meteorology, UCLA, 99 pp.
Semtner, A. J. (1986): Finite difference formulation of a world ocean model. Proceedings of the NATO Advanced
Study Institute on Advanced Physical Oceanographic Numerical Modelling, ed. by J. J. O'Brien, D. Reidel
Publishing Co., Dordrecht, 608 pp.
Seung, Y. H. and S. Y. Nam (1992): A numerical study on the barotropic transport of the Tsushima Warm Current.
Lamer, 30, 139-147.
Sun, X. (1987): Analysis of the surface path of the Kuroshio in the East China Sea. p. 1-14. In Essays on the In-
vestigation ofKuroshio, ed. by X. Sun, Ocean Press, Beijing (in Chinese with English abstract).
Tang, T. Y. and Y. J. Yang (1993): Low frequency current variability on the shelf northeast ofTaiwan.Y. Oceanogr.,
49, 193-210.
Wang, J. and C. S. Chern (1988): On the Kuroshio branch in the Taiwan Strait during wintertime. Prog. Oceanogr.,