P R O C E E D I N G S
Open Access
The genomic features that affect the lengths of 5
’
untranslated regions in multicellular eukaryotes
Chun-Hsi Chen
1, Hsuan-Yu Lin
1, Chia-Lin Pan
1, Feng-Chi Chen
1,2,3*From Ninth Annual Research in Computational Molecular Biology (RECOMB) Satellite Workshop on
Com-parative Genomics
Galway, Ireland. 8-10 October 2011
Abstract
Background: The lengths of 5’UTRs of multicellular eukaryotes have been suggested to be subject to stochastic changes, with upstream start codons (uAUGs) as the major constraint to suppress 5’UTR elongation. However, this stochastic model cannot fully explain the variations in 5’UTR length. We hypothesize that the selection pressure on a combination of genomic features is also important for 5’UTR evolution. The ignorance of these features may have limited the explanatory power of the stochastic model. Furthermore, different selective constraints between vertebrates and invertebrates may lead to differences in the determinants of 5’UTR length, which have not been systematically analyzed.
Methods: Here we use a multiple linear regression model to delineate the correlation between 5’UTR length and the combination of a series of genomic features (G+C content, observed-to-expected (OE) ratios of uAUGs, upstream stop codons (uSTOPs), methylation-related CG/UG dinucleotides, and mRNA-destabilizing UU/UA dinucleotides) in six vertebrates (human, mouse, rat, chicken, African clawed frog, and zebrafish) and four invertebrates (fruit fly, mosquito, sea squirt, and nematode). The relative contributions of each feature to the variation of 5’UTR length were also evaluated.
Results: We found that 14%~33% of the 5’UTR length variations can be explained by a linear combination of the analyzed genomic features. The most important genomic features are the OE ratios of uSTOPs and G+C content. The surprisingly large weightings of uSTOPs highlight the importance of selection on upstream open reading frames (which include both uAUGs and uSTOPs), rather than on uAUGs per se. Furthermore, G+C content is the most important determinants for most invertebrates, but for vertebrates its effect is second to uSTOPs. We also found that shorter 5’UTRs are affected more by the stochastic process, whereas longer 5’UTRs are affected more by selection pressure on genomic features.
Conclusions: Our results suggest that upstream open reading frames may be the real target of selection, rather than uAUGs. We also show that the selective constraints on genomic features of 5’UTRs differ between vertebrates and invertebrates, and between longer and shorter 5’UTRs. A more comprehensive model that takes these findings into consideration is needed to better explain 5’UTR length evolution.
* Correspondence: fcchen@nhri.org.tw
1Division of Biostatistics and Bioinformatics, Institute of Population Health
Sciences, National Health Research Institutes, Zhunan, Miaoli County, 350 Taiwan, Republic of China
Full list of author information is available at the end of the article
© 2011 Chen et al; licensee BioMed Central Ltd. This is an open access article distributed under the terms of the Creative Commons Attribution License (http://creativecommons.org/licenses/by/2.0), which permits unrestricted use, distribution, and reproduction in any medium, provided the original work is properly cited.
Background
The length evolution of 5’ untranslated region (5’UTR) is an important topic in the evolution of eukaryotic genomes [1-8]. On the one hand, 5’UTRs of significant lengths are evolutionarily disadvantageous because they increase the energy cost in transcription and the risk of integrating pre-mature start codons (upstream AUGs or“uAUGs”) and unfavourable mRNA secondary structures, both of which may prevent efficient protein translation [9,10]. On the other hand, 5’UTRs may contain cis-regulatory elements that can modulate transcription and/or translation, which potentially can convey advantages to the carrier organisms in the face of changeable environments [8,11]. However, the changes in 5’UTR length may have only minor fitness effects in most of the cases because such changes may affect the abundance (or presence), rather than the biolo-gical functions of the affected proteins. As such, random genetic drift should play an important role in the length evolution of 5’UTR, particularly for organisms with a small effective population size. Lynch and colleagues pro-posed a null model for 5’UTR length evolution, which considers the gains/losses of transcription initiation signals (TISs) as a stochastic process that causes variations in 5’UTR length, and the selection against uAUGs as the major force to restrain unlimited elongation of 5’UTRs [7]. In Lynch et al’s simulation study, the model effectively depicted the skewed distributions of 5’UTR length in eukaryotes [7]. Nevertheless, Lynch et al’s model does not consider the potential influences of background genomic features. For example, by incorporating the factor of G+C content in simulation studies, Reuter and colleagues demonstrated that mutational bias also has an effect on 5’UTR length [6]. They suggested that G+C content could affect the probability of stochastic gains/losses of TIS, thus affecting the lengths of 5’UTRs. However, Reuter et al. demonstrated only a weak positive correlation between 5’UTR length and G+C content. Considering the relatively small explanatory power of Reuter et al.’s model, we hypothesize that G+C content may be only one of the many genomic features that affect 5’UTR length [6].
One important feature that may affect 5’UTR length is the presence of upstream open reading frames (uORFs). A uORF is composed of one uAUG, one in-frame stop codon downstream of the uAUG, and at least one non-stop codon in between [10]. uORFs can significantly reduce the efficiency of protein translation, and are thus potentially deleterious. In Lynch et al’s stochastic model, the selection against uAUGs is regarded as the only effect to limit 5’UTR elongation. Considering the importance of uORFs, we reason that stop codons within 5’UTRs (upstream stop codons, or“uSTOPs”) may also play an important role in affecting 5’UTR length. The influences of uSTOPs on 5’UTR length, however, have not been sys-tematically analyzed.
In addition to uAUG and uSTOPs, certain dinucleo-tides may also affect 5’UTR length. For example, the highly mutable CG dinucleotides can easily change into TG (or UG in mRNA) because of methylation-induced spontaneous deamination of cytosine [12]. Such biased mutation will lead to overrepresentation of UG and CA dinucleotides in heavily methylated genomic regions. Notably, the UG dinucleotide can combine with adenine to form either a start (AUG) or a stop (UGA) codon. Therefore, the UG dinucleotides in 5’UTRs are expected to be evolutionarily constrained. Also noteworthy is that the prevalence of CG methylation in gene body differs considerably between vertebrates and invertebrates [13,14]. It is of interest to investigate whether this differ-ence is reflected in the genomic determinants of 5’UTR length.
Aside from the abovementioned features, the dinucleo-tides that affect mRNA stability may also have some effects on 5’UTR length. The UA and UU dinucleotides are particularly important because both are targeted by ribonuclease for mRNA degradation [15,16] Therefore, overrepresentation of UA/UU dinucleotides may hamper the elongation of 5’UTRs. Moreover, UA is also a subse-quence of the UAA stop codon. Therefore, these dinucleo-tides are supposedly also associated with 5’UTR length evolution.
In the study, we attempt to examine the effects of the above genomic features on the lengths of 5’UTRs. We use a multiple linear regression model to delineate the correlations between 5’UTR length and the linear combi-nation of these features in six vertebrate (human, mouse, rat, chicken, African clawed frog, and zebrafish) and four invertebrate species (fruit fly, mosquito, sea squirt, and nematode). We find that the linear combination of these genomic features can explain a significant proportion of the length variations of 5’UTRs in the ten examined spe-cies. Furthermore, the relative contributions of the geno-mic features differ among lineages, suggesting a potential role of lineage-specific genomic features in the evolution of 5’UTRs. Intriguingly, in all of the ten examined spe-cies, uSTOPs play a more important role than uAUGs, which differs from the well recognized concept that uAUGs play a dominant role in 5’UTR evolution. Our study thus brings new insights into the length evolution of 5’UTR in multi-cellular eukaryotes.
Methods
Sequences of 5’ untranslated regions
The sequences of 5’UTRs were retrieved from UTRdb (http://utrdb.ba.itb.cnr.it/; updated in July 2010), which harboured the sequences and annotations of experimen-tally validated 5’UTRs [17]. The species with relatively abundant 5’UTR information were selected, including six vertebrates – human (Homo sapiens), mouse (Mus
musculus), rat (Rattus norvegicus), chicken (Gallus gallus), African clawed frog (Xenopus tropicalis), and zebrafish (Danio rerio), and four invertebrates– fruit fly (Drosophila melanogaster), mosquito (Anopheles gam-biae), sea squirt (Ciona intestinalis), and nematode (Caenorhabditis elegans). Only the genes with experi-mentally validated protein products were retained. In case of alternative splicing, one transcript was randomly selected to avoid overweighting of certain genes.
The observed-to-expected ratio of tri- and di-nucleotides
The observed-to-expected (OE) ratios of tri- and di-nucleotides were derived to measure the strength of selection pressure on these genomic components. The OE ratio is simply the observed number of tri- or di-nucleotides divided by its expected number. The expected number of tri- or di-nucleotides was calculated as follows [14]:
E N L fi
i
( )
=∏
(1)where fiis the frequency of nucleotide i (A, U, C, or G),
and L is the length of the sequence of interest. For example, the expected number of AUG equals to L × fA× fU× fG.
Construction of linear regression models
All the statistical analyses were performed by using the R program (http://www.r-project.org). The multiple linear regression model is as follows:
E Y iXi
i n
( )
=b0+∑
b +e (2)where Y stands for the 5’UTR length (log 10 scale), variables Xi include the G+C content, the OE ratios of
trinucleotides AUG, UGA, UAA, UAG, and dinucleo-tides CG, UG, UU, and UA.
A standard procedure for model selection was used to exclude the genomic features that did not significantly associate with 5’UTR length [18]. To evaluate whether collinearity between genomic features may affect our model, the variance inflation factors (VIF) of each fea-ture were calculated for each species. The VIF measures the increase of the variance of a genomic feature due to its dependency on other features. If a feature has a VIF larger than 10, the correlation between the dependent variable (5’UTR length) and the feature is suggested to depend on other genomic features. In this case, it is dif-ficult to evaluate the effects of individual features on 5’UTR length. Since the VIF in our models were all smaller than 10 (Additional file 1), collinearity between genomic features did not appear to affect our models.
To construct the regression model, we first examined the genomic features to be analyzed in our 5’UTR data-set. We found that approximately half of the 5’UTRs had lengths smaller than 160 bp, and that more than half of the 5’UTRs had at least one zero-OE ratio of trinucleotide. To minimize the number of such non-informative entries, we excluded the 5’UTRs with more than one zero-OE ratios.
To measure the relative importance of each genomic feature, the relative contribution to variability explained (RCVE) was calculated [19]. An RCVE was calculated as follows: RCVE R R R full reduced full = − 2 2 2 (3)
where Rfull2 and Rreduced2 stand for the R
2
value of the full model (which includes all of the analyzed genomic features) and in a reduced model, respectively. A reduced model was established by removing one genomic feature of interest. A large RCVE indicates a significant contribu-tion of the genomic feature of interest to the regression model [19].
The minimal length of a sequence for a specific trinucleotide to occur by chance
The minimal length of a sequence for a specific type of trinucleotide to occur by chance can be easily estimated by replacing the left half of equation (1) with unity. In other words, the minimal length is the reciprocal of
fi i
∏
. For example, the minimal length of a sequence for an AUG trinucleotide to occur by chance is 1/(fA×fU× fG).
Results
Approximately 14%~33% of the length variations of 5’UTRs can be explained by the underlying genomic features
We selected ten well-studied animal species for compari-son, including six vertebrates and four invertebrates (see Methods). The genomic features examined here include G+C content, the OE ratios of AUG, UGA, UAA, and UAG trinucleotides, and the OE ratios of CG, UG, UA, and UU dinucleotides. The OE ratio measures whether the frequency of a specific dinucleotide or trinucleotide deviates from expectation. If the OE ratio is close to unity, the observed di- or tri-nucleotides may have occurred simply by chance. In other words, these di- or trinucleotides are likely subject to neutral selection. We used these measurements as candidate predictors to establish a multiple regression model to predict 5’UTR length in the ten examined species. The backward model
selection approach was employed to remove candidate genomic features that do not associate significantly with 5’UTR length. The VIFs were calculated for each species to examine whether collinearity existed among the exam-ined genomic features. Our results show that collinearity does not exist between any pair of predictors (all VIF < 10, Additional file 1) despite the fact that some of the genomic features are correlated (e.g. UG and AUG). Accordingly, we can investigate how individual genomic features correlate with 5’UTR length.
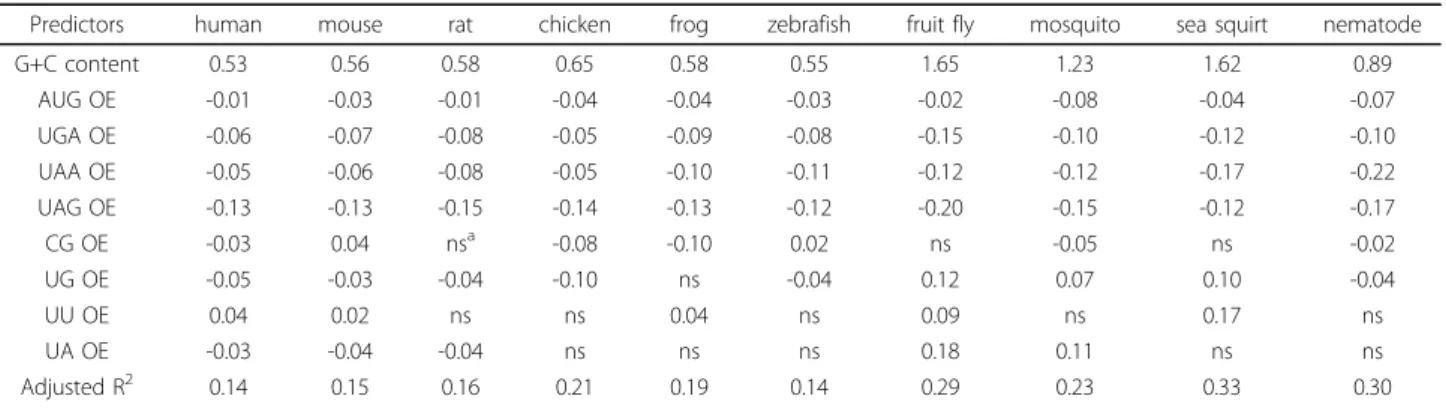
The R2 values of the models fall between 0.14 and 0.33, indicating a good explanatory power for within-species 5’UTR length distribution in all of the studied species (Table 1). Interestingly, the invertebrate regres-sion models have higher R2 values (0.23~0.33) than those of vertebrates (0.14~0.21), suggesting that the lin-ear combination of the selected genomic features can explain 5’UTR length better for invertebrates than for vertebrates. Among the statistically significant determi-nants of 5’UTR length, the G+C content and the OE ratios of the four trinucleotides (uAUG and uSTOPs) are shared by all of the ten analyzed species. By contrast, whether the OE ratios of dinucleotides are good predic-tors of 5’UTR length appears to be lineage-dependent (Table 1). The most widely applicable dinucleotide pre-dictor is the UG dinucleotide, which is shared by all of the studied species except for the African clawed frog.
Associations between 5’UTR length and individual genomic features
The correlations between 5’UTR length and five geno-mic features (G+C content, uAUG OE, and the OE ratios of uSTOPs) are consistent across all species (Table 1): G+C content is positively correlated with 5’UTR length, whereas all of the other four genomic fea-tures show a negative correlation. There are two possi-ble reasons for the positive correlation between G+C content and 5’UTR length. First, genes with AT-rich TISs tend to have longer 5’UTRs in G+C-rich genomic
regions because it is difficult to find an alternative TIS in such a region once the original TIS is disrupted [6]. Second, a higher G+C content leads to a lower probabil-ity of random occurrence of AUGs. The decreased num-ber of uAUGs may have allowed the stochastic extension of 5’UTRs [7]. Meanwhile, among the four OE ratios of dinucleotides, only the OE ratio of UU shows a consistently positive correlation with 5’UTR length across multiple species (Table 1), although the reason for the correlation remains unclear.
G+C% and selection on uSTOPs contribute most to the variations in 5’UTR length
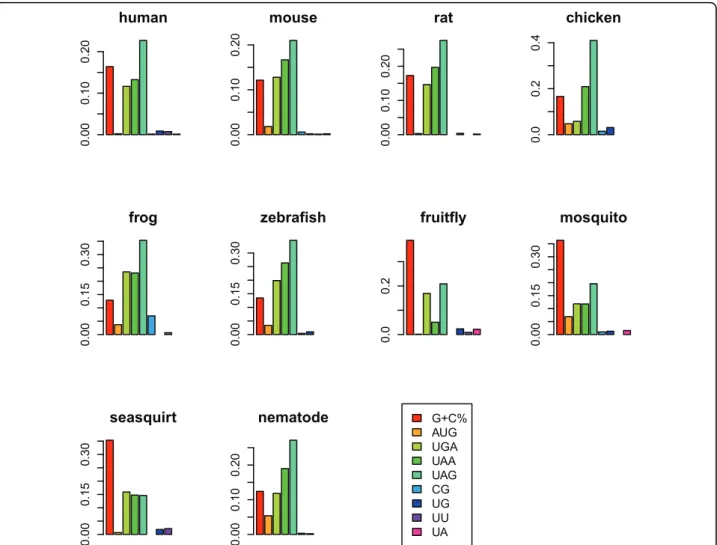
To evaluate the extent each genomic feature affects the 5’UTR length, we calculated the relative contribution to variability explained (RCVE, see Methods) [19]. As shown in Figure 1, G+C content is the dominant determinant in three of the four studied invertebrates (fruit fly, mosquito, and sea squirt), whereas UAG OE is the most influential determinant in all of the six vertebrates and nematode. Similar results can be seen in the partial correlation ana-lyses, where the correlation between 5’UTR length and each individual feature is evaluated while the other geno-mic features are controlled (Table 2). Surprisingly, the selection on uAUGs (AUG OE ratio) appears to play a relatively minor role in affecting 5’UTR length. Meanwhile, the surprisingly large RCVEs of uSTOP OE ratios suggest the importance of these trinucleotides in 5’UTR length evolution (Figure 1). Considering that uAUGs and uSTOPs together can form uORFs, our observation seems to imply that the major target of selection in 5’UTRs is likely uORFs, rather than uAUGs per se. Indeed, we found that the presence/absence of uORFs is significantly corre-lated with 5’UTR length (Additional file 2). We have also tried to include the information of secondary struc-ture by adding into the regression the number of quad-ruplexes (predicted by Quadparser [20]). However, G-quadruplexes have only small effects on 5’UTR length (Additional file 3).
Table 1 Coefficients of linear regression models for 5’UTR length prediction
Predictors human mouse rat chicken frog zebrafish fruit fly mosquito sea squirt nematode
G+C content 0.53 0.56 0.58 0.65 0.58 0.55 1.65 1.23 1.62 0.89 AUG OE -0.01 -0.03 -0.01 -0.04 -0.04 -0.03 -0.02 -0.08 -0.04 -0.07 UGA OE -0.06 -0.07 -0.08 -0.05 -0.09 -0.08 -0.15 -0.10 -0.12 -0.10 UAA OE -0.05 -0.06 -0.08 -0.05 -0.10 -0.11 -0.12 -0.12 -0.17 -0.22 UAG OE -0.13 -0.13 -0.15 -0.14 -0.13 -0.12 -0.20 -0.15 -0.12 -0.17 CG OE -0.03 0.04 nsa -0.08 -0.10 0.02 ns -0.05 ns -0.02 UG OE -0.05 -0.03 -0.04 -0.10 ns -0.04 0.12 0.07 0.10 -0.04 UU OE 0.04 0.02 ns ns 0.04 ns 0.09 ns 0.17 ns UA OE -0.03 -0.04 -0.04 ns ns ns 0.18 0.11 ns ns Adjusted R2 0.14 0.15 0.16 0.21 0.19 0.14 0.29 0.23 0.33 0.30 a ns, not significant
Discussion
We have demonstrated that genomic features can explain 14%~33% of the length variation of 5’UTR in multi-cellu-lar animals. These genomic features include the G+C
content, the OE ratios of uAUG, uSTOPs, and CG, UG, UU, and UA dinucleotides. The RCVE analysis demon-strates that the most predominant determinants of 5’UTR length common to vertebrates and invertebrates (except
human 0.00 0.10 0.20 mouse 0.00 0.10 0.20 rat 0.00 0.10 0.20 chicken 0.0 0.2 0.4 frog 0.00 0.15 0.30 zebrafish 0.00 0.15 0.30 fruitfly 0.0 0.2 mosquito 0.00 0.15 0.30 seasquirt 0.00 0.15 0.30 G+C% AUG UGA UAA UAG CG UG UU UA nematode 0.00 0.10 0.20
Figure 1 The relative contributions to variability explained (RCVE) of different genomic features in the analyzed species. The RCVE was
calculated according to the difference of R2between the full model (with all predictors) and the reduced model (remove one predictor of
interest). A large RCVE indicates a large contribution of a specific predictor.
Table 2 The coefficients in the partial correlations between 5’UTR length and each predictor while other genomic features are controlled
Predictors human mouse rat chicken frog zebrafish fruit fly mosquito sea squirt nematode
G+C content 0.160 0.148 0.143 0.211 0.170 0.146 0.366 0.317 0.389 0.226 AUG OE -0.023 -0.059 ns -0.116 -0.090 -0.074 -0.026 -0.145 -0.075 -0.145 UGA OE -0.135 -0.152 -0.163 -0.125 -0.209 -0.176 -0.252 -0.188 -0.262 -0.218 UAA OE -0.144 -0.173 -0.187 -0.201 -0.213 -0.186 -0.141 -0.187 -0.262 -0.244 UAG OE -0.187 -0.193 -0.215 -0.253 -0.235 -0.207 -0.272 -0.239 -0.267 -0.290 CG OE nsa 0.035 ns -0.069 -0.122 0.028 ns -0.059 ns -0.043 UG OE -0.039 -0.024 ns -0.105 ns -0.034 0.092 0.062 ns ns UU OE 0.036 ns ns ns 0.044 ns 0.061 ns 0.125 ns UA OE ns -0.023 ns ns ns ns 0.093 0.069 ns ns a ns, not significant. b
for nematode) are the G+C content and the OE ratios of uSTOPs. The effects of dinucleotides appear to be weaker than trinucleotides. This observation implies that dinu-cleotide-related biological consequences (such as CpG methylation, mutational biases towards AT, and UU/UA-associated destabilization of mRNA) may have only minor effect on 5’UTR evolution.
There are a few limitations in the study. First, in our analysis, we excluded 5’UTRs with insufficient informa-tion. The 5’UTRs with zero-OE ratios are excluded because we are not sure whether the zero-OE ratios are a consequence of selection or they occur simply by chance (because of the short length of 5’UTR). Therefore, our linear regression model is applicable mainly for longer 5’UTRs. The lengths of shorter 5’UTRs may have been affected more by random processes (see the discussion below). Note that we have tried to exclude 5’UTRs shorter than a certain length threshold (e.g. 30 Bp). How-ever, this approach actually skews the distribution of 5’UTR length away from normality (Additional file 4), which may compromise the applicability of the linear regression analysis. Therefore, excluding 5’UTRs with zero-OE ratios appears to be more suitable for this study. Second, we do not take into consideration the influences of neighbouring genomic regions. For example, the G+C content in the intergenic region upstream of a 5’UTR could affect the probability of stochastic 5’UTR elongation when the TIS (can be either G+C-rich or A+ T-rich) is somehow disrupted [7]. Therefore, the sequence motif of TIS and the G+C content upstream of a 5’UTR may together affect its length. Unfortunately, TISs remain unknown for a large fraction of genes, which has restricted researchers from addressing this important issue.
In spite of the above limitations, the study has demon-strated that 5’UTR length in multi-cellular eukaryotes are affected by certain genomic features, in addition to ran-dom genetic drift and selection against uAUGs. Since many eukaryotic species have a very small effective popu-lation size, the influence of random genetic drift plays a major role for the evolution of sequences whose muta-tions usually have weak fitness effect (e.g. 5’UTR) [7,21]. Nevertheless, the selection on certain genomic composi-tions remains important. One of the most influential genomic features is uAUG. This type of trinucleotide can disturb normal translation and significantly reduce pro-tein abundance [10]. Interestingly, our analysis shows that an upstream stop codon (UAG) plays an even more important role in this regard. This observation seems to suggest that the selection target is uORF (or the potential to form uORF) but not uAUG per se, for a uSTOP is an indispensable part of a uORF. Furthermore, a uAUG may have different levels of fitness effects when it is incorpo-rated in different types of uORFs. In the case of strictly upstream uORF (a uORF that is located entirely within a
5’UTR), a uAUG probably will cause reduced protein production of the main coding sequence (CDS) [10]. By contrast, in the case of overlapping uORF (a uORF with its uAUG in 5’UTR but its stop codon located within the downstream CDS), the translation that begins at the uAUG may cause skipping of the main start codon, and therefore, complete inhibition of normal protein transla-tion or productransla-tion of N-truncated proteins [5]. Both of the possible outcomes can be strongly deleterious. Gen-erally, overlapping uORFs occur less frequently than strictly upstream uORFs [22]. Therefore, although uAUGs not incorporated in strictly upstream uORFs may turn out to be part of overlapping uORFs (and thus have a strong effect on translation), collectively they may have a smaller effect on 5’UTR length evolution than strictly upstream uORFs. An alternative explanation for the importance of uSTOPSs is that since overlapping uORFs are in general more deleterious than strictly upstream uORFs, uSTOPs may be favoured by selection because they can potentially prevent uORFs from extending into coding sequences.
Another common determinant is the G+C content, which is the most important determinant of 5’UTR length in all of the studied invertebrate species except for nema-tode. In comparison, for vertebrates, the influence of G+C content is second to uSTOPs. Since the G+C content is related to the stochastic elongation of 5’UTRs after the disruption of TISs [7], we speculate that this vertebrate-invertebrate divergence may have resulted from the differ-ence in the G+C content of the commonly used TISs between these two groups of organisms. For instance, TATA box (an AT-rich regulatory element), the best char-acterized transcription factor binding site (TFBS), appears to be used with different frequencies between vertebrates and invertebrates [23,24]. If such A+T-rich TFBSs are used for transcriptional initiation, a G+C-rich genomic context will lead to an increased level of 5’UTR elongation (as compared with an A+T-rich context) once the TFBSs are disrupted by mutations [6]. However, we do not know the exact proportions of A+T- and G+C-rich TFBSs in the studied species. Therefore, the real cause of the verte-brate-invertebrate difference in the determinants of 5’UTR length remains an open question.
Note that the lengths of 5’UTRs in multicellular eukar-yotes are determined by two major driving forces– the stochastic elongation due to reduced effective population size (for which G+C content is more important), and the selection against deleterious genomic features in longer 5’UTRs (for which the OE rations of uAUGs and uSTOPs are more important). Interestingly, the G+C content and 5’UTR length may actually affect the expected numbers of the trinucleotides. To highlight this point, we calcu-lated the minimal length of a sequence in which one spe-cific type of trinucleotide can be observed given a certain
G+C content (Methods, Additional file 5). If a 5’UTR has a length smaller than the minimal length, the selection on a certain trinucleotide is supposed to be less effective because the probability of the trinucleotide to occur by chance is very small. Since the trinucleotides examined in the study are mostly G+C-poor, the minimal lengths are positively correlated with the G+C content in most of the cases (Additional file 6). Furthermore, such minimal lengths for vertebrates are on average longer than for invertebrates because the former generally have higher G +C genomic contents. Taken another way, the“length threshold” for the natural selection on the trinucleotides to be effective is higher for vertebrates than for inverte-brates. Our results also imply that 5’UTRs of different lengths are subject to different evolutionary forces, with longer 5’UTRs more likely affected by selection, and shorter 5’UTRs by the stochastic process (or genetic drift).
Conclusions
The length evolution of 5’ UTRs is an important topic in the evolution of eukaryotic genomes. It was previously proposed that genetic drift and selection on uAGUs were the major determinants of 5’UTR length. Here we add new perspectives to this topic by demonstrating that (1) vertebrates and invertebrates have subtle differences in genomic features that affect 5’UTR length; (2) genomic features other than uAUGs, particularly uSTOPs, play an important role in the length evolution of 5’UTR; and (3) shorter and longer 5’UTRs are subject to distinct evolu-tionary forces. A more complicated model that takes these observations into consideration is thus required to better explain the length evolution of 5’UTRs.
Additional material
Additional file 1: The variance inflation factors (VIFs) of each
genomic feature in the linear regression models for 5’UTR length
prediction.The variance inflation factors (VIFs) of each genomic
feature in the linear regression models for 5’UTR length prediction.
All of the VIFs are smaller than 10, indicating that the collinearity between the analyzed variables is negligible.
Additional file 2: Evaluation of the effect of uORF presence/absence
on 5’UTR length.Evaluation of the effect of uORF presence/absence
on 5’UTR length. The regression model was: Y = b0+b1*X1+b2*X2
+b3*X3+b4*X4+b5*X5+b6*X6+b7*X7+b8*X8+b9*X9+b10*X10+ε Y:
Log105’UTR length; X1: GC content; X2: AUGO/E; X3: UGAO/E; X4: UAAO/E; X5:
UAGO/E; X6: CpGO/E; X7: UpGO/E; X8: UpUO/E; X9: UpAO/E; X10: uORF
presence (1) / absence (0).
Additional file 3: The relative contributions to variability explained (RCVE) of different genomic features in the analyzed species.The relative contributions to variability explained (RCVE) of different genomic features in the analyzed species. In this figure, the number of G-quadruplexes is included in the multiple regression analysis and analyzed for RCVE. G-quadruplexes actually contribute to only a small
proportion of 5’UTR length variability.
Additional file 4: The Q-Q plot of 5’UTR length distribution for (A)
the datasets analyzed in Table 1; (B) the datasets where 5’UTRs
shorter than 30 Bp were excluded.The Q-Q plot of 5’UTR length
distribution for (A) the datasets analyzed in Table1; (B) the datasets
where 5’UTRs shorter than 30 Bp were excluded. Note that at the
lower left corner in (B), the data points skew seriously from normality as compared with (A).
Additional file 5: The minimal length of a sequence for a specific trinuelceotide to occur at least once in the ten analyzed organisms. The minimal length of a sequence for a specific trinuelceotide to occur at least once in the ten analyzed organisms. The minimal
length was measured as1 / fi
i
∏
(see Methods for more details).Additional file 6: The correlation between G+C content and the minimal length for a specific trinuelceotide to occur at least once. The correlation between G+C content and the minimal length for a
specific trinuelceotide to occur at least once.“R“ stands for the
Pearson’s coefficient of correlation. “P“ is the p-value of the linear
regression model.
Acknowledgements
Feng-Chi Chen was supported by the intramural funding of National Health Research Institutes. We thank Tsung-Kai Chang for statistical assistance. This article has been published as part of BMC Bioinformatics Volume 12 Supplement 9, 2011: Proceedings of the Ninth Annual Research in Computational Molecular Biology (RECOMB) Satellite Workshop on Comparative Genomics. The full contents of the supplement are available online at http://www.biomedcentral.com/1471-2105/12?issue=S9. Author details
1Division of Biostatistics and Bioinformatics, Institute of Population Health
Sciences, National Health Research Institutes, Zhunan, Miaoli County, 350
Taiwan, Republic of China.2Department of Life Science, National Chiao-Tung
University, Hsinchu, 300 Taiwan, Republic of China.3Department of Dentistry,
Chinese Medical University, Taichung, 404 Taiwan, Republic of China.
Authors’ contributions
CHC and FCC conceived the study. CHC, HYL, and CLP analyzed the data. CHC and FCC interpreted the results and drafted the manuscript. All authors have read and agreed on the manuscript.
Competing interests
The authors declare that they have no conflict of interests. Published: 5 October 2011
References
1. Cenik C, Derti A, Mellor JC, Berriz GF, Roth FP: Genome-wide functional
analysis of human 5’ untranslated region introns. Genome Biol 2010,
11(3):R29.
2. Pesole G, Grillo G, Larizza A, Liuni S: The untranslated regions of
eukaryotic mRNAs: structure, function, evolution and bioinformatic tools for their analysis. Brief Bioinform 2000, 1(3):236-249.
3. Osada N, Hirata M, Tanuma R, Kusuda J, Hida M, Suzuki Y, Sugano S,
Gojobori T, Shen CK, Wu CI, Hashimoto K: Substitution rate and
structural divergence of 5’UTR evolution: comparative analysis
between human and cynomolgus monkey cDNAs. Mol Biol Evol 2005, 22(10):1976-1982.
4. Iacono M, Mignone F, Pesole G: uAUG and uORFs in human and rodent
5’untranslated mRNAs. Gene 2005, 349:97-105.
5. Kochetov AV, Ahmad S, Ivanisenko V, Volkova OA, Kolchanov NA, Sarai A:
uORFs, reinitiation and alternative translation start sites in human mRNAs. FEBS Lett 2008, 582(9):1293-1297.
6. Reuter M, Engelstadter J, Fontanillas P, Hurst LD: A test of the null model
for 5’ UTR evolution based on GC content. Mol Biol Evol 2008,
25(5):801-804.
7. Lynch M, Scofield DG, Hong X: The evolution of transcription-initiation
sites. Mol Biol Evol 2005, 22(4):1137-1146.
8. Wilkie GS, Dickson KS, Gray NK: Regulation of mRNA translation by 5’- and
9. Beaudoin JD, Perreault JP: 5’-UTR G-quadruplex structures acting as translational repressors. Nucleic Acids Res 2010, 38(20):7022-7036.
10. Calvo SE, Pagliarini DJ, Mootha VK: Upstream open reading frames cause
widespread reduction of protein expression and are polymorphic among humans. Proc Natl Acad Sci U S A 2009, 106(18):7507-7512.
11. van der Velden AW, Thomas AA: The role of the 5’ untranslated region of
an mRNA in translation regulation during development. Int J Biochem Cell Biol 1999, 31(1):87-106.
12. Razin A: CpG methylation, chromatin structure and gene silencing-a
three-way connection. EMBO J 1998, 17(17):4905-4908.
13. Elango N, Hunt BG, Goodisman MA, Yi SV: DNA methylation is widespread
and associated with differential gene expression in castes of the honeybee, Apis mellifera. Proc Natl Acad Sci U S A 2009, 106(27):11206-11211.
14. Yi SV, Goodisman MA: Computational approaches for understanding the
evolution of DNA methylation in animals. Epigenetics 2009, 4(8):551-556.
15. Duan J, Antezana MA: Mammalian mutation pressure, synonymous
codon choice, and mRNA degradation. J Mol Evol 2003, 57(6):694-701.
16. Han JQ, Wroblewski G, Xu Z, Silverman RH, Barton DJ: Sensitivity of
hepatitis C virus RNA to the antiviral enzyme ribonuclease L is determined by a subset of efficient cleavage sites. J Interferon Cytokine Res 2004, 24(11):664-676.
17. Grillo G, Turi A, Licciulli F, Mignone F, Liuni S, Banfi S, Gennarino VA,
Horner DS, Pavesi G, Picardi E, Pesole G: UTRdb and UTRsite (RELEASE 2010): a collection of sequences and regulatory motifs of the untranslated regions of eukaryotic mRNAs. Nucleic Acids Res 2010, 38(Database issue):D75-80.
18. Kutner MH, Nachtsheim CJ, Neter J, Li Weditors: Applied linear statistical
models. New York: McGraw-Hill; 2005.
19. Kvikstad EM, Tyekucheva S, Chiaromonte F, Makova KD: A macaque’s-eye
view of human insertions and deletions: differences in mechanisms. PLoS Comput Biol 2007, 3(9):1772-1782.
20. Huppert JL, Balasubramanian S: Prevalence of quadruplexes in the human
genome. Nucleic Acids Res 2005, 33(9):2908-2916.
21. Lynch M, Conery JS: The origins of genome complexity. Science 2003,
302(5649):1401-1404.
22. Chen CH, Liao BY, Chen FC: Exploring the selective constraint on the
sizes of insertions and deletions in 5’ untranslated regions in mammals.
BMC Evol Biol 2011, 11(1):192.
23. Carninci P, Sandelin A, Lenhard B, Katayama S, Shimokawa K, Ponjavic J,
Semple CA, Taylor MS, Engstrom PG, Frith MC, Forrest AR, Alkema WB, Tan SL, Plessy C, Kodzius R, Ravasi T, Kasukawa T, Fukuda S, Kanamori-Katayama M, Kitazume Y, Kawaji H, Kai C, Nakamura M, Konno H, Nakano K, Mottagui-Tabar S, Arner P, Chesi A, Gustincich S, Persichetti F, et al: Genome-wide analysis of mammalian promoter architecture and evolution. Nat Genet 2006, 38(6):626-635.
24. Ohler U, Liao GC, Niemann H, Rubin GM: Computational analysis of core
promoters in the Drosophila genome. Genome Biol 2002, 3(12): RESEARCH0087.
doi:10.1186/1471-2105-12-S9-S3
Cite this article as: Chen et al.: The genomic features that affect the lengths of 5’ untranslated regions in multicellular eukaryotes. BMC Bioinformatics 2011 12(Suppl 9):S3.
Submit your next manuscript to BioMed Central and take full advantage of:
• Convenient online submission
• Thorough peer review
• No space constraints or color figure charges
• Immediate publication on acceptance
• Inclusion in PubMed, CAS, Scopus and Google Scholar
• Research which is freely available for redistribution
Submit your manuscript at www.biomedcentral.com/submit