R E S E A R C H A R T I C L E
Open Access
Evaluation of subcortical grey matter abnormalities
in patients with MRI-negative cortical epilepsy
determined through structural and tensor
magnetic resonance imaging
Syu-Jyun Peng
1, Tomor Harnod
2, Jang-Zern Tsai
1, Ming-Dou Ker
3, Jun-Chern Chiou
3, Herming Chiueh
3,
Chung-Yu Wu
3and Yue-Loong Hsin
2,3,4*Abstract
Background: Although many studies have found abnormalities in subcortical grey matter (GM) in patients with temporal lobe epilepsy or generalised epilepsies, few studies have examined subcortical GM in focal neocortical seizures. Using structural and tensor magnetic resonance imaging (MRI), we evaluated subcortical GM from patients with extratemporal lobe epilepsy without visible lesion on MRI. Our aims were to determine whether there are structural abnormalities in these patients and to correlate the extent of any observed structural changes with clinical characteristics of disease in these patients.
Methods: Twenty-four people with epilepsy and 29 age-matched normal subjects were imaged with high-resolution structural and diffusion tensor MR scans. The patients were characterised clinically by normal brain MRI scans and seizures that originated in the neocortex and evolved to secondarily generalised convulsions. We first used whole brain voxel-based morphometry (VBM) to detect density changes in subcortical GM. Volumetric data, values of mean diffusivity (MD) and fractional anisotropy (FA) for seven subcortical GM structures (hippocampus, caudate nucleus, putamen, globus pallidus, nucleus accumbens, thalamus and amygdala) were obtained using a model-based segmentation and registration tool. Differences in the volumes and diffusion parameters between patients and controls and correlations with the early onset and progression of epilepsy were estimated.
Results: Reduced volumes and altered diffusion parameters of subcortical GM were universally observed in patients in the subcortical regions studied. In the patient-control group comparison of VBM, the right putamen, bilateral nucleus accumbens and right caudate nucleus of epileptic patients exhibited a significantly decreased density Segregated volumetry and diffusion assessment of subcortical GM showed apparent atrophy of the left caudate nucleus, left amygdala and right putamen; reduced FA values for the bilateral nucleus accumbens; and elevated MD values for the left thalamus, right hippocampus and right globus pallidus A decreased volume of the nucleus accumbens consistently related to an early onset of disease. The duration of disease contributed to the shrinkage of the left thalamus.
Conclusions: Patients with neocortical seizures and secondary generalisation had smaller volumes and microstructural anomalies in subcortical GM regions. Subcortical GM atrophy is relevant to the early onset and progression of epilepsy.
Keywords: Subcortical grey matter, Neocortical epilepsy, Volumetry, Diffusion tensor imaging
* Correspondence:hsin.yloong@msa.hinet.net 2
Epilepsy Center, Tzu Chi General Hospital, No. 707, Sec. 3, Chung Yang Rd, Hualien City 97002, Taiwan
3
Biomedical Electronics Translational Research Center, National Chiao Tung University, No. 1001, University Rd, Hsinchu City 30010, Taiwan
Full list of author information is available at the end of the article
© 2014 Peng et al.; licensee BioMed Central Ltd. This is an Open Access article distributed under the terms of the Creative Commons Attribution License (http://creativecommons.org/licenses/by/2.0), which permits unrestricted use, distribution, and reproduction in any medium, provided the original work is properly credited. The Creative Commons Public Domain Dedication waiver (http://creativecommons.org/publicdomain/zero/1.0/) applies to the data made available in this article, unless otherwise stated.
Background
Recent studies have demonstrated the importance of cortical-subcortical network interactions in seizure gen-eration and propagation [1,2]. Through several magnetic resonance imaging (MRI) acquisition and processing techniques, investigators explore not only the cortex but also subcortical grey matter (GM) abnormalities in epi-leptic patients. It has been reported that patients with temporal lobe epilepsy (TLE) and idiopathic generalised epilepsy (IGE) have structural alterations in the subcor-tical nuclei and, more generally, in the thalamus [3-16]. Furthermore, the changes in subcortical GM correlate with the age at seizure onset and the duration of epi-lepsy [3,4,10,15,16]. A small number of longitudinal studies have shown that recurrent seizures may lead to progressive microstructural alterations [17,18]. However, few neuroimaging studies have addressed the abnormal-ities in the subcortical GM of patients with neocortical epilepsy. Here, we investigated the subcortical GM of patients with neocortical epilepsy and without any iden-tifiable MRI lesion, compared with age-matched con-trols. Our patients shared a seizure semiology indicating secondary generalisation. First, we demonstrated density changes in subcortical GM using voxel-based morphom-etry (VBM). We then correlated the volume changes and diffusion parameters of seven subcortical regions (the hippocampus, caudate nucleus, putamen, globus pallidus, nucleus accumbens, thalamus and amygdala) with age at seizure onset and disease duration. Our aim was to deter-mine the associations between changes in subcortical GM and disease progression, especially in patients whose sei-zures arise from neocortical structures.
Methods
Subjects
From 2012 May to December, we conducted in this neu-roimaging study. We studied 24 patients (15 females and 9 males, mean age = 25.6 ± 12.9 years) with chronic par-tial epilepsy. All patients had had MRI scans and had long-term EEG records. We first selected epileptic pa-tients with regional epileptiform discharges using a data set on patients at the Buddhist Tzu Chi Epilepsy Center. We termed patients “MRI-negative” if radiologists did not identify any lesions, including neoplasms, traumatic lesions, vascular anomalies, well-defined developmental abnormalities or hippocampal atrophy, in their routine brain MRIs. To completely exclude mesial temporal lobe epilepsy, we did not include patients with maximal ictal/ interictal epileptiform discharges at T3, T4 or sphenoid electrodes. We also determined the location of the seiz-ure focus or foci in individual patients through ictal video-EEG recording. We termed a focus “undeter-mined” if seizure activity arose on the EEG in bilateral frontal regions simultaneously or if there was a diffuse
epileptiform discharge with asymmetric body posturing at seizure onset. All of the enrolled patients had seizure manifestations with the subsequent development of gener-alised convulsions and postictal psychomotor depression. Patient demographic information is shown in Table 1. Twenty-nine age-matched healthy volunteers (14 females and 15 males with a mean age of 27.5 ± 4.2 years) were re-cruited as the control group. The consent in which in-formed the research methodology and for publication of data and images was obtained from each participant and/or his/her parents. The study protocol was approved by the Research Ethics Committee at Buddhist Tzu Chi General Hospital (IRB 101–32 and IRB101-99).
MRI acquisition
All subjects were scanned in a 3T MRI scanner (General Electric, Waukesha, WI, USA). Anatomic T1-weighted images were acquired using a high-resolution, axial, three-dimensional, T1-weighted, fast spoiled gradient recalled
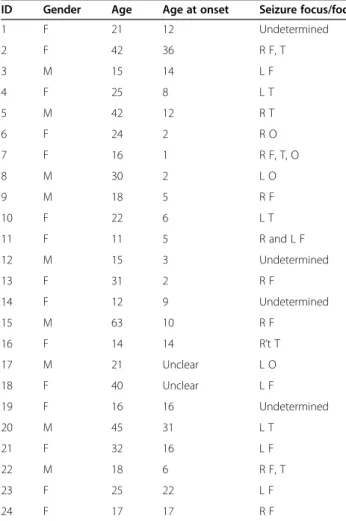
Table 1 Clinical data on 24 patients with focal neocortical epilepsy
ID Gender Age Age at onset Seizure focus/foci
1 F 21 12 Undetermined 2 F 42 36 R F, T 3 M 15 14 L F 4 F 25 8 L T 5 M 42 12 R T 6 F 24 2 R O 7 F 16 1 R F, T, O 8 M 30 2 L O 9 M 18 5 R F 10 F 22 6 L T 11 F 11 5 R and L F 12 M 15 3 Undetermined 13 F 31 2 R F 14 F 12 9 Undetermined 15 M 63 10 R F 16 F 14 14 R’t T 17 M 21 Unclear L O 18 F 40 Unclear L F 19 F 16 16 Undetermined 20 M 45 31 L T 21 F 32 16 L F 22 M 18 6 R F, T 23 F 25 22 L F 24 F 17 17 R F
F = Frontal; T = Temporal; O = Occipital; Y = Yes; N = No; R = Right hemisphere and L = Left hemisphere; Undetermined = seizure activity arising on the EEG in bilateral frontal regions or diffuse epileptiform discharge with asymmetric body posturing at seizure onset.
echo (3D T1-FSPGR) sequence. Congruent slices with a thickness of 1 mm were generated with a repetition time (TR) of 11.812 ms, an echo time (TE) of 5.036 ms, a field of view (FOV) of 22 × 22 cm, a flip angle of 15 degrees and a 512 × 512 matrix. The DTI protocol consisted of a single-shot-spin-echo planar-imaging sequence. Thirty-four con-tiguous slices were acquired with a matrix size of 256 × 256, a voxel size of 1 mm × 1 mm, a slice thickness of 3 mm, a TR of 8,000 ms, a TE of 82.4 ms, a number of excitation of 2 and a FOV of 25 × 25 cm. Diffusion-weighted images were acquired in 25 directions (b = 1000 s/mm2), as was a null image (b = 0 s/mm2).
VBM analysis of whole brain GM
VBM was carried out using the FSL-VBM v1.1 software tool included in the FSL (FMRIB Software Library; the University of Oxford). The VBM analysis procedure comprised the following steps [19]. First, 3D T1-FSPGR images were brain-extracted and GM -segmented before being registered to the Montreal Neurological Institute (MNI) 152 standard space using non-linear registration. The resulting images were averaged and flipped along the x-axis to create a left-right symmetric, study-specific GM template. Second, all native GM images were non-linearly registered to this study-specific GM template and “modulated” to correct for local expansion (or con-traction) due to the non-linear component of the spatial transformation. The modulated GM images were then smoothed with an isotropic Gaussian kernel with a sigma of 3 mm for the TFCE-based analysis [20]. Finally, differences in cerebral GM density between the patient and control groups were evaluated using the voxel-wise generalised linear model applied using permutation-based non-parametric testing (5000 permutations) [21]. We identified the regions with significant differences in GM density between the patient and control groups using these postprocessing methods and a cluster-size threshold ofp < 0.05.
Measurement of volumes and diffusion parameters of subcortical GM structures
The algorithm FIRST (FMRIB’s Integrated Registration and Segmentation Tool) was applied to separately evalu-ate the left and right volumes of seven subcortical re-gions: hippocampus, caudate nucleus, putamen, globus pallidus, nucleus accumbens, thalamus and amygdala [22,23]. During registration, the 3D T1-FSPGR images were transformed to the MNI 152 standard space using affine transformations with 12 degrees of freedom. A subcortical mask was applied to locate the different sub-cortical structures, followed by segmentation based on shape models and voxel intensities after subcortical registration. Finally, a boundary correction was used to determine which boundary voxels belong to a given
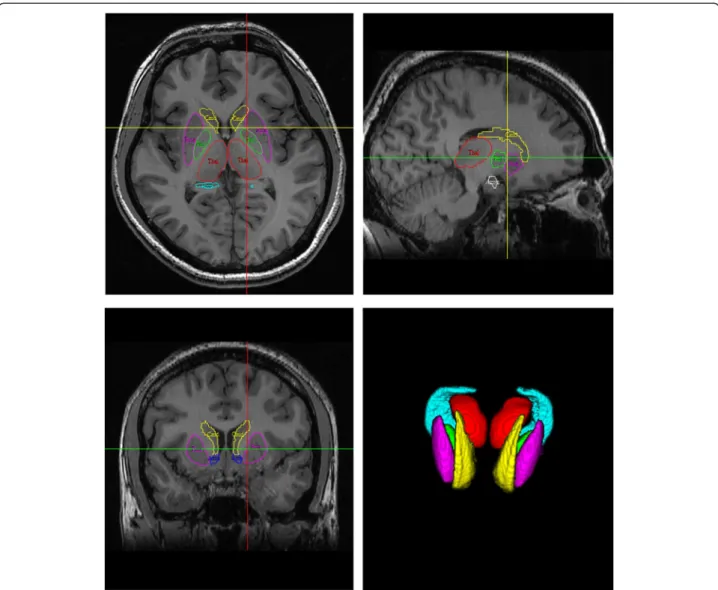
structure. In this study, a Z-value of 3 was used, corre-sponding to a structure. After the registration and seg-mentation of all MRI images, all segmented subcortical regions were visually checked for errors in registration and segmentation (Figure 1). The acquired volume of each subcortical structure was normalised to the whole brain volume without cerebrospinal fluid to obtain a volume-ratio value.
All diffusion-weighted images were corrected for eddy current distortion and head motion using the FDT v2.0 software package (FMRIB's Diffusion Toolbox). The pre-processed DTI data were fit to a diffusion tensor model to generate the mean diffusivity (MD) and fractional an-isotropy (FA) maps. To obtain transformation parame-ters, the individual T1-FSPGR image was registered to the null image to fit the DTI resolution using a 12-parameter rigid body transformation. We applied these parameters to transform the segmentation mask to the DTI space using a rigid registration and a nearest neigh-bour interpolation based on the normalised mutual in-formation method. For each subject, the corresponding values of the MD and FA were calculated for each auto-matically segmented region.
Statistical analysis
Using the independent-samples t-test, the normalised volume, FA and MD values in the patient group were compared with those in the control group for the seven subcortical structures studied. To investigate the underlying relation between the significantly altered diffusion parameters or volume of subcortical struc-tures and duration of epilepsy or age at epilepsy onset, linear regression analysis was performed. A significant difference was accepted if the p value was less than 0.05.
Results
We enrolled 24 patients with neocortical epilepsy and with-out gross cerebral abnormalities. In this study group, more patients had seizures originating in anterior regions of the brain. The proportion of patients with frontal lobe seizures was equal between the right hemispheric epilepsy and left hemispheric epilepsy subgroups.
VBM analysis
Three clusters exhibited significant decreases in GM density in the whole brain VBM comparison. Within these clusters, the right putamen, the bilateral nucleus accumbens and the right caudate nucleus were involved (Table 2, Figure 2). In addition, an increase in GM dens-ity was also observed over the bilateral paracentral gyri in the patient group (Additional file 1: Figure S1).
Figure 1 FIRST segmentation. Example showing the seven subcortical regions studied (hippocampus, caudate nucleus, putamen, globus pallidus, nucleus accumbens, thalamus and amygdala) in axial, sagittal, coronal and 3D views (hippocampus = cyan; caudate nucleus = yellow; putamen = magenta; globus pallidus = green; nucleus accumbens = blue; thalamus = red; amygdala = white).
Table 2 Local maximums of significant clusters showing decreased cerebral GM density in neocortical epilepsy patients, compared to controls (p < 0.05)
Cluster index
Anatomy Voxels Z-MAX Z-MAX MNI (mm)
X Y Z
1 33% Left Cerebral White Matter 157 0.99 −6 16 −6
23% Left Nucleus accumbens 13% Left Cerebral Cortex
2 87% Right Putamen 111 0.966 24 10 −8
12% Right Cerebral White Matter
3 58% Right Nucleus accumbens 23 0.954 6 12 −4
19% Right Cerebral White Matter 9% Right Caudate nucleus 8% Right Cerebral Cortex 4% Right Lateral Ventricle
Volume difference
The total brain volume was not a confounding factor for the true brain volume (excluding the volume of cerebro-spinal fluid), and the true brain volumes of our patients were not different from those of the controls (t = 2.009, p = 0.615). In general, the studied subcortical structures showed different degrees of volume reduction. The vol-umes of the left caudate nucleus (2.848 ± 0.469 vs. 3.143 ± 0.506, t = 0.430, p = 0.034), left amygdala (0.749 ± 0.176 vs. 0.868 ± 0.214, t = −0.661, p = 0.033) and right putamen (4.002 ± 0.334 vs. 4.297 ± 0.548, t = 1.836, p = 0.025) were reduced significantly in the patients compared with the controls (Table 3).
Diffusion parameter difference
In general, the MD values for the subcortical structures studied were higher in our patients. The MD value was increased in the left thalamus (0.894 ± 0.050 vs. 0.863 ±
0.059, t = −2.188, p = 0.045), right globus pallidus (0.979 ± 0.046 vs. 0.771 ± 0.041, t = −0.777, p = 0.035) and right hippocampus (1.101 ± 0.102 vs. 1.042 ± 0.053, t = −1.801, p = 0.009). The differences in the FA values were minimal and inconsistent. The FA values were reduced in the bilat-eral nucleus accumbens in the patients, compared with the controls (left nucleus accumbens, 0.265 ± 0.055 vs. 0.295 ± 0.049, t = −1.991, p = 0.038; right nucleus accumbens, 0.240 ± 0.047 vs. 0.285 ± 0.053,t = −1.555, p = 0.002).
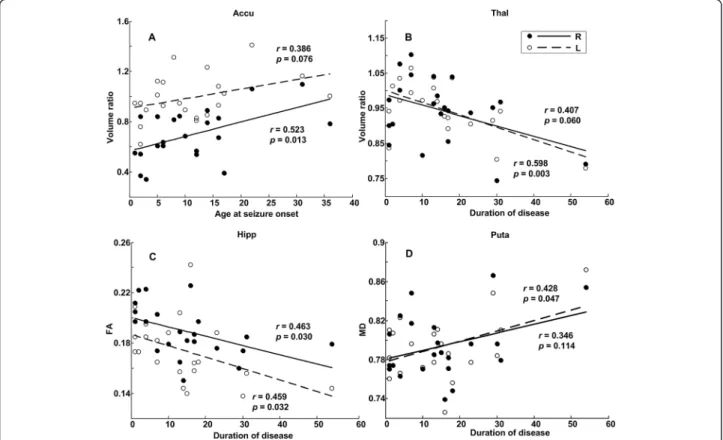
Correlations with age at seizure onset and disease duration
The age at seizure onset positively correlated with the volume ratio of the bilateral nucleus accumbens (regres-sion for right nucleus accumbens: r = 0.523, p = 0.013; regression for left nucleus accumbens: r = 0.386, p = 0.076) (Figure 3A). The disease duration significantly negatively correlated with the volume ratio of the left thalamus (r = 0.598, p = 0.003) (Figure 3B), the mean FA
Figure 2 VBM analysis. VBM results showing GM volume loss in the bilateral nucleus accumbens, right putamen and right caudate nucleus in neocortical epilepsy patients, compared with controls.
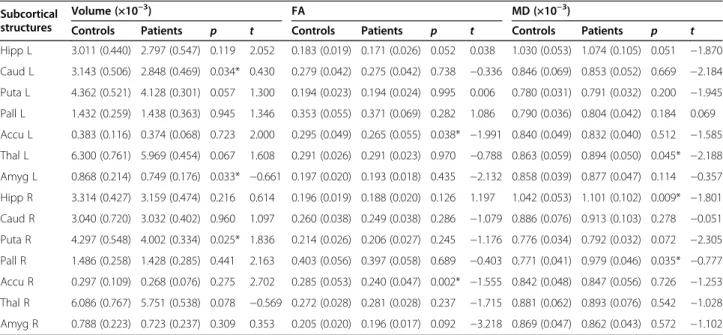
Table 3 Normalised subcortical structure volumes and FA and MD values in focal neocortical epilepsy patients
Subcortical structures
Volume (×10−3) FA MD (×10−3)
Controls Patients p t Controls Patients p t Controls Patients p t
Hipp L 3.011 (0.440) 2.797 (0.547) 0.119 2.052 0.183 (0.019) 0.171 (0.026) 0.052 0.038 1.030 (0.053) 1.074 (0.105) 0.051 −1.870 Caud L 3.143 (0.506) 2.848 (0.469) 0.034* 0.430 0.279 (0.042) 0.275 (0.042) 0.738 −0.336 0.846 (0.069) 0.853 (0.052) 0.669 −2.184 Puta L 4.362 (0.521) 4.128 (0.301) 0.057 1.300 0.194 (0.023) 0.194 (0.024) 0.995 0.006 0.780 (0.031) 0.791 (0.032) 0.200 −1.945 Pall L 1.432 (0.259) 1.438 (0.363) 0.945 1.346 0.353 (0.055) 0.371 (0.069) 0.282 1.086 0.790 (0.036) 0.804 (0.042) 0.184 0.069 Accu L 0.383 (0.116) 0.374 (0.068) 0.723 2.000 0.295 (0.049) 0.265 (0.055) 0.038* −1.991 0.840 (0.049) 0.832 (0.040) 0.512 −1.585 Thal L 6.300 (0.761) 5.969 (0.454) 0.067 1.608 0.291 (0.026) 0.291 (0.023) 0.970 −0.788 0.863 (0.059) 0.894 (0.050) 0.045* −2.188 Amyg L 0.868 (0.214) 0.749 (0.176) 0.033* −0.661 0.197 (0.020) 0.193 (0.018) 0.435 −2.132 0.858 (0.039) 0.877 (0.047) 0.114 −0.357 Hipp R 3.314 (0.427) 3.159 (0.474) 0.216 0.614 0.196 (0.019) 0.188 (0.020) 0.126 1.197 1.042 (0.053) 1.101 (0.102) 0.009* −1.801 Caud R 3.040 (0.720) 3.032 (0.402) 0.960 1.097 0.260 (0.038) 0.249 (0.038) 0.286 −1.079 0.886 (0.076) 0.913 (0.103) 0.278 −0.051 Puta R 4.297 (0.548) 4.002 (0.334) 0.025* 1.836 0.214 (0.026) 0.206 (0.027) 0.245 −1.176 0.776 (0.034) 0.792 (0.032) 0.072 −2.305 Pall R 1.486 (0.258) 1.428 (0.285) 0.441 2.163 0.403 (0.056) 0.397 (0.058) 0.689 −0.403 0.771 (0.041) 0.979 (0.046) 0.035* −0.777 Accu R 0.297 (0.109) 0.268 (0.076) 0.275 2.702 0.285 (0.053) 0.240 (0.047) 0.002* −1.555 0.842 (0.048) 0.847 (0.056) 0.726 −1.253 Thal R 6.086 (0.767) 5.751 (0.538) 0.078 −0.569 0.272 (0.028) 0.281 (0.028) 0.237 −1.715 0.881 (0.062) 0.893 (0.076) 0.542 −1.028 Amyg R 0.788 (0.223) 0.723 (0.237) 0.309 0.353 0.205 (0.020) 0.196 (0.017) 0.092 −3.218 0.869 (0.047) 0.862 (0.043) 0.572 −1.102 Hipp = hippocampus; Caud = caudate nucleus; Puta = putamen; Pall = globus pallidus; Accu = nucleus accumbens; Thal = thalamus; Amyg = amygdala; R = right hemisphere; L = left hemisphere; *denotes a significant difference xp < 0.05) with respect to controls.
of the bilateral hippocampus (left: r = 0.459, p = 0.032; right:r = 0.463, p = 0.030) (Figure 3C) and the mean FA of the left putamen (r = 0.435, p = 0.043). The clinical-MD correlations with epilepsy duration showed a posi-tive trend, but only that for the left putamen reached statistical significance (r = 0.428, p = 0.047) (Figure 3D). The Additional file 2: Table S1 shows the linear regression relations among normalised volume, the DTI parameters of the subcortical structures and either age at seizure onset or disease duration. The diffusion parameters did not show significant correlations with age at seizure onset.
Discussion
Generalised tonic-clonic seizures occur in primary gen-eralised epilepsy and can arise as a secondary generalisa-tion of partial seizures. Over 70% of patients with focal seizures experience secondary generalisation [24].
Many studies emphasise the importance of the thalamus in generalised seizures. It has also been demonstrated that the basal ganglia contribute to seizure regulation and ictal dystonia [25,26]. In this study, we have observed that focal cortical seizures with secondarily generalised tonic-clonic convulsions are associated with variable changes in the
subcortical GM of individual patients. Subcortical GM atrophy was related to the early onset and progression of epilepsy. Involvement of the nucleus accumbens in secondary seizure generalisation has not been reported previously in humans.
DeCarli first discussed volume asymmetry in the extra-temporal structures of patients with complex partial seizures of left temporal origin. In addition to changes in the hippocampus, they also observed the significantly reduced volumes of the left thalamus, left caudate nu-cleus and bilateral lenticular nuclei [27]. Consequently, the amygdala [15], putamen [10,12-14,16], caudate nu-cleus [11,14-16], globus pallidus [11] and hippocampus [11,13-15] were also found to show atrophy in patients with temporal lobe epilepsy with or without MRI-visible hippocampal lesions. Thereafter, patients with IGEs, including absence epilepsy, juvenile myoclonic epilepsy (JME) and primary generalised tonic-clonic seizures, were also found to have subcortical abnor-malities [3-10]. Here, we further demonstrated that the reduction in volume of subcortical GM in patients with frontal, lateral temporal or occipital lobe seizures is univer-sal. Recently, several studies have addressed differences in
Figure 3 Clinical correlations of onset age and disease duration. (A) Linear regressions of the volume ratio of the nucleus accumbens on the age at seizure onset. (B) Linear regressions of the volume ratio of the thalamus on disease duration. (C) Linear regressions of the FA values of the hippocampus on disease duration. (D) Linear regressions of the MD values of the putamen on disease duration. Accu = nucleus accumbens; MD = mean diffusivity; FA = fractional anisotropy; Hipp = hippocampus; Puta = putamen; Thal = thalamus. Volume ratio = the ratio of the individual normalised volume ratio to the mean normalised volume ratio of controls.
the shapes of subcortical structures between patients with generalised epilepsies and normal controls using FSL-FIRST, a vertex-based shape analysis method. Du et al. found significant regional atrophy in the left thalamus, left putamen and bilateral globus pallidus in patients with GTCs [5]. Kim identified regional bilateral atrophy on the anterior-medial and posterior-dorsal aspects of the thal-amus in 50 adult patients with IGE [28]. In patients with JME, Saini observed focal surface area reductions in the medial and lateral aspects of the bilateral thalami [3].
For tensor imaging supporting the evaluation of white matter rather than GM, we calculated diffusion parame-ters for original subcortical GM structures individually instead of by whole brain voxel-based analysis to guard against the possibility of causing partial volume aver-aging effects via smoothing. Although we did not antici-pate a demonstration of the delicate microstructural changes of subcortical GM by DTI, we nonetheless ob-served a general alteration of diffusion parameters. Fur-thermore, the decrease in FA values in the bilateral nucleus accumbens has not yet been reported. Groppa reported increases in the regional FA in the thalamus in patients with IGE [9]. Luo and Yang found increased MD values in the bilateral thalami, putamen and left caudate nucleus and increased FA values in the bilateral caudate nuclei in patients with absence epilepsy [4,8]. Keller reported the first evidence of combined micro-structural and macromicro-structural putamen abnormalities in patients with JME and identified an early age at onset and a longer duration of epilepsy as predictors for greater architectural alterations [10]. In patients with TLE and abnormal hippocampal MRI scans, Kimiwada showed an increasing trend in the MD values for the thalami ipsilateral to the epileptic focus, and Keller showed changes in the mean FA values of the bilateral thalamus and putamen [12,29]. In Keller’s study, the duration of epilepsy was significantly negatively corre-lated with the mean FA of both the ipsilateral thalamus and the contralateral thalamus [12].
Saini found a correlation between age at onset and the volume of the right hippocampus in 40 patients with JME [3]. While the ipsilateral-to-contralateral volume ra-tios of subcortical structures were estimated using data from 40 patients with TLE, thalamic volume loss was found to correlate with epilepsy onset [15]. In two early studies by Dreifuss and Gärtner, the relations between age at onset or epilepsy duration and volume changes in the thalamus or striatum in patients with temporal lobe epilepsy and extratemporal lobe epilepsy were not sig-nificant. However, these two studies included patients with neoplasms or cortical dysplasia, which reflect differ-ent temporal lobe epileptogenic processes [16,30]. Luo found significant correlations between diffusion parame-ters for the caudate nucleus and age at onset in patients
with absence seizures [4]. In our patients, the age at seizure onset positively correlated with the volume of the right nu-cleus accumbens, and the reduction in volume observed with disease progression was consistent across the subcor-tical structures studied, especially the left thalamus.
In 2010, Hermann et al. characterised neurodevelopmen-tal changes in brain structure in children with negative MRI scans and new-onset generalised and localisation-related epilepsies (including extratemporal lobe epilepsy). In their prospective study, they observed reductions in the volume of cerebral GM and a delayed age-appropriate in-crease in white matter volume over 2 years [17]. In 2011, they further concluded that the baseline grey and white matter volumes differed in the controls, suggesting that anomalies in brain development were antecedent to the on-set of seizures and that the neurodevelopmental changes that they observed involved several subcortical structures [18]. The results of our cross-sectional study, demonstrat-ing a correlation between structural abnormalities and age at seizure onset or disease duration, are consistent with the results of their prospective study.
With regard to the postictal state, functional brain im-aging has been used in a limited number of studies. Fong et al. conducted a single-photon emission computed tom-ography (SPECT) study of 2 patients with right TLE in whom postictal psychosis developed; these authors re-ported a marked hyperperfusion of the left basal ganglia [31]. Blumenfeld and his colleague also used SPECT to observe the involvement of the caudate nucleus during seizure generalisation and in the postictal period [32]. The nucleus accumbens, a region of the brain in the basal fore-brain, plays a central role in the reward circuit and the in pathogenesis of psychiatric disorders [33,34]. Studying the involvement of the nucleus accumbens in epilepsy models focuses on postictal behaviors [35,36]. Ma et al. found that theμ opioid receptors of nucleus accumbens mediate im-mediate postictal decrease in locomotion after an amyg-daloid kindled seizure in rats [37]. Using the pilocarpine model, Scholl et al. observed neuronal degeneration in the outside hippocampal regions including the nucleus accombens and the accumbens shell. These findings sup-port our findings indirectly and encourage future research the association of nucleus accumbens with epilepsy.
Conclusions
Subcortical GM involvement in the pathogenesis of chronic neocortical epilepsy is supported by our DTI-derived and T1-weighted MRI-derived evidence. However, a longi-tudinal study is needed to determine whether neurode-generation observed in subcortical regions in neocortical epilepsy patients is accelerated beyond the effects of nor-mal aging. Comorbid interictal and postictal psychomotor symptoms also require further investigation in light of coexisting subcortical structural changes.
Additional files
Additional file 1: Figure S1. FSL-VBM results comparing neocortical epilepsy patients with controls indicate a bilateral elevation in GM volume over the paracentral gyri in subjects with neocortical epilepsy. Additional file 2: Table S1. Results of the linear regression analysis of normalised volume, DTI parameters of the subcortical structures and either age at seizure onset or disease duration.
Abbreviations
MD:Mean diffusivity; DTI: Diffusion tensor imaging; FA: Fractional anisotropy; FDT: FMRIBs diffusion toolbox; FIRST: FMRIB’s integrated registration and segmentation tool; FOV: Field of view; FSL: FMRIB software library; GM: Grey matter; IGE: Idiopathic generalised epilepsies; JME: Juvenile myoclonic epilepsy; MNI: Montreal neurological institute; MRI: Magnetic resonance imaging; SPECT: Single-photon emission computed tomography; TE: Echo time; TLE: Temporal lobe epilepsy; TR: Repetition time; VBM: Voxel-based morphometry; 3D T1-FSPGR: Three-dimensional, T1-weighted, fast spoiled gradient recalled echo.
Competing interests
The authors declare that they have no competing interests. Authors’ contributions
SJP: draft of manuscript, including description of study, results and analysis. TH: clinical evaluation and study concept. JZT: revision of manuscript for content. MDK, JCC, HC and CYW: interpretation of data and obtaining funding. YLH: study design and supervision. All authors read and approved the final manuscript.
Acknowledgements
This work was supported in part by National Science Council (NSC), R.O.C., under project 102-2220-E-009-001 and in part by“Aim for the Top University Plan” of the National Chiao Tung University and Ministry of Education, Taiwan, R.O.C. and by National Science Council (NSC), R.O.C., under project 100-2220-E-303-001 and by Buddhist Tzu Chi Research Grant (TCRD100-53-1). Author details
1Department of Electrical Engineering, National Central University, No. 300,
Jhongda Rd, Jhongli City 32001, Taoyuan County, Taiwan.2Epilepsy Center,
Tzu Chi General Hospital, No. 707, Sec. 3, Chung Yang Rd, Hualien City 97002, Taiwan.3Biomedical Electronics Translational Research Center,
National Chiao Tung University, No. 1001, University Rd, Hsinchu City 30010, Taiwan.4Department of Neurology, Chung Shan Medical University and
Chung Shan Medical University Hospital, No. 110, Sec. 1, Jianguo N. Rd, South Dist, Taichung City 40201, Taiwan.
Received: 31 December 2013 Accepted: 15 April 2014 Published: 14 May 2014
References
1. Bertram EH: Neuronal circuits in epilepsy: do they matter? Exp Neurol 2013, 244:67–74.
2. Berman R, Negishi M, Vestal M, Spann M, Chung MH, Bai X, Purcaro M, Motelow JE, Danielson N, Dix-Cooper L, Enev M, Novotny EJ, Constable RT, Blumenfeld H: Simultaneous EEG, fMRI, and behavior in typical childhood absence seizures. Epilepsia 2010, 51:2011–2022.
3. Saini J, Sinha S, Bagepally BS, Ramchandraiah CT, Thennarasu K, Prasad C, Taly AB, Satishchandra P: Subcortical structural abnormalities in juvenile myoclonic epilepsy (JME): MR volumetry and vertex based analysis. Seizure 2013, 22:230–235.
4. Luo C, Xia Y, Li Q, Xue K, Lai Y, Gong Q, Zhou D, Yao D: Diffusion and volumetry abnormalities in subcortical nuclei of patients with absence seizures. Epilepsia 2011, 52:1092–1099.
5. Du H, Zhang Y, Xie B, Wu N, Wu G, Wang J, Jiang T, Feng H: Regional atrophy of the basal ganglia and thalamus in idiopathic generalized epilepsy. J Magn Reson Imaging 2011, 33:817–821.
6. Kim JH, Lee JK, Koh SB, Lee SA, Lee JM, Kim SI, Kang JK: Regional grey matter abnormalities in juvenile myoclonic epilepsy: a voxel-based morphometry study. Neuroimage 2007, 37:1132–1137.
7. Chan CH, Briellmann RS, Pell GS, Scheffer IE, Abbott DF, Jackson GD: Thalamic atrophy in childhood absence epilepsy. Epilepsia 2006, 47:399–405. 8. Yang T, Guo Z, Luo C, Li Q, Yan B, Liu L, Gong Q, Yao D, Zhou D: White
matter impairment in the basal ganglia-thalamocortical circuit of drug-naive childhood absence epilepsy. Epilepsy Res 2012, 99:267–273. 9. Groppa S, Moeller F, Siebner H, Wolff S, Riedel C, Deuschl G, Stephani U, Siniatchkin M: White matter microstructural changes of thalamocortical networks in photosensitivity and idiopathic generalized epilepsy. Epilepsia 2012, 53:668–676.
10. Keller SS, Ahrens T, Mohammadi S, Moddel G, Kugel H, Ringelstein EB, Deppe M: Microstructural and volumetric abnormalities of the putamen in juvenile myoclonic epilepsy. Epilepsia 2011, 52:1715–1724.
11. Dabbs K, Becker T, Jones J, Rutecki P, Seidenberg M, Hermann B: Brain structure and aging in chronic temporal lobe epilepsy. Epilepsia 2012, 53:1033–1043.
12. Keller SS, Schoene-Bake JC, Gerdes JS, Weber B, Deppe M: Concomitant fractional anisotropy and volumetric abnormalities in temporal lobe epilepsy: cross-sectional evidence for progressive neurologic injury. PLoS One 2012, 7:e46791.
13. McDonald CR, Hagler DJ Jr, Ahmadi ME, Tecoma E, Iragui V, Dale AM, Halgren E: Subcortical and cerebellar atrophy in mesial temporal lobe epilepsy revealed by automatic segmentation. Epilepsy Res 2008, 79:130–138.
14. Pulsipher DT, Seidenberg M, Morton JJ, Geary E, Parrish J, Hermann B: MRI volume loss of subcortical structures in unilateral temporal lobe epilepsy. Epilepsy Behav 2007, 11:442–449.
15. Szabo CA, Lancaster JL, Lee S, Xiong JH, Cook C, Mayes BN, Fox PT: MR imaging volumetry of subcortical structures and cerebellar hemispheres in temporal lobe epilepsy. AJNR Am J Neuroradiol 2006, 27:2155–2160.
16. Dreifuss S, Vingerhoets FJ, Lazeyras F, Andino SG, Spinelli L, Delavelle J, Seeck M: Volumetric measurements of subcortical nuclei in patients with temporal lobe epilepsy. Neurology 2001, 57:1636–1641.
17. Hermann BP, Dabbs K, Becker T, Jones JE, Myers Y, Gutierrez A, Wendt G, Koehn MA, Sheth R, Seidenberg M: Brain development in children with new onset epilepsy: a prospective controlled cohort investigation. Epilepsia 2010, 51:2038–2046.
18. Tosun D, Dabbs K, Caplan R, Siddarth P, Toga A, Seidenberg M, Hermann B: Deformation-based morphometry of prospective neurodevelopmental changes in new onset paediatric epilepsy. Brain 2011, 134:1003–1014. 19. Good CD, Johnsrude IS, Ashburner J, Henson RN, Friston KJ, Frackowiak RS:
A voxel-based morphometric study of ageing in 465 normal adult hu-man brains. Neuroimage 2001, 14:21–36.
20. Smith SM, Nichols TE: Threshold-free cluster enhancement: addressing problems of smoothing, threshold dependence and localisation in cluster inference. Neuroimage 2009, 44:83–98.
21. Nichols TE, Holmes AP: Nonparametric permutation tests for functional neuroimaging: a primer with examples. Hum Brain Mapp 2002, 15:1–25. 22. Patenaude B: Bayesian statistical models of shape and appearance for
subcortical brain segmentation. University of oxford; 2007.
23. Patenaude B, Smith SM, Kennedy DN, Jenkinson M: A Bayesian model of shape and appearance for subcortical brain segmentation. Neuroimage 2011, 56:907–922.
24. Forsgren L, Bucht G, Eriksson S, Bergmark L: Incidence and clinical characterization of unprovoked seizures in adults: a prospective population-based study. Epilepsia 1996, 37:224–229.
25. Norden AD, Blumenfeld H: The role of subcortical structures in human epilepsy. Epilepsy Behav 2002, 3:219–231.
26. Gale K: Subcortical structures and pathways involved in convulsive seizure generation. J Clin Neurophysiol 1992, 9:264–277.
27. DeCarli C, Hatta J, Fazilat S, Fazilat S, Gaillard WD, Theodore WH: Extratemporal atrophy in patients with complex partial seizures of left temporal origin. Ann Neurol 1998, 43:41–45.
28. Kim JH, Kim JB, Seo WK, Suh SI, Koh SB: Volumetric and shape analysis of thalamus in idiopathic generalized epilepsy. J Neurol 2013, 260:1846–1854.
29. Kimiwada T, Juhasz C, Makki M, Muzik O, Chugani DC, Asano E, Chugani HT: Hippocampal and thalamic diffusion abnormalities in children with temporal lobe epilepsy. Epilepsia 2006, 47:167–175.
30. Gärtner B, Seeck M, Michel CM, Delavelle J, Lazeyras F: Patients with extratemporal lobe epilepsy do not differ from healthy subjects with
respect to subcortical volumes. J Neurol Neurosurg Psychiatry 2004, 75:588–592.
31. Fong GC, Fong KY, Mak W, Tsang KL, Chan KH, Cheung RT, Ho SL: Postictal psychosis related regional cerebral hyperfusion. J Neurol Neurosurg Psychiatry 2000, 68:100–101.
32. Blumenfeld H, Varghese GI, Purcaro MJ, Motelow JE, Enev M, McNally KA, Levin AR, Hirsch LJ, Tikofsky R, Zubal IG, Paige AL, Spencer SS: Cortical and subcortical networks in human secondarily generalized tonic-clonic seizures. Brain 2009, 132:999–1012.
33. Baxter MG, Murray EA: The amygdala and reward. Nat Rev Neurosci 2002, 3:563–573.
34. Disner SG, Beevers CG, Haigh EA, Beck AT: Neural mechanisms of the cognitive model of depression. Nat Rev Neurosci 2011, 12:467–477. 35. Ma J, Brudzynski SM, Leung LW: Involvement of the nucleus
accumbens-ventral pallidal pathway in postictal behavior induced by a hippocampal afterdischarge in rats. Brain Res 1996, 739:26–35. 36. Ma J, Boyce R, Leung LS: Nucleus accumbens mu opioid receptors
mediate immediate postictal decrease in locomotion after an amygdaloid kindled seizure in rats. Epilepsy Behav 2010, 17:165–171. 37. Scholl EA, Dudek FE, Ekstrand JJ: Neuronal degeneration is observed in
multiple regions outside the hippocampus after lithium pilocarpine-induced status epilepticus in the immature rat. Neuroscience 2013, 252:45–59.
doi:10.1186/1471-2377-14-104
Cite this article as: Peng et al.: Evaluation of subcortical grey matter abnormalities in patients with MRI-negative cortical epilepsy determined through structural and tensor magnetic resonance imaging. BMC Neurology 2014 14:104.
Submit your next manuscript to BioMed Central and take full advantage of:
• Convenient online submission
• Thorough peer review
• No space constraints or color figure charges
• Immediate publication on acceptance
• Inclusion in PubMed, CAS, Scopus and Google Scholar
• Research which is freely available for redistribution
Submit your manuscript at www.biomedcentral.com/submit