國 立 交 通 大 學
電信工程學系
碩 士 論 文
乙太被動光纖網路下改善服務品質的動態
頻寬分配
QoS-Promoted Dynamic Bandwidth
Allocation (Q-DBA) for Ethernet Passive
Optical Networks
研 究 生:黃琴雅
乙太被動光纖網路下改善服務品質
的動態頻寬分配
研究生︰黃琴雅
指導教授︰張仲儒教授
國立交通大學電信工程學系碩士班
中文摘要
乙太被動光纖網路(EPON)被認為是下一代網路的明日之星,因為它能夠支援網 路上日益增加的流量以及滿足人們對於網路各種寬頻服務的需求。這是因為它整合了既 有的光纖基礎建設以及目前已發展成熟並且成本低廉的乙太設備。除此之外,另一個讓 乙太被動光纖網路備受注目的原因是它的大頻寬解決了寬頻服務所帶來對頻寬需求激 增的問題。在現今的多媒體網路傳輸環境下,傳輸服務品質(Quality of Service)就變 的是很重要的議題。 在本篇論文中,我們提出了一個能適用於乙太被動光纖網路上改善服務品質的動態 頻寬分配方法,我們針對及時性的服務(例如語音服務、視訊服務等)設計了以延遲以及 封包被丟掉為考量的頻寬分配機制;另外,也針對非及時性的服務(例如一般資料服務) 而設計了以避免它過度被犧牲作考量的排程機制。這是因為非即時性的服務時常會因為 重要性比較低,在傳輸上往往會被犧牲而造成過大的延遲。我們為了減少這樣被過度犧 牲的情況,在滿足即時性的服務下,改善非即時性服務的延遲情況。模擬的結果顯示我 們所提出動態分配頻寬的方法確實能夠讓語音封包以及視訊服務的平均延遲和封包丟 掉機率限制在一個可接受的範圍之內,並同時對於資料服務提供了對封包延遲與封包阻 隔機率的支援。QoS-Promoted Dynamic Bandwidth
Allocation (Q-DBA) for Ethernet Passive
Optical Networks
Student: Chin-Ya Huang
Advisor: Dr. Chung-Ju Chang
Institute of Communication Engineering
National Chiao Tung University
Abstract
To support the increasing traffic load and the growing demands of broadband multiple services in the network, Ethernet passive optical networks (EPONs) are the candidate of the next-generation access networks. The convergence of cost Ethernet equipment, low-cost fiber infrastructure, and the large bandwidth of the optical fiber link make the EPONs suitable for providing broadband services. Presently, in the multimedia environment, quality-of-service (QoS) becomes an import issue.
In this thesis, we propose a QoS-promoted dynamic bandwidth allocation (Q-DBA) method to support transmitting delay-constrained voice and video packets, and starvation-considered data packets. The goal of the Q-DBA method is to meet the delay criterion of voice service under the voice dropping probability is set to zero, the delay criterion and dropping probability of video probability, and to simultaneously maintain the delay of data packets. The data packets should not endure a long delay time although they do not have strict delay criterion. When the QoS requirement of real-time service can be satisfied, the performance of non-real-time service should be improved. Simulation results show that the proposed method can almost meet our goal. If combining call admission control (CAC), our
致 謝
兩年的光陰在不知不覺中這樣結束,心裡的感覺是很複雜的,既湧著無限的感動, 又這麼失落著關於離別這件事。這兩年的碩士生活雖然是一路跌跌撞撞,但是在這過程 裡卻獲得了許多。從對研究全然的無知,到今天,可以完成這麼一本碩士論文。整個過 程,給了我很大的勇氣去面對接下來的所有挑戰。很高興可以走這麼一段,夾雜著豐富 的喜怒哀樂,還有各種人生的歷練。 碩士論文能順利的完成,我必須要感謝許許多多人。首先由衷的感謝張仲儒教授的 指導以及教誨,不僅僅只是在專業上的砥礪,還有做人處世上的薰陶。再來要感謝立峰 學長總是在百忙之中犧牲自己的時間給我很多寶貴的建議還有幫助,不管是觀念上面的 釐清修正,還是程式上面的問題;芳慶學長在工研院來回奔波,每每給予我精準且又扼 要的建議,即使身在國外,也是心繫著我們幾個蘿蔔頭的論文情況;家慶、義昇、詠翰、 文祥學長也總是在我面對困難的時候,大方的慷慨解囊,提供很多珍貴的經驗以及建 議。另外還要感謝志明、凱元、朕逢、立忠以及宗軒學長在我剛進實驗室時親切的給予 提攜與照顧,讓我能很快的適應研究生的生活。謝謝給我很多歡樂還有打氣的佳璇、建 興、世宏、建安、正昕以及尚樺,感謝你們讓我紓解許多壓力並與我分享生活點滴。當 然,一定要感謝與我朝夕相處、一同走過這兩年的煖玉、家源還有俊帆。謝謝你們與我 這樣一路扶持,一起討論問題,一起打球,一起煩惱,一起創造屬於我們難以忘懷的回 憶。 最後,我要感謝父母及親友們對我的關懷與照顧,讓我沒有任何煩惱的往前追逐著 我的夢想。你們的的支持給我很大的鼓舞,沒有這份根植於心中的親情力量,我想我無 法如此堅定以及踏實的走著。我願將這碩士論文獻給所有幫助過我、愛護我的人,希望 你們與我一起分享這得來不易的成果及心中的喜悅。 黃琴雅 謹誌 民國九十五年Contents
Mandarin Abstract i English Abstract ii Acknowledgements iii Contents iv List of Figures vi 1 Introduction 1 1.1 Motivation . . . 1 1.2 Paper Survey . . . 4 1.3 Thesis Organization . . . 7 2 The EPON Systems 8 2.1 System Architecture . . . 8 2.2 Source Model . . . 11 3 QoS-Promoted Dynamic Bandwidth Allocation (Q-DBA) Method 13 3.1 Report Message . . . 13 3.2 Q-DBA Scheme . . . 164 Simulation Results and Discussions 22 4.1 Simulation Environment . . . 22 4.1.1 Fairness Index . . . 24 4.2 Simulation Results . . . 25 5 ONU Assisted Q-DBA Method 37 5.1 Introduction . . . 37 5.2 Simulation Results and Discussions . . . 39 5 Conclusions and Future Works 51
List of Figures
1.1 An EPON network . . . 2
1.2 Downstream transmissions in an EPON . . . 3
1.3 Upstream transmissions in an EPON . . . 3
2.1 The system architecture of EPON . . . 9
2.2 Formats of Gate Message and Report Message . . . 10
2.3 Function Block Diagram of Upstream Transmission . . . 10
2.4 ON/OFF source model . . . 12
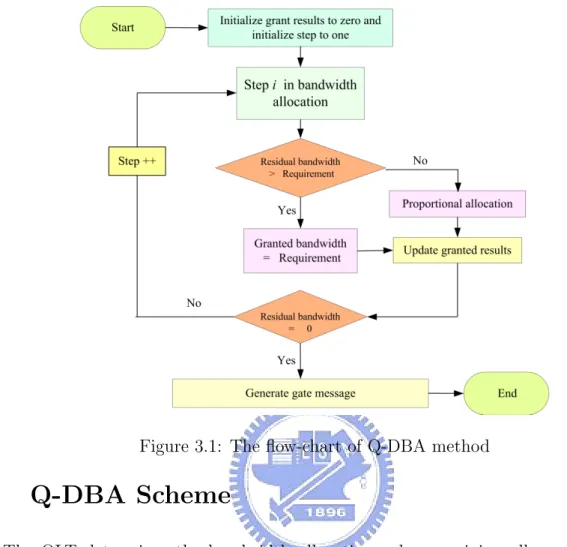
3.1 The flow-chart of Q-DBA method . . . 16
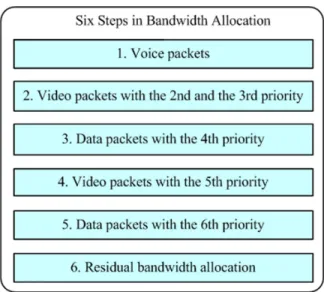
3.2 The six steps in bandwidth allocation of Q-DBA method . . . 17
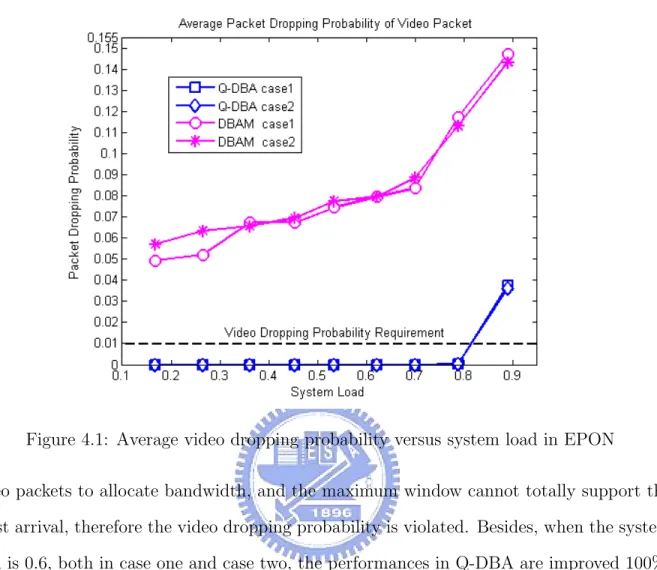
4.1 Average video dropping probability versus system load in EPON . . . 27
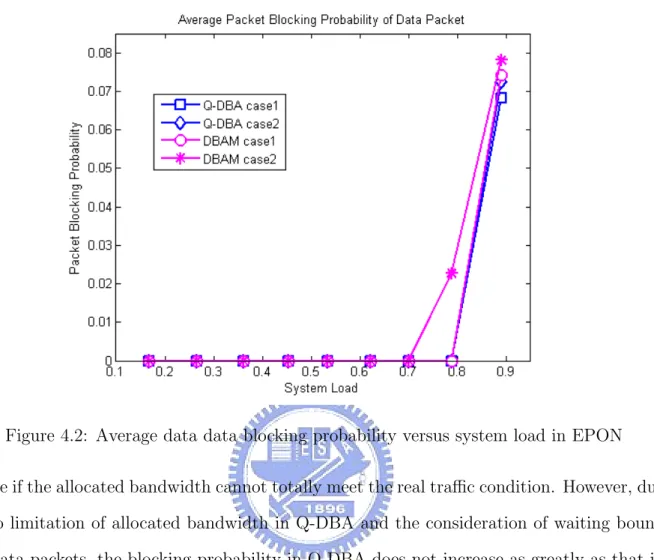
4.2 Average data data blocking probability versus system load in EPON . . . 28
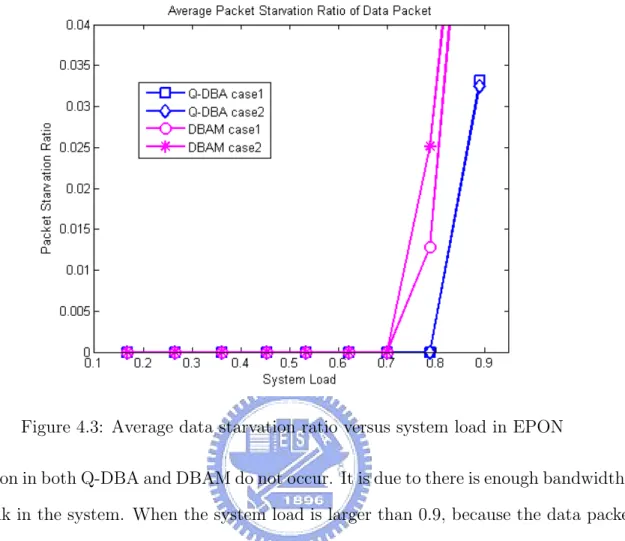
4.3 Average data starvation ratio versus system load in EPON . . . 29
4.4 Average voice delay time versus system load in EPON . . . 30
4.5 Average video delay time versus system load in EPON . . . 31
4.6 Average data delay time versus system load in EPON . . . 33
4.7 Fairness index of average data delay versus system load in EPON . . . 34
4.8 Overall fairness index of data packets versus system load in EPON . . . 34
5.1 Average data delay time versus system load in EPON . . . 40
5.2 Average data delay time versus system load in EPON . . . 41
5.3 Average video dropping probability versus system load in EPON . . . 42
5.4 Average data data blocking probability versus system load in EPON . . . 43
5.5 Average data starvation ratio versus system load in EPON . . . 44
5.6 Average voice delay time versus system load in EPON . . . 45
5.7 Average voice delay time versus system load in EPON . . . 45
5.8 Average video delay time versus system load in EPON . . . 46
5.9 Average video delay time versus system load in EPON . . . 47
5.10 Fairness index of average data delay versus system load in EPON . . . 48
5.11 Overall fairness index of data packets versus system load in EPON . . . 49
Chapter 1
Introduction
1.1
Motivation
A high-speed broadband access network is required to support multimedia services, such as high-definition television (HDTV), video on demand (VoD), Internet telephone, and so on. Ethernet passive optical networks (EPONs) have emerged as one of the most promising access network, and are the candidate of the next-generation access networks because of their high-bandwidth and low-cost. An EPON is a PON that carries the packets encapsulated in Ethernet frames and is backward compatible with existing IEEE 802.3 Ethernet standards. Ethernet is a cheap technology that is ubiquitous with a variety of legacy equipments. Optical provides higher bandwidth, longer operating distance, and lower maintenance cost than other technologies. These architectures combine the latest advances in optical and electronic, and are poised to become the dominant means of delivering gigabit broadband connectivity to homes over a unified single platform.
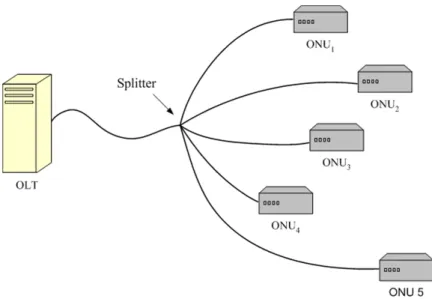
Figure 1.1 shows a tree-topology EPON network [1]. There are one optical line terminal (OLT) and several optical network units (ONUs) in an EPON. The OLT resides in the central office (CO) and connects the optical access network to the backbone. The ONU is usually located at the curb or the end-user location to provide an integrated broadband
Figure 1.1: An EPON network
service to the traffic which are the combination of voice, video, and data packets. The famous implementation of EPON is fiber-to-the-home (FTTH). Other similar implementations are fiber-to-the-building (FTTB) and fiber-to-the-curb (FTTC). EPON is a point-to-multipoint optical network with no active elements in the transmission path from the source to the destination. The components in an EPON are the optical fiber and a splitter which are passive optical components.
The EPONs provide different wavelengths to individually transmit upstream and down-stream Ethernet packets. Figure 1.3 shows the downdown-stream transmissions. It is point-to-multipoint in the downstream transmission. The OLT broadcasts Ethernet packets to all ONUs by a passive splitter. The ONU checks the medium access control (MAC) address of all incoming packets, and takes the packets with the destination of itself. Because OLT dominantly controls downstream packets to all ONUs, and the packets in downstream are broadcasted to all ONUs, the downstream transmission does not need in advance to negotiate with all ONUs to avoid packets’ collision.
trans-Figure 1.2: Downstream transmissions in an EPON
mission. Due to the directional property of the splitter, one ONU can only reach the OLT, not other OUNs, and does not know any information about others. If all ONUs trans-mit their packets whenever packets arrive into their queues, the collision between different ONUs’ packets might happen. Because in the upstream transmission, all ONUs share the resource of fiber link, in order to avoid packets being corrupted for more than one ONUs transmit packets at the same time, a bandwidth allocation algorithm is required to allocate a non overlapping transmission timeslot to each ONU. At present, the most popular way of supporting upstream traffic is that OLT unifies the management of upstream transmission. According to [2], packets in an ONU are transmitted to the OLT by time division multiple access (TDMA) owing to the lowest cost and the easiest implementation.
Two messages, ”gate message” and ”report message”, are used to convey information be-tween OLT and each ONU according to IEEE standard [2]. The OLT sends a gate message to each ONU (according to its last report message) at the beginning of every scheduling time. In turn, every ONU sends its packets based on the gate message, and sends report message to report its queue occupancy to the OLT at the end of its assigned transmission time. Ob-viously, because there is a upper bound of a wavelength’s bandwidth, the shared bandwidth for serving upstream traffic is limited. The OLT should suitably allocate bandwidth to all ONUs to ensure a satisfied performance. In order to efficiently use the limited bandwidth and support different requirements, people do a lot of efforts in finding good methods on the bandwidth allocation for the upstream transmission.
1.2
Paper Survey
With the TDMA approach, the timeslot may be fixed or variable for transmitting one or more packets depending on the OLT’s allocation algorithm. Although a fixed timeslot
assignment algorithm in EPONs [3] was easy to implement, it did not meet ONUs’ dynamic requirements, and resulted the bandwidth under utilization. Because of the different queue occupancies of all ONUs every cycle and the bursty nature of network traffic, the granted bandwidth may be either insufficient for a longer queue occupancy or too much for a shorter queue occupancy. To overcome this problem, a polling based scheme ”Interleaving Polling with Adaptive Cycle time” (IPACT) [4] was proposed. In [4], the next ONU was polled before receiving packets from previous one. The OLT dynamically assigned bandwidth to all ONUs in accordance with ONUs’ demands, and the bandwidth was cable of being used more efficiently. However, quality of service (QoS) requirements, such as delay and dropping probability, were not considered yet. If all packets played the same status, they were served according to the principle of ”first come, first serve (FCFS)”, and all packets will attain the same average delay time no matter what they were delay sensitive or not. In this way, the algorithm was not suitable for delay and jitter sensitive services.
As EPONs’ technology matures, related QoS issues are becoming a key concern. The scheduling algorithms, relying on ”Dynamic Bandwidth Allocation” (DBA) algorithms [5, 6, 7, 8, 9, 10] were proposed to support a variety of network services. The authors in [5] proposed a DBA-high priority (DBA-HP) scheme, which focused on the high priority service, and the DBA-HP minimized delay time and delay variation of high priority service. It satisfied the QoS of the high priority packets, but sacrificed the packet delay, packet drop probability, and throughput of the low priority packets. The combination of intra-ONU and inter-ONU scheduling [6] and two layer bandwidth allocation (TLBA) [7] resolved the unfairness for the low priority packets by designing a maximum cycle time to each traffic class. However, it produced an increasing delay time of high priority service and an decreasing of throughput. It is because the available bandwidth cannot meet all demands resulted by the burst or the heavy traffic load. Burst-polling based delta dynamic bandwidth allocation
[8] and dynamic bandwidth allocation with multiple services (DBAM) algorithm [9] used a class-based traffic prediction to estimate queue’s traffic arriving for enhancing QoS metrics such as average delay, but the introduced maximum window parameter of a specific class of traffic decreased the performance because the ONU did not ask and obtain bandwidth more than the maximum window even if bandwidth was left. Traffic-class burst-polling based delta DBA (TCBP-DDBA) [10] proposed a traffic class based message polling scheme based on the spirit of [8]. It not only reallocated surplus bandwidth to the heavily loaded ONUs to improve the under utilized problems in [9] but also provided a QoS guarantee to delay sensitive services. However, it did not individually allocate bandwidth to each class, and resulted the longest delay to non-delay sensitive services if the traffic load was heavy and the ONU did not arrange the transmission well.
To find another solution to make high bandwidth utilization after the QoS is satisfied, some people proposed ”threshold-based” mechanisms referring to queue occupancy or num-ber of packets in the ONU [11, 12, 13]. A DBA algorithm with threshold reporting [11], was proposed to consider the tradeoff between the bandwidth efficiency and the delay charac-teristics. The bandwidth might be fully utilized while the packet delay and delay variation increased. In [12], the authors proposed a mechanism which took a completed packet and the threshold into account, and the mechanism achieved a nearly optimal bandwidth utilization. However, because the report message was not large enough to contain all informations about packets’ size, the improvement was still limited. Dynamic credit distributed (D-CRED) based mechanism [13] used a dynamic queue threshold technique to achieve higher band-width efficiency for the weighted fair allocation. It proposed a dynamic queue management for transmission to reach a higher efficiency, but the delay variation would increase with the increasing of traffic load, especially of the low priority traffic.
1.3
Thesis Organization
In this paper, we propose a QoS-promoted dynamic bandwidth allocation (Q-DBA) method to ensure the QoS of different traffic types as much as possible. The OLT allocates bandwidth to all ONUs to support bandwidth allocation, and it also uses up all resources to fulfill ONUs’ request. Q-DBA provides a QoS enhancement to ONUs, and packets can be transmitted in accordance with their priority, from a higher priority to a lower one in order. If CAC (Call Admission Control) mechanism is included when EPON works, the QoS can be guaranteed in advance, especially when the traffic load is larger than 0.8. It does not just meet the conditions of different service types. It additionally considers the packets, whose QoS requirements will be broken. Real-time service is delay sensitive, and the priority will raise if the packets will violate the QoS requirements at the end of next cycle. Similarly, non-real-time service will raise its priority status if the delay bound is violated while data packets do not expect to have such a longer delay time that the service will be in the starvation condition. The proposed mechanism has different treatments to packets’ transmission. It not only try to satisfy QoS in real-time service but also improve the QoS of non-real-time packets.
The structure of the paper is organized as follows. Chapter II describes the system architecture. In chapter III, we introduce the bandwidth allocation method. We then discuss the simulation results in chapter IV. In chapter V, the Q-DBA is modified with ONU assisted, and the simulation results are also in this section. Finally, the concluding remarks are given in chapter VI.
Chapter 2
The EPON Systems
2.1
System Architecture
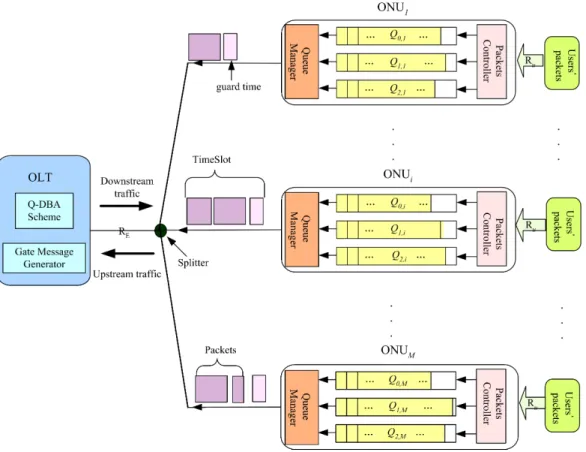
An EPON architecture is shown in Fig. 2.1. It is a point-to-multipoint configuration following ”MultiPoint Control Protocol, (MPCP)”. There are an OLT with line rate Ru(bps)
between OLT and each ONU, and M ONUs with line rate RE(bps) between an ONU and
its own end users. Two wavelengths are used to serve downstream and upstream traffic individually. A splitter is placed between OLT and all ONUs to broadcast packets from OLT to all ONUs, and then, the OUN takes its own packets. All ONUs transmit packets by time division multiple access (TDMA) during a cycle time. The OUN transmits packets bytes by bytes until the end of its timeslot because packets in this system are transmitted bytes by bytes. The guard time is used to distinguish packets from different ONUs. The total bandwidth in upstream traffic, which is used to transmit packets in OLT, is shared by all ONUs’ real-time and non-real-time packets. A Q-DBA scheme in OLT processes ONUs’ demands, and determines the timeslot as well as the volume of bandwidth for ONUs to transmit packets.
In ONUi, 1 ≤ i ≤ M , three classes of queues, Q0,i, Q1,i, and Q2,i , are provided to store
Figure 2.2: Formats of Gate Message and Report Message
|Q1,i|, and |Q2,i| to be the queue size of Q0,i, Q1,i, and Q2,i, respectively. Once packets arrive
at the ONU, the packets controller puts them into the queue depending on their types, and it will drop some type of packets if the queue is full. Besides, the packets controller will drop real-time packets as well if their delay criteria is violated. The queue manager takes charge of the transmission between OLT and the ONUs. It transmits packets to the OLT at its granted timeslot, and receives its packets from OLT. In addition, the queue manager also takes charge of generating the report message.
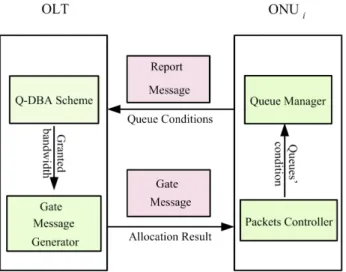
Two messages, report message and gate message, are exchanged between OLT and ONUs. The formats of report message and gate message are depicted in Fig. 2.2. The report message can transmit eight different queue conditions of ONUi, 1 ≤ i ≤ M, to OLT, and the gate
message can provide four different granted results to the ONUi, 1 ≤ i ≤ M . As shown in
Fig. 2.3, the queue manager in ONUi, 1 ≤ i ≤ M, generates the report message based on the
queues’ conditions of ONUi. The queue conditions are required for bandwidth allocation and
presented in the form of the total amount of packets’ size in bytes. The OLT receives report messages from all ONUs, and the proposed QoS-promoted dynamic bandwidth allocation (Q-DBA) scheme in OLT processes these report messages. The Q-DBA scheme, according report message and bandwidth allocation mechanism, determines the bandwidth allocation, and then, the gate message generator issues gate messages to all ONUs. When ONUs receive gate messages, they transmit packets bytes by bytes at their assigned timeslot.
2.2
Source Model
Three kinds of packets: real-time voice, real-time video, and non-real-time data, are considered. Voice packets are classified as the highest priority, and data packets are the lowest.
Figure 2.4: ON/OFF source model
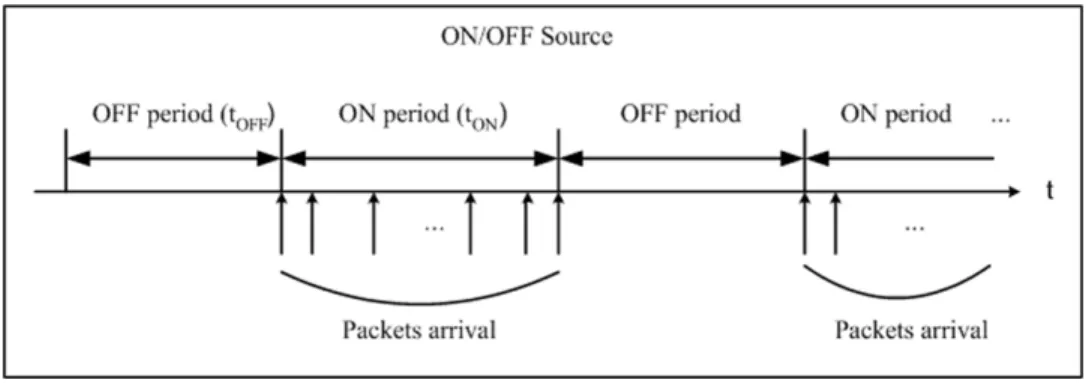
The two-level MMDP (Markov modulated deterministic process) is generally used to formulate ON-OFF voice traffic stream shown in Fig. 2.4. To emulate a T1 connection, the
generation rate of a voice packet is constant bit rate (CBR). The packet size is 24 bytes in T1. By adding the overhead such Ethernet, UDP (User Data Protocol) and IP (Internet
Protocol) headers in a packet, the packet results in a 70-byte frame. Video and data traffic is to emulate variable bit rate (VBR) that exhibit properties of self-similarity and long-rang-dependence (LRD) [14, 15, 16, 17]. The packet size of each packet arrival is in uniform distribution and ranges from 64 to 1518 bytes. Rv(bps) is the arrival rate of video packets
Chapter 3
QoS-Promoted Dynamic Bandwidth
Allocation (Q-DBA) Method
In order to support the function of bandwidth allocation, the allocation procedure needs the help of all ONUs. The Q-DBA method combine the report messages of all ONUs and the Q-DBA scheme in OLT. ONUs report the necessary informations in the report message to the OLT. And then, the OLT uses these informations to allocate bandwidth based on the Q-DBA scheme.
3.1
Report Message
The proposed QoS-promoted dynamic bandwidth allocation (Q-DBA) method assumes that ONUi, 1 ≤ i ≤ M , sends the report message including six kinds of informations of
queues, L0,i, L1,i, L2,i, Ldp,i, Ld,i, and Lw,i. The L0,i, L1,i, and L2,i denote the occupancy of
queues Q0,i, Q1,i, and Q2,i respectively. The Ldp,i denotes the total amount of video packets
in bytes, which will be dropped at the end of next cycle if they are not transmitted at next cycle because their delay time will violate the video delay requirement, Td∗. The Ld,i
denotes the amount of video packets in bytes, which should be transmitted at next timeslot in order to sustain the dropping probability requirement of video packets, Pd∗. Video service is delay sensitive, and video packets are dropped when their delay requirement is violated.
Video packets will be dropped if their delay requirement is violated, and a high dropping probability is not allowed in a QoS-aware network. The Lw,i denotes the amount of data
packets in bytes, which is with a waiting time larger than a waiting bound, Tw∗. Since non-real-time data packets do not have strict delay requirement, they should be protected from being in the starvation condition, which easily occurs if people always firstly consider the delay time of real-time packets. Like random early dropped (RED), the waiting bound Tw∗ starts a mechanism to keep data packets from reaching the delay bound, which indicates the starvation condition. Ldp,i and Ld,i , and Lw,i are used to improve QoS, just like pi [18] and
δ [19] are used according to the conception of ”earliest deadline first” (EDF).
Denote Tcycle to be the cycle time of EPONs and Td,n to be the delay time of the nth
packet. For video packets in Q1,i, 1 ≤ i ≤ M, at the present time, the n = 1 means the
oldest or the first packet in Q1,i, and the packet will be transmitted firstly because the service
principle is in FCFS manner. Denote x to be the xth packet with the least delay time, which will violate the delay requirement at the end of next cycle. Any video packet queued before this xth packet will be dropped at the end of next cycle. The x can be calculated as follows.
x = arg min
n {Td,n+ Tcycle, ∀n, and Td,n+ Tcycle> T ∗
d}. (3.1)
Then the Ldp,i can be obtained by
Ldp,i= x
X
n=1
Sn,1, (3.2)
where Sn,1 is the number of bytes of the nth packet’s size in Q1,i, 1 ≤ i ≤ M .
Denote Pd,ito be the dropping probability of video packets at Q1,imeasured by ONUi, 1 ≤
i ≤ M . A moving time window of observation is introduced to calculate the dropping probability. It contains the latest N output video packets of ONUi, which have been dropped,
Nd video packets, among the N video packets, which have been dropped so far, and there
are x video packets which are waiting in the queue, Q1,i and will be dropped if they are not
transmitted at next timeslot. The x is given in (3.1). Then, a number of packets among these x packets, denoted it by y, must be transmitted otherwise the requirement of video packet dropping probability Pd∗ will be violated. The y can be obtained by
y = (Nd+ x − dN × Pd∗e)
+, (3.3)
where (a)+ = a if a ≥ 0, (a)+ = 0 if a < 0; and dbe denotes the smallest integer greater than
b. Then, the Ld,i can be derived by
Ld,i = y
X
n=1
Sn,1, (3.4)
where Sn,1 means the number of bytes of the nth packet’s size in Q1,i, 1 ≤ i ≤ M .
The Lw,i is used to tell OLT how much bandwidth is required for data packets in Q2,i to
prevent starvation. Denote Tw,n to be the waiting time of the nth data packet in Q2,i, 1 ≤
i ≤ M . Then a number of packets with a waiting time larger than the waiting bound, Tw∗, had better be served. Denote the number of packets to be k, and the k is given by
k = arg min
n {Tw,n− T ∗
w, ∀n, and Tw,n− Tw∗ > 0}. (3.5)
Then, the Lw,i can be obtained by
Lw,i = k
X
n=1
Sn,2, (3.6)
Figure 3.1: The flow-chart of Q-DBA method
3.2
Q-DBA Scheme
The OLT determines the bandwidth allocation, when receiving all report messages. Denote B to be the total bandwidth of each ONU. The allocated bandwidths are individually sent to each ONU by the ”gate message,” which includes G0,i, G1,i, and G2,i. These G0,i, G1,i,
and G2,i denote the granted bandwidth in bytes for Q0,i, Q1,i, and Q2,i of ONUi, 1 ≤ i ≤ M,
respectively. The gate message tells ONUi, the amount of bandwidth in bytes ONUi can
transmit. As soon as ONUs receive their own gate message, they know their own time slot, and prepare to transmit the packets.
The Q-DBA method allocates bandwidth in unit of bytes to all ONUs from the service of the highest priority to that of the lowest one successively until all the bandwidths are used up. As shown in Fig. 3.1, and Fig. 3.2, the bandwidth is allocated sequentially based on the priority of packets and the reported informations if the residual bandwidth is available
Figure 3.2: The six steps in bandwidth allocation of Q-DBA method
in the allocation step. In the Q-DBA method, in order to satisfy QoS requirements, packets of all services are classified into six priorities, and these priorities are considered when the Q-DBA method allocates bandwidth. The six priorities are voice packets, video packets with problem of dropping probability, video packets with problem of delay requirement, data packets considering waiting bound, video packets, and data packets from the highest to the lowest in order. The L0,i, Ldp,i, Ld,i, Lw,i, L1,i, and L2,i in report message represent the
information of the service of the first six priorities in order. The voice service plays the highest priority of service because it is strictly delay sensitive. To enhance QoS requirements of video packets, the Q-DBA method secondly allocates the bandwidth to the video packets which will be dropped if they are not transmitted at next timeslot. Then, the Q-DBA method continues to allocate the bandwidth to the data packets, whose waiting times exceed the waiting bound. Data packets do not be dropped even if they wait in the queue for a long time, but the starvation of data packets may occur. The starvation means that the packets are still not transmitted after a long delay. To avoid the starvation, the priority of data packets should be raised when their waiting bound is violated. In this way, if data packets’
priority than before. In the Q-DBA method, this kind of packets has a higher priority than video packets with a non-violating delay time because video packets, which will be dropped, have already been processed, and the QoS requirements of residual video packets is satisfied. Therefore, the Q-DBA method allocates the bandwidth to the data packets, violating the waiting bound to ensure data service’s QoS requirements to avoid starvation. Then, the Q-DBA method allocates the bandwidth to the unallocated video and data packets in order. Finally, the voice and video packets proportionally share the residual bandwidth based on their queue occupancy to use up the bandwidth and guarantee QoS in further because they have delay requirement.
The Q-DBA method is described in detail as follows: Step 1: [Bandwidth Allocation to Voice]
Denote the allocated bandwidth to voice packets in Q0,i by G
0
0,i. Based on the queue
occupancy of Q0,i, L0,i, and the total bandwidth of the fiber link, B. The allocated bandwidth
to voice, G00,i, is given by
G00,i = L0,i, if M X i=1 L0,i ≤ B, B × ML0,i X i=1 L0,i , elsewhere. (3.7)
Step 2: [Bandwidth Allocation to Video Packets with the second and the third priorities] Denote the allocated bandwidth to video packets with the second and the third priorities in Q1,i by G
0
1,i. Based on the amount of video packets with problem of delay requirement,
Ldp,i, the amount of video packets with problem of dropping probability requirement, Lp,i,
and the residual bandwidth of the fiber link, B −
M
X
i=1
G00,i. The allocated bandwidth to video packets with the second and the third priorities, G01,i, is given by
G01,i= Ldp,i, if B − M X i=1 G00,i≥ M X i=1 Ldp,i, Ld,i+ (B − M X i=1 [G00,i+ Ld,i])+× Ldp,i− Ld,i M X i=1 (Ldp,i− Ld,i) , if M X i=1 Ld,i< B − M X i=1 G00,i< M X i=1 Ldp,i, (B − M X i=1 G00,i)+× Ld,i M X i=1 Ld,i , if B − M X i=1 G00,i≤ M X i=1 Ld,i. (3.8)
Step 3: [Bandwidth Allocation to Data Packets with the fourth priority]
Denote the allocated bandwidth to data packets with the fourth priority in Q2,i by G
0
2,i.
Based on the amount of data packets considering waiting bound, Lw,i, and the residual
bandwidth of the fiber link, B −
M
X
i=1
[G00,i+ G01,i]. The allocated bandwidth to data packets considering waiting bound, G02,i, is given by
G02,i = Lw,i, if B − M X i=1 [G00,i+ G01,i] > M X i=1 Lw,i, (B − M X i=1
[G00,i+ G01,i])+× MLw,i
X
i=1
Lw,i
, elsewhere.
(3.9)
Step 4: [Bandwidth Allocation to video packets with the fifth priority]
Denote the allocated bandwidth to video packets with the fifth priority in Q1,i by G
00
1,i.
Based on the amount of unallocated video packets, L1,i− Ldp,i, and the residual bandwidth
of the fiber link, B −
M
X
i=1
[G00,i+ G01,i + G02,i]. The allocated bandwidth to unallocated video packets, G001,i, is given by
G001,i = L1,i− G 0 1,i, if B − M X i=1
[G00,i+ G01,i+ G02,i] >
M X i=1 L1,i− G 0 1,i, (B − M X i=1
[G00,i+ G01,i+ G02,i])+× L1,i− G
0 1,i M X i=1 (L1,i− G 0 1,i) , elsewhere. (3.10)
Step 5: [Bandwidth Allocation to Data Packets with the sixth priority]
Denote the allocated bandwidth to data packets with the sixth priority in Q1,i by G
00
1,i.
Based on the amount of unallocated data packets, L2,i− Lw,i, and the residual bandwidth
of the fiber link, B −
M
X
i=1
[G00,i+ G01,i + G02,i+ G001,i]. The allocated bandwidth to unallocated data packets, G002,i, is given by
G002,i = L2,i− G 0 2,i, if B − M X i=1
(G00,i+ G01,i+ G02,i+ G001,i) >
M X i=1 (L2,i− G 0 2,i), (B − M X i=1
[G00,i+ G01,i+ G001,i+ G02,i])+× L2,i− G
0 2,i M X i=1 (L2,i− G 0 2,i) , elsewhere. (3.11)
Step 6: [Residual Bandwidth Allocation]
Denote the allocated bandwidth to voice packets in Q1,i and video packets in Q2,i by G
00
0,i
and G0001,i, respectively. Based on the queue occupancy of Q0,i, L0,i, the queue occupancy of
Q1,i, L1,i, and the residual bandwidth of the fiber link, B − M
X
i=1
[G00,i+ G01,i+ G02,i+ G001,i+ G002,i]. The allocated bandwidth to voice packets, G000,i, and video packets G0001,i are given by
G000,i = (B − M X i=1
[G00,i+ G01,i+ G001,i+ G02,i+ G002,i])+× M L0,i
X i=1 (L0,i+ L1,i) , G0001,i = (B − M X i=1
[G00,i+ G01,i+ G001,i+ G02,i+ G002,i])+× L1,i
M X i=1 (L0,i+ L1,i) . (3.12)
Step 7: [Gate Message Generation]
Denote G0,i, G1,i, and G2,i, to be the final granted bandwidth of ONUi, 1 ≤ i ≤ M, in
the gate message to Q0,i, Q1,i, and Q2,irespectively. Based on the allocated bandwidth, G
0
0,i,
G01,i, G02,i, G001,i, G2,i00 , G000,i, and G0001,i the granted bandwidths in gate message,G0,i, G1,i, and
G2,i are given by
G0,i = G 0 0,i+ G 00 0,i, G1,i = G 0 1,i+ G 00 1,i+ G 000 1,i, G2,i = G 0 2,i+ G 00 2,i. (3.13) These G0,i, G1,i, and G2,i are included in gate message, and the OLT sends the gate
message to ONUi. ONUi follows the information in the gate message to transmit its own
packets, and sends the new report message to the OLT at the end of timeslot.
When ONUs receive their gate message,they transmit packets combining OLT’s grants and queue conditions at that time. If there is some bandwidth left at some queues, the left bandwidth are used to transmit packets in other queues in the same ONU from the highest priority packets to the lowest ones. It not only decreases delay and dropping probability but also uses bandwidth more efficiently.
Chapter 4
Simulation Results and Discussions
4.1
Simulation Environment
In this section, an event-driven packet-based simulation is developed the performance of the proposed Q-DBA and the DBAM [9] presented in the previous chapter. We consider a PON architecture with 32 OUNs connected in a tree topology. The distance between the OLT and the splitter is 20km and between each ONU and the splitter is 5km. The line rate between OLT and each is considered to be 1 Gbps, the line rate of user-to-ONU link is 100 Mbps, and the cycle time is set to 0.72 ms. Each ONU supports three priority queues, with the same buffering space of size 1 Mbytes. The guard time separating two consecutive transmission windows is set to 1 µs.
Three kinds of traffic are considered in the system: voice, video, and data. The voice traffic is transmitted with the highest priority, and is generated by a two-level MMDP. To emulate T1 connection, in a ONU, there are 24 channels in a T1 link. The ONU aggregates
the traffic of each channel. During ON state, the generate rate is decided by the number of channels which are at ON state. The mean durations of talk spurts and silence periods are assumed to be exponentially distributed with 1/α = 1 sec. and 1/β = 1.35 sec., respectively. The packet size is fixed to 70 bytes, and the generation rate is constant bit rate (CBR),
during ON state (talk spurts), but none during OFF state (silence). On the other hand, the video and data packets are modeled by ON/OFF Parato-distributed model in order to generate self-similar traffic. An extensive study shows that most network traffic (i.e., http, ftp, variable rate (VBR) video applications, etc.) can be characterized by self-similarity and long-range dependence (LRD) [14, 15, 16, 17]. This model is used to generate highly bursty video and data packets, and packet sizes are uniformly distributed between 64 and 1518 bytes.
The choice of voice delay criteria is based on the specification. International Telecom-munication Standardization Sector (ITU-T) Recommendation G.114 ”One-way transmission time” specifies 1.5 ms one way propagation delay in access network (digital local exchange). The choice of video delay criteria is based on the ITU-TS [20]. The ITU-TS has defined 40 ms as the one-way transmit delay bound. Since the transmission between OLT and ONUs is part of the network, the delay requirement is 10ms. The choice of video dropping probability requirement and delay bound of data packets are defined 1% and 500 ms respectively. For the performance parameters, the most important one is the average packet delay, which is especially essential for the applications that have stringent real-time requirements. Another important performance metric is the dropping probability to real-time packets, and starva-tion ratio to data packets. The dropping probability is important to real-time packets to have a high communication quality, and the starvation ratio is used to judge the condition that data packets endure a long delay time. The starvation ratio is defined as the propor-tion of the number of data packets with a delay time exceeding the delay bound among the transmitted data packets. Besides, fairness index is also considered for data packets. The fairness index can show if the data packets suffer a long delay, large blocking probability or not because the burst of real-time traffic. Finally, the bandwidth utilization in the network cannot be forgotten.
4.1.1
Fairness Index
The fairness index is used to see the fairness of average delay, blocking probability, and dropping probability within all ONUs. If the burst deeply influence the transmission of data packets, and the allocation algorithm cannot suitably support these data packets, the average data delay and blocking probability of different ONUs are quite different, and it is called unfairness. The data packets in any ONU are not smoothly transmitted because of their lowest priority and the limited bandwidth, and thus the unfairness happens. If the fairness index equals to 1, it means the most fairness because all ONUs have almost the same simulation results of data packets; if the fairness index equals to 0, it means unfairness because the difference among all ONUs are too large. In [21], the overall fairness index, F1
for video packets and the overall fairness index, F2 for data packets are defined as follows:
Fc = w1 × IT ,c+ w2× ID,c+ w3× IB,c, c ∈ 0, 1, 2, and w1+ w2+ w3 = 1, (4.1)
where c is the service class, 0 for voice service, 1 for video service, and 2 for data service. w1,
w2, and w3 are weighting factors ranged form 0 to 1; IT ,c is the fairness index for class c’s
delay; ID,c is the fairness index for class c’s dropping probability; IB,c is the fairness index
for class c’s blocking probability. The IT ,c, ID,c, and IB,c are defined below [21]
IT ,c = ( M X i=1 Tc,i)2 M × M X i=1 (Tc,i)2 , c ∈ 0, 1, 2, (4.2)
ID,c = ( M X i=1 Dc,i)2 M × M X i=1 (Dc,i)2 , c ∈ 0, 1, 2, (4.3)
where Dc,i is the average dropping probability of class c in ONUi.
IB,c = ( M X i=1 Bc,i)2 M × M X i=1 (Bc,i)2 , c ∈ 0, 1, 2, (4.4)
where Bc,i is the average blocking probability of class c in ONUi.
4.2
Simulation Results
In this section, we show the performance of Q-DBA method. The traffic arrival rates are set as follows:
case one:
Voice service: 4.48Mbps × 32 (iid)
Video service: 0.55Mbps × 32 (iid) ∼ 15.75Mbps × 32 (iid) Data service: 0.28Mbps × 32 (iid) ∼ 7.27Mbps × 32 (iid) case two:
Voice service: 4.48Mbps × 32 (iid)
Video service: 0.55Mbps×20 (iid) +0.41Mbps×12 (iid) ∼ 15.75Mbps×20 (iid) +11.31Mbps×12 (iid) Data service: 0.28Mbps×20 (iid) +0.41Mbps×12 (iid) ∼ 7.87Mbps×20 (iid) +11.31Mbps×12 (iid)
The effectiveness of the proposed Q-DBA method is tested by comparing it with the DBAM proposed in [9]. For DBAM [9], the ONUs send report message according to their queues’ occupancies and the waiting times between last and present timeslots. In OLT, a maximum window of total bandwidth requirement or each class’s bandwidth requirement for ONUi is pre-assigned according to service level agreement (SLA). When the total bandwidth
requirement of the ONUi is larger than the preassigned maximum window of the total
band-width requirement for the ONUi, the allocated total bandwidth for the ONUi equals to its
pre-assigned maximum window. On the other hand, when the total bandwidth requirement of the ONUi is no less than the maximum window of the total bandwidth requirement for
the ONUi, the allocated total bandwidth for the ONUi equals its requirement. Furthermore,
the allocated bandwidths to voice and video packets follow the rule like that for allocating total bandwidth of ONUi. Finally, the residual bandwidth of the allocated total bandwidth
for ONUi is allocated to data packets.
Because the voice dropping probability is zero whether in Q-DBA or DBAM, the simu-lation result is not be presented. It is due to the QoS requirement for voice packets.
Fig. 4.1 illustrates the average video dropping probability versus system load in EPON. It can be found that the dropping probability in Q-DBA is zero when the system load is less than 0.8. It is because when video packets with the problem of delay requirement, the priority raises, and the video packets with a higher priority can be served earlier than than of original priority. When the system load is larger than 0.8, because the capacity of fiber link is limited, the dropping probability exceeds the video dropping probability requirement. However, in realistic system, the system does not work in such high load. Furthermore, if the Q-DBA works by combining a call admission control (CAC) mechanism, the QoS of dropping probability requirement can be guaranteed as well. It also can be found that the dropping probability in DBAM cannot be guaranteed. The DBAM defines a maximum window to
Figure 4.1: Average video dropping probability versus system load in EPON
video packets to allocate bandwidth, and the maximum window cannot totally support the burst arrival, therefore the video dropping probability is violated. Besides, when the system load is 0.6, both in case one and case two, the performances in Q-DBA are improved 100%. Fig. 4.2 illustrates the blocking probability of data packets versus system load in EPON. It can be found that the blocking probabilities both in Q-DBA and DBAM are zero when the traffic load is less than 0.8, because the system has enough bandwidth to support the system load. When the system load is larger than 0.8, the blocking probability in DBAM increases greatly than that in Q-DBA. It is because that the data burst arrival cannot be served within a short time in DBAM for there is a maximum window which is used to limit the allocated bandwidth to data packets. When the traffic load is low, there may be not large amount of packets arrival for a long time but burst arrival within a short time, the data packets will be dropped when a large number of data packets arrive into the data packets’
Figure 4.2: Average data data blocking probability versus system load in EPON queue if the allocated bandwidth cannot totally meet the real traffic condition. However, due to no limitation of allocated bandwidth in Q-DBA and the consideration of waiting bound for data packets, the blocking probability in Q-DBA does not increase as greatly as that in DBAM. It is shown that when the system load is 0.8, the blocking probability in Q-DBA is improved 100% whether in case one or case two. In Q-DBA, the dropping probability in case one is improved 14%, and that in case two is improved 2%.
Fig. 4.3 illustrates the starvation ratio of data packets versus traffic load in EPON. Because the data packets do not have strict delay requirement, but the data packets should not scarify them to support voice and video packets to result the starvation condition, which means that the data packets have a long waiting time. The starvation ratio is set to express the percentage of the data packets whose delay time is larger than the delay bound among the total transmitted data packets. It is shown that when the system load is less than 0.7, the
Figure 4.3: Average data starvation ratio versus system load in EPON
starvation in both Q-DBA and DBAM do not occur. It is due to there is enough bandwidth of fiber link in the system. When the system load is larger than 0.9, because the data packets are the lowest priority, and both video and data packets arrival rate increases, the burst arrival of data packets may not be instantly supported, the starvation occurs. However, the starvation ratio is still 60% improved by DBA in case one, and it also 60% improved by Q-DBA in case two because the priority of data packets will raise when considering the waiting bound in Q-DBA, and the data packets with a higher priority are more easily transmitted than before. Therefore, the starvation ratio in Q-DBA is less than that in DBAM. It can be found that when the system load is larger than 0.8, the starvation ratio in DBAM is larger than zero. It is due to the assigned maximum window has a limitation for bandwidth allocation, and the burst arrival influences the delay time. In this way, the starvation in DBAM happens earlier than that in Q-DBA.
Figure 4.4: Average voice delay time versus system load in EPON
Fig. 4.4 shows the average voice delay time versus system load in EPON. It can be seen that the voice delay in DBAM increases with the increasing of system load. The the packet arrival rate is the same, the DBAM allocates bandwidth to ONUs according to the maximum window and requirement, and the DBAM does not allocate bandwidth to ONUs if bandwidth is left therefore the average time interval between two consecutive time slot increases with the increasing of system load, and the average delay gradually increases with the increasing of system load. It also can be seen that the average voice delay in Q-DBA does not increase obviously when the system is less than 0.8 because the Q-DBA allocates total bandwidth to all ONUs by the step of residual bandwidth allocation, the voice packets have sufficient bandwidth to transmit the reported voice packets and new arrival voice packets, the voice packet arrival rate does not change when the system load changes, and the time interval between consecutive timeslot is nearly the same. However, when system load is larger than
Figure 4.5: Average video delay time versus system load in EPON
0.8, the average voice delay increases apparently. It is because that ONUs does not have too much bandwidth exceeding the requirement to transmit as many new arrival voice packets as they do when the system is less than 0.8. In addition, the average voice delay in DBAM is less than that in Q-DBA because the report message in DBAM includes prediction, and the requirement in report message can be satisfied as much as possible under the limitation of maximum window, but in Q-DBA, the ONUs only report the real queue occupancy of voice packets to the OLT, and the voice packets obtain bandwidth other than the requirement by sharing the residual bandwidth with video packets. Under this circumstances, the voice delay in Q-DBA is large than DBAM, but the voice delay requirement and the dropping probability are still satisfied.
Fig. 4.5 shows the average video delay time versus system load in EPON. It can be found that when the system load is below 0.8, the average video delay in Q-DBA is far from the
video delay requirement because the system have enough bandwidth to allocate. ONUs can get more bandwidth to transmit the video packets which are not be reported. When the system load exceeds 0.8, the packets are dropped because of the limitation of the bandwidth of fiber link, and the average video delay is close to the video delay requirement. It also can be found that the average video delay in DBAM increases almost smoothly with the increasing of system load because of the maximum window in DBAM, and the prediction in ONUs. The reason is similar to the average voice delay. Furthermore, it can be seen that the average video delay is in the case one of Q-DBA is improved 78%, and that in the case two of Q-DBA is improved 77%. It is due to the Q-DBA does not have a maximum window, and the video packets have a higher priority than data packets when the Q-DBA allocates bandwidth. Besides, when the video packet with the problem of delay requirement, the video packets have a higher priority to be allocated bandwidth. Thus, the burst arrival can be totally served, the delay can be decreased and the dropping probability can be also satisfied.
Fig. 4.6 shows the average packet delay time versus system load in EPON. It can be found that in DBAM, the average data delay in case one is less than that in case because of the less data arrival rate. In DBAM, the average data delay of case one or case two increases with the increasing of system load, because the maximum window does not meet the real requirement of data packets, and the burst arrival can not be served instantly. However, in Q-DBA, when the system load exceeds 0.8, the average data delay increased greatly because the system do not have enough bandwidth to support the burst arrival. The Q-DBA allocates bandwidth based on the requirement of queue occupancy, the burst arrival can be transmitted more easily, and thus the delay of data packets can be small. Besides, due to the Q-DBA considers the condition of waiting bound, the data packets in Q-DBA dose not violate the delay bound as early as that in DBAM does. It also can be seen that
Figure 4.6: Average data delay time versus system load in EPON
when the system load is 0.6, in Q-DBA, the average data delay in case one is improved 98%, and that in case two is improved 99%. It is because that the data packets in Q-DBA does not have a limitation like that in DBAM when bandwidth is allocated.
Fig. 4.7 illustrates the fairness index of average data delay versus system load in EPON. It can be found that the fairness index of average data delay in Q-DBA and DBAM is bear to 1. It is due to the Q-DBA consider all ONUs’ condition to allocated bandwidth. Furthermore, in DBAM, all ONUs have their maximum window to transmit packets according to the SLA. In this way, the fairness index of average data delay whether in Q-DBA or in DBAM is close to zero. It also can be found that the fairness index of average data delay in case two of DBAM varies greatly because the packet arrival rates are not the same, and the maximum window cannot suitably support the different traffic load.
Figure 4.7: Fairness index of average data delay versus system load in EPON
Figure 4.9: System utilization versus system load in EPON
It can be found that the fairness index of data packets in both Q-DBA and DBAM is close to 1. It is due to the DBAM has a maximum window to allocate packets according to the SLA, and the Q-DBA allocates packets based on the requirement of all ONU. It also can be found that when the traffic load is larger than 0.7, the overall fairness index of data packets in Q-DBA decreases with the increasing of traffic load. Because the data packets in Q-DBA are allocated in two different priority, when the traffic load is high, and not all data packets are allocated bandwidth in the same status, the overall fairness is little small than 1. In DBAM, the overall fairness index in case one is independent of different system loads. Although the DBAM in case one has a maximum window to allocate packets, because the data packets are the lowest priority, the burst in high priority cannot be always processed quickly to result packets’ blocking and long delay time, the over fairness index changes a little more with the increasing of traffic load.
Fig. 4.9 shows the system utilization versus system load in EPON. It can be found that the bandwidth utilization in Q-DBA is better than that in DBAM. It is because the bandwidth in Q-DBA is allocated step by step to difference class rather than set a maximum window to each class in advance. In addition, because the dropping probability of video packets is high, and the maximum window does not always meet the actual traffic condition, the bandwidth utilization in DBAM is limited. It also can be found that when system load is in 0.6, the case one of Q-DBA improves the system utilization 4.4%, and the case two improves 7.3%.
Chapter 5
ONU Assisted Q-DBA Method
5.1
Introduction
In chapter 3, the Q-DBA scheme, the residual bandwidth is allocated to real-time services, voice and video because we think that the real-time packets are delay sensitive, and will be dropped if their delay times violate the delay requirement. From the simulation results in chapter 4, we can see the QoS of real-time packets are almost totally guaranteed. In order to use the residual bandwidth more efficiently, and in advance meet the queues’ occupancies in all ONUs, the Q-DBA method is modified by the spirit of ONU assistance, and we call the modified Q-DBA method ”ONU Assisted Q-DBA Method”.
The information report of all ONUs is the same as that in chapter 3. The Q-DBA scheme except the step 6, residual bandwidth allocation, is also the same as that in chapter 3. In step 6, the residual bandwidth in ONU assisted Q-DBA method is allocated based on the occupancies of voice, video, and data packets instead of based only on the occupancies of voice and video packets in Q-DBA method in chapter 3. The step 6 is rewritten as follows:
Step 6: [Residual Bandwidth Allocation]
Denote the allocated bandwidth to voice packets in Q1,i, video packets in Q2,i , and data
packets in Q3,i by G 00 0,i, G 000 1,i, and G 000
L0,i, the queue occupancy of Q1,i, L1,i, the queue occupancy of Q2,i, L2,i, and the residual
bandwidth of the fiber link, B −
M
X
i=1
[G00,i+ G01,i+ G02,i+ G001,i+ G002,i]. The allocated bandwidth to voice packets, G000,i, video packets G0001,i, and data packets G0002,i are given by
G000,i = (B − M X i=1
[G00,i+ G01,i+ G001,i+ G02,i+ G002,i])+× L0,i
M
X
i=1
(L0,i+ L1,i+ L2,i)
,
G0001,i = (B −
M
X
i=1
[G00,i+ G01,i+ G001,i+ G02,i+ G002,i])+× M L1,i
X
i=1
(L0,i+ L1,i+ L2,i)
,
G0002,i = (B −
M
X
i=1
[G00,i+ G01,i+ G001,i+ G02,i+ G002,i])+× M L2,i
X
i=1
(L0,i+ L1,i+ L2,i)
.
(5.1)
As a consequence, gate message generation in step 7 can be modified as follows: Step 7: [Gate Message Generation]
Denote G0,i, G1,i, and G2,i, to be the final granted bandwidth of ONUi, 1 ≤ i ≤ M, in
the gate message to Q0,i, Q1,i, and Q2,irespectively. Based on the allocated bandwidth, G
0
0,i,
G01,i, G02,i, G001,i, G002,i, G000,i, G0001,i, and G0002,i, the granted bandwidths in gate message,G0,i, G1,i,
and G2,i are given by
G0,i = G 0 0,i+ G 00 0,i, G1,i = G 0 1,i+ G 00 1,i+ G 000 1,i, G2,i = G 0 2,i+ G 00 2,i+ G 000 2,i. (5.2) However, when ONUi, 1 ≤ i ≤ M, receives its gate message, because the residual
band-width allocation of Q-DBA scheme in the OLT does not actually meet the queues’ condition after the report message is transmitted to the OLT, the ONUi, 1 ≤ i ≤ M, assists to
re-arrange the granted bandwidth. It does not transmit packets completely following the gate message, but checks the present queues’ condition to reallocate the granted bandwidth in-stead. Before ONUi, 1 ≤ i ≤ M, receives its gate message, new arrival packets arrive. If the
total granted bandwidth is larger the sum of L0,i, L1,i, and L2,i, which are the last queue
occupancies in the report message, the difference between total granted bandwidth and the sum of L0,i, L1,i, and L2,i, which are named as additional bandwidth by us,are reallocated to
newly voice, video, and data packets. The additional bandwidth is assigned to voice, video, and data packets according to the proportion of each queue’s new arrival amount times its individual weights. Because voice and video packets usually have higher priorities than the data packets have, and their basic requirements, L0,i and L1,i, are satisfied, the data packets
acquire a little more weight to decrease the probability of occurring starvation condition. Therefore, the weights among voice, video, and data packets are 3, 3, and 4, respectively.
Denote L00,i, L01,i, and L02,i to be the amount of new arrival voice, video, and data packets in ONUi, 1 ≤ i ≤ M,, respectively; denote B0,i, B1,i, and B2,i to be final obtained bandwidth
to voice, video, and data packets in ONUi, 1 ≤ i ≤ M,, respectively. Based on L
0 0,i, L 0 1,i,L 0 2,i
L0,i, L1,i, L2,i, G0,i, G1,i, and G2,i, B0,i, B1,i, and B2,i are given by
B0,i= L0,i+ ([G0,i+ G1,i+ G2,i] − [L0,i+ L1,i+ L2,i]) ×
3 × L00,i
3 × L00,i+ 3 × L01,i+ 4 × L02,i,
B1,i= L1,i+ ([G0,i+ G1,i+ G2,i] − [L0,i+ L1,i+ L2,i]) ×
3 × L01,i
3 × L00,i+ 3 × L01,i+ 4 × L02,i,
B2,i= L2,i+ ([G0,i+ G1,i+ G2,i] − [L0,i+ L1,i+ L2,i]) ×
4 × L02,i
3 × L00,i+ 3 × L01,i+ 4 × L02,i,
if [G0,i+ G1,i+ G2,i] − [L0,i+ L1,i+ L2,i] > 0.
(5.3)
Figure 5.1: Average data delay time versus system load in EPON
The simulation environment is the same as that in chapter 4. Therefore, we skip the description of the simulation environment.
Fig. 5.1 and Fig. 5.2 show the average voice delay time versus system load. In Fig. 5.1, it can be found that the average data delay time in Q-DBA with ONU assisted is almost the same as that in Q-DBA. It is because the allocation mechanism of Q-DBA and Q-DBA with ONU assisted is almost the same. It also can be found that when the traffic load is less than 0.7, the average data delay time in Q-DBA with ONU assisted is less than that in Q-DBA. It is because that the granted bandwidth more corresponds to the data packets’ real condition. The data packets can obtain more additional bandwidth than the OLT grants after the OUN re-allocates the bandwidth to them especially due to the ONUs have no opportunity to get more bandwidth to data packets than their requirements to data packets in Q-DBA. In Fig. 5.2, it is seen that when the system load is less than 0.8, the average data
Figure 5.2: Average data delay time versus system load in EPON
delay in Q-DBA with ONU assisted is less than that in Q-DBA. It is because that when the residual bandwidth is available, the data packets in Q-DBA with ONU assisted can get additional bandwidth besides their requirement, and the ONU also assigns more bandwidth to data packets if the queue occupancy of data packets increases when the ONU receives gate messages. The differences between case one and case two whether in Q-DBA or Q-DBA with ONU assisted are presented as well. Because the data packet arrival rate in Case two is larger than that in case one, the average data delay in case two is a little higher that that in case one. When the system load is 0.6, in case one, the average data delay in Q-DBA with ONU assisted is improved 10%, and in case two, the average data delay in Q-DBA with ONU assisted is improved 9%.
Fig. 5.3 illustrates the average dropping probability versus system load in EPON. In Q-DBA, it can be seen that the average dropping probability in case two and case one are
Figure 5.3: Average video dropping probability versus system load in EPON
almost the same. And both of them are less than the dropping probability in DBAM. It is because both case one and case two have the mechanism to allocate bandwidth to the video packets which will be dropped at the end of next cycle if they are not transmitted at next timeslot. When system load is low, the bandwidth can support the load, and the dropping probability keeps in zero, and when the system load is high, the dropping probability are the same in both Q-DBA and Q-DBA with ONU assisted because the residual bandwidth is unavailable, and the difference between these two algorithm is very small. But, the DBAM does not have the mechanism to considering the video packets with the problem of delay requirement, and the allocated bandwidth is limited to the maximum window, the average video dropping probability in DBAM is higher.
Fig. 5.4 illustrates the blocking probability of data packets versus system load in EPON. It is seen that in Q-DBA and Q-DBA with ONU assisted, the average data blocking
prob-Figure 5.4: Average data data blocking probability versus system load in EPON ability is zero when the traffic load is less than 0.8. It is because when the traffic load is less than 0.8, data packets in the queue can be transmitted instantly to receive new arrival data packets’ queue. It is also seen that the average blocking probability in DBAM is larger than that in Q-DBA and Q-DBA with ONU assisted when the traffic load is larger than 0.7. The maximum window contributes to OLT not supporting the burst arrival when the traffic load is high, but the Q-DBA with ONU assisted and Q-DBA have the mechanism to change data packets’ priority. When the data packets are in the priority 4, they have a prior order to be allocated bandwidth, and thus the blocking probability in Q-DBA with ONU assisted or Q-DBA is not as high as that in DBAM.
Fig. 5.5 illustrates the average data starvation ratio versus traffic load in EPON. The starvation ratio is defined in chpter 4. It can be seen that the average dropping probability in Q-DBA with ONU assisted and the dropping probability in Q-DBA are almost the same. And
Figure 5.5: Average data starvation ratio versus system load in EPON
both of them are less than the dropping probability in DBAM. It is because both Q-DBA with ONU assisted and Q-DBA have the mechanism to allocate bandwidth to the data packets considering the waiting bound. But, the DBAM does not have this kind of mechanism, and the allocated bandwidth is limited to the maximum window. Under this circumstance, the DBAM cannot support the burst arrival of data packets instantly, especially when the system load is high, and the average data starvation ratio in DBAM is higher when the system load exceeds 0.7.
Fig. 5.6 and Fig. 5.7 show the average voice delay time versus system load. In Fig. 5.6, it can be found that the average voice delay time in Q-DBA with ONU assisted is almost the same as that in Q-DBA. It is because that voice packets are allocated firstly in both Q-DBA and ONU with ONU assisted. It also can be found that when the system load is less than 0.8, the average voice delay in Q-DBA with ONU assisted is a little more than that in
Figure 5.6: Average voice delay time versus system load in EPON
Figure 5.8: Average video delay time versus system load in EPON
Q-DBA. It is because that when system load is less than 0.8, the voice packets have to share the residual bandwidth with video and data packet instead of only with video packets, the new arrival voice packets cannot be always totally transmitted without reporting to the OLT. However, it also shown that when the system load is larger than 0.8, the average voice delay time in Q-DBA with ONU assisted is gradually close to that in Q-DBA. It is because that the residual bandwidth is not so available that voice packets cannot obtain more additional bandwidth than the system load less than 0.8.
Fig. 5.8 and Fig. 5.9 illustrate the average video delay time versus system load. In Fig. 5.8, it can be found that the average video delay time in Q-DBA with ONU assisted is almost the same as that in Q-DBA. It is because the basic allocation procedure of Q-DBA and Q-DBA with ONU assisted is the same. In Fig. 5.9, it can be found that when the traffic load is less than 0.8, the average video delay time in Q-DBA with ONU assisted is a
Figure 5.9: Average video delay time versus system load in EPON
little larger than that in Q-DBA. It is because that the granted bandwidth to video packets are shared to voice and data packets, especially data packets, and the video packets cannot be transmitted as many packets as they are transmitted in Q-DBA. When the traffic load exceeds 0.8, the bandwidth only can be allocated to support ONUs’ requirement in both Q-DBA and Q-DBA with ONU assisted, and thus the average video delay are nearly equal. However, according to Fig. 5.3, the dropping probability does not be effected in Q-DBA with ONU assisted. It also can be seen that in Fig. 5.9, the video delay in case one is larger than that in case two because there is larger packet arrival rate to video packets.
Fig. 5.10 illustrates the fairness index of average data delay versus system load in EPON. It is found that the fairness index of average data delay keeps almost in 1 among these three mechanism. It is because that the DBAM designs a maximum window for data, and both Q-DBA with ONU assisted and Q-DBA allocate bandwidth to data packets based on their
Figure 5.10: Fairness index of average data delay versus system load in EPON requirement. It is also found that the fairness index of DBAM in case two oscillates because the maximum window cannot support the different data arrival rate efficiently.
Fig. 5.11 illustrates the overall fairness index of data packets versus system load in EPON. It can be found that the fairness index of data packets decreases when the load exceeds 0.7 because the data packets are the lowest priority, and the burst arrival of data packets may not be transmitted during a small period. It can be found as well that the overall fairness index of data packets in Q-DBA with ONU assisted does change that in Q-DBA because both of them allocate bandwidth based on the requirements and residual bandwidth. In addition, the DBAM do not appropriately meet the different loads among different ONUs therefore the overall fairness index does not change sommthly.
Fig. 5.12 shows the system utilization versus system load in EPON. It can be found that the system utilization in Q-DBA with ONU assisted is almost the same as that in Q-DBA.
Figure 5.11: Overall fairness index of data packets versus system load in EPON
It is because that Q-DBA with ONU assisted sufficiently allocates bandwidth to all ONUs like the Q-DBA does. It also can be found that the system utilization in DBAM is not as high as that in Q-DBA and Q-DBA with ONU assisted because the maximum window does not meet the real condition of all traffic services, and the residual bandwidth does not be used.