592 OPTICS LETTERS / Vol. 18, No. 8 / April 15, 1993
Unique behavior of thickness dependence in the nonlinear
wave-mixing process with a nematic thin film
Chen-Lung Kuo, J.-G. Wei, and Shu-Hsia Chen
Institute of Electro-Optical Engineering, National Chiao Tung University, Hsinchu, Taiwan 30050, China
Received November 9, 1992
The dependence of the optimal electric biasing field and the diffraction efficiency on the thickness of the nematic thin film through the degenerate four-wave-mixing process is investigated. For relatively low optical pumps, the optimal bias monotonically increases with thickness, while the corresponding diffraction efficiency increases at first and then decays for a thickness even less than 150 Am, which is well within the phase-matching regime. For stronger pumps, the optimal bias can be doubly valued, and the curve of optimal bias versus thickness shows
a closed loop. This behavior is unique to liquid crystals. The main mechanism is due to the twist effect of
molecular orientation in addition to the scattering loss. these peculiar phenomena.
The physical origin as well as the efficiency of degen-erate four-wave mixing'-6 (DFWM) are consistently interesting subjects in nonlinear optics. For a com-mon medium,3 the nonlinear effects become more prominent when the interaction length is increased within the phase-matching regime. In nematic liq-uid crystals (NLC's), the deformation and fluctuation of the director are also involved in the nonlinear process. Therefore the threshold intensity, the non-linear coefficient, and the non-linear loss are strongly dependent on the physical dimension of the medium. Armitage and Delwart4 and Khoo and Lin5 have reported that the diffraction efficiency increases and then decreases with respect to the sample thickness for DFWM in NLC's. However, they attributed this phenomenon to the scattering loss of the medium. The experimental results in Ref. 5 have shown that the curve of diffraction efficiency increases monotoni-cally after the correction of scattering loss. The large optical nonlinearity based on molecular reorientation can be further enhanced by an applied static field. In previous studies6 we have illustrated that the peak efficiency of DFWM with respect to the electric field can be obtained at a specific bias that is strongly dependent on the elastic deformation in NLC films. If the nonlinear phase shift is large enough, local maximum efficiency can be observed at two distinct voltages.
In this Letter we report the novel effects of NLC film thickness on the wave-mixing process. Instead of using multiple-layer NLC films,5 we use a
single-layer sample with spacers of different thicknesses. Increasing the thickness by layer numbers does not change the nonlinear coefficient of the sample film. It is emphasized that the nonlinear coefficient is no longer a constant in our samples of different thicknesses. It is illustrated that after correcting the scattering loss, there is still a drop in the plot of diffraction efficiency versus thickness. Moreover, the curve of optimal biasing field versus thickness shows a novel closed loop within the double-peak regime instead of the two divergent curves that are
Both the numerical and experimental results show
usually obtained with respect to other parameters.6
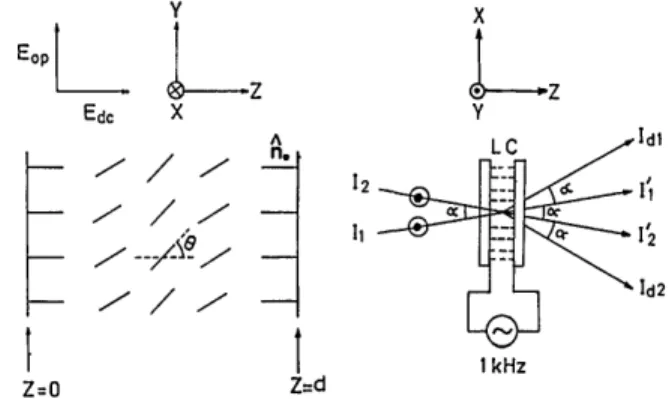
The twist effect and nonlinear phase-shift accumu-lation in NLC are the crucial factors accounting for these effects, since the twist deformation (and the nonlinear coefficient) decreases and the phase-shift accumulation increases with an increase of thickness. Figure 1 schematically depicts the problem under study. Consider a homeotropically aligned NLC cell of thickness d with an electric field (1 kHz) applied parallel to the unperturbed director hn. Two laser beams at AO = 514.5 nm, with intensities I, and I2, are nearly normally incident on and overlapped in the sample with a fairly small intersection angle a. The nematic substance is assumed to have neg-ative dielectric anisotropies, namely, ell < e±. For a sufficiently thin sample, DFWM can be treated as diffraction from the induced phase grating that is created under the steady illumination of an optical
intensity I(x, y, z) = I,
+ I2+ 21I2 cos(27Tx/A),
with
the grating period A = Ao/[2 sin(a/2)]. In general, the spatial distribution of molecular reorientation in NLC media is a local response to the distribution of the intensity grating. With hard boundaries as-sumed [i.e.,
0(z
=0)
=0(z
= d) =0],
the angle of reorientation in the first-order approximation can be expressed as 0(x, z) = [01 + 02 cos(27rx/A)]sin(7rz/d). The equilibrium values of the constants 01 and 02Y Eop Edc X Z=O /--/- / -A -1 Z~d '2 II X
LZ
Y 'Idl I d ' 2 i1d2 1 kHzFig. 1. Schematic of the nonlinear wave-mixing process.
April 15, 1993 / Vol. 18, No. 8 / OPTICS LETTERS 593
can be calculated from the minimization of total free energy F by letting aF/a01 = 0 and aF/202 =
0-Under the assumptions that 01 < .7r/2 and 022 <<
1, which are always satisfied in the following calcu-lations and experiments, we have6
01 - KG1(01, 02) - (V/Vth)2G2(01, 02)
-IrG
3(1, 02) + (It/Ith)G4(01,02) = 0, (1)02 = 2IrJ1(201)
1 + 2a - (1 + b)[Jo(201) - J2(201)] - KG5(01, 0)
(2)
where a 2(K2/K3)(d/A)2 is termed the twist ratio
hereafter; b
a It/Ith ± (V/Vth)2 -1
isthe reduced
effective field; K = I - Kl/K3, with K1, K2, and K3the splay, twist, and bend elastic constants, respectively; Gi(01, 02), i = 1, 5 are polynomial functions of 01 and
02; V is the applied voltage, and Vth = 7r(4'rKo3A A e I)-/2 is the threshold voltage, with
Ae
= el - e,; Ith =(7r/d)2(cK3/n~u) is the threshold intensity, with u =
1 - n e2/n 2; c is the velocity of light in a vacuum; n, and ne are the ordinary and maximum extraordinary refractive indices, respectively; Ir = I>I2/Ith and
I = Il + I2; and Jj(201) is the Bessel function of the
first kind, of order i.
If the local angle 0 is known, the effective refrac-tive index can then be obtained. The corresponding induced phase shift across the sample is 8(x)- 8 + 81 cos(2i-x/A), where 80 and 8l are the uniform phase retardation and the amplitude of this nonlinear phase grating, respectively. For u sin2 0 << 1 (for the usual nematics u << 1), we have
31 = (2ird/AO)AliNL = 7run~d02JJ(201)/Ao, (3)
where ALiNL is the nonlinear refractive-index change averaged over sample thickness. The relative dif-fraction efficiency, referring to the fundamental diffraction beam Id., is
'7
Idj/It
-r,[Ji(8
1)]
2+ r
2[J
2(8i)]
2,
(4)
This is also true for the more general case as shown by the results of our numerical calculation.
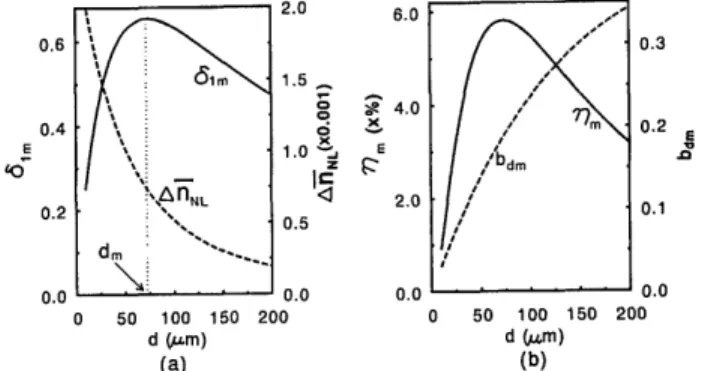
Our numerical calculations have been made from relations (1)-(4) to illustrate the unique behavior of thickness dependence. The results are shown in Figs. 2 and 3(a). The maximum phase amplitude Sim and the corresponding average nonlinear refractive index AfiNL versus sample thickness d for It/Ith =
0.01 are plotted in Fig. 2(a). Instead of monoton-ically increasing, the curve of 81in versus d has a peak value at optimal thickness din. This is obvious since the optical path increases and AflNL decreases with increasing d. We attribute this phenomenon to the twist effect. The reason is that our grating is characterized by the twist angle 02, where the twist is along x. 02 decreases and so does AflNL as the sample thickness increases. By letting
a8jam/ad
= 0, we have the approximated optimal thickness d, = 0.13A/K3/K2 [as derived from relation (6)]. If theactual total intensity I, rather than the reduced
in-tensity It/Ith is kept constant, we can obtain another optimal value dml' 0.19AK 3/k 2. It favors a larger optimal thickness in the latter case. The reason
0.6 0.4 '0 0.2 0.0 0 50 2.0 6.0 1.5, 0 1.0 .: I z 0.5 0.0 100 150 200 d (am) (a) Z 4.0 2.0 0.0 0.3 0.2 E .0 0.1 I * . . 0.0 0 50 100 150 200 d (gm) (b)
Fig. 2. Numerical results of (a) optimal phase ampli-tude 81m and the corresponding nonlinear refractive index
AflNL and (b) peak diffraction efficiency 77m and optimal field bdm versus the sample thickness d. Parameters used are ne = 1.81, no = 1.57, jIAeI = 0.5, r1 = 0.595,
r2 = 0.405, K = 0.23, K2JK3 = 4/7.5, A = 180 /,u and
It/Ith = 0.01. where r = Il/It, r2 = I2/1t, and ri + r2 = 1.
The behavior of the diffraction efficiency Y7 is char-acterized by the property of the nonlinear phase shift 61. While the reduced optical intensity It/Ith is fixed, the optimal bias bpm for the maximum phase amplitude 8,.,, can be obtained by letting the first-order derivative of 61 be zero, i.e., a81/ab = 0. In
the extreme case of 022 << 012 << 1, a << 0.5, and
K = 0, the optimal field becomes bpm = (d/A),
and the corresponding maximum phase is 8
im = (27Wd/AO)AfiNL(bpm)
= (2lrd/AO)(unoI,)[1 - 4 K2/K3(d/A)], (5)
(6)
where AfiNL(bpm) is the corresponding A~iNL at bp and is also the maximum value of AflNL with respect to b. Note that AfiNL(bpm) decreases with an increase of d.
0.5 0.4 0.3 E .0 0.2 0.1 0.0 0 50 100 150 d (em) (a) 1.5 1.2 0.9 E 0.6 0.3 0.0 200 40 80 120 d (Am) (b) 160
Fig. 3. Optimal field bdm versus the sample thickness d in the double-peak regime. (a) Numerical results calcu-lated with It/Ith = 0.04; other parameters are the same as in Fig. 2. (b) Experimental results with It/Ith = 0.25 and A = 134 ,um. Both the solid and dashed curves are a guide for the eye. The environmental temperature is approximately 22'C, and the weights are r1 = 0.595 and
594 OPTICS LETTERS / Vol. 18, No. 8 / April 15, 1993 8.0 xC E P 6.0 4.0 2.0 0.0 0.8 0.6 E .0 0.4 0.2 0.0 50 100 150 200 d (um)
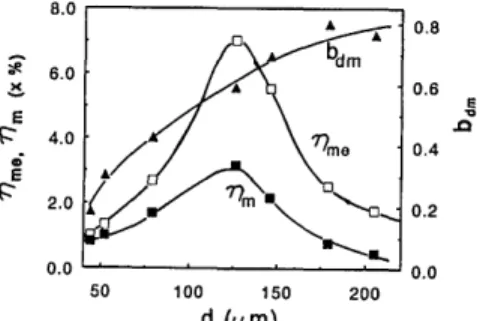
Fig. 4. Experimental results of peak diffraction efficiency
77ms effective peak efficiency 77me, and optimal field bdm versus the sample thickness d in the single-peak regime.
?7me is defined as 7,,/exp(-/3d), where ,B (cm-') is the
measured loss coefficient. The curves are a guide for the eye. The environmental temperature is approximately
260C.
is that the effective pump It/Ith is simultaneously increased with d for fixed I,, because the threshold intensity Ith is inversely proportional to the square of thickness.
In the case of r, = 0.595 and r2 = 0.405, the
diffraction efficiency y7 in Eq. (4) has a maximum with respect to the specific phase shift 81 = 2.075.
For c1 < 2.075, q is a monotonically increasing
function of e1. There is only one peak6 in the plot of
77 versus b, and the optimal bias bdm for the maximum efficiency 77m is the same as that (i.e., the term bpm) for
the maximum phase amplitude 61m. The calculated result of 77m versus d is plotted in Fig. 2(b), and its behavior is essentially the same as that of 8,m. The optimal field bdm, which is subjected to the twist ratio as illustrated in relation (5), increases with d. Since the general behavior of S1 versus b is increas-ing from zero and then decreasincreas-ing to zero again, stronger pumps that actuate 81,,, to exceed 2.075 can result in the occurrence of double peaks7 (where t1 equals 2.075) in the plot of diffraction efficiency versus electric bias. Referring to the general trend of the 6im curve in Fig. 2(a), double peaks can appear only in the middle of the thickness range, where 8.m is larger than 2.075. This is illustrated by the numerical results shown in Fig. 3(a). It is obvious that the double peaks appear only in the middle of the thickness range and shows a novel closed loop instead of two divergent curves. The maximum phase 8im corresponding to both end points of the loop is exactly 2.075.
Fresh samples of good optical quality are pre-pared by sandwiching the nematic substance N-(4-methoxybenzylidene)-4-butylaniline between two glass windows. The sample thickness is controlled by a calibrated Mylar spacer. The diameter of the laser spot is larger than 1 mm. The detail of the experiments is essentially the same as that described in our previous report.6
The threshold intensity and voltage, e.g., of a 92-,um-thick sample, are determined to be 464 W/cm2 and 3.74 V, respectively. Figure 4 gives the observed peak efficiency 77m and optimal
biasing field bdm as a function of thickness in the
single-peak regime. The effective peak efficiency
nlme, as normalized to the linear scattering loss,5 is
also plotted in the figure. The grating period is fixed at 112 /zm, and the incident intensities are kept at I, = 0.0 0 6 21th and
I2 = 0.0 0 5 8Ith, respectively.
bdm increases with thickness d as it is subjected to
the twist effect. It is unambiguously shown that both 77,,, and '7me have maximum values near 125
Atm. It is obvious that the decreasing diffraction efficiency with respect to thickness is not only due to scattering loss but also due to the suppression of the twist deformation. The crucial influence of the sample thickness on the peak efficiency and optimal bias illustrated here agrees with the numerical results shown in Fig. 2(b). The experimental result in Fig. 3(b) exhibits the characteristic behavior of the numerical calculation in Fig. 3(a). Although the closed-loop curve of bdm'S is not thoroughly presented under our experiments, the bdm'S seem to come closer in the larger thickness range. It is almost impossible for us to determine the optimal bias for the relatively thick samples because the simultaneous occurrence of self-phase-modulation effects8 (several rings are
observed) makes it difficult to distinguish the lowest-order diffraction beam from the other spots.
In conclusion, we have shown that the sample thickness dependence of DFWM by means of molec-ular reorientation in liquid crystals is unique. That is, with weak input beams, the diffraction intensity exhibits a local maximum within the phase-matched regime instead of monotonically increasing as for a common nonlinear medium. The optimal biasing field for diffraction efficiency with respect to the thickness shows a novel closed loop in the double-peak regime with strong input beams, instead of two divergent curves that are usually obtained with respect to other parameters, e.g., the grating period. The twist effect and nonlinear phase-shift accumula-tion in NLC are the crucial factors that account for these phenomena.
This research was supported by the Chinese Na-tional Science Council under .contract NSC 80-0417-M009-02.
References
1. S. D. Durbin, S. M. Arakelian, and Y. R. Shen, Opt. Lett. 7, 145 (1982).
2. N. V. Tabiryan, A. V. Sukhov, and B. Ya. Zel'dovich, Mol. Cryst. Liq. Cryst. 136, 1 (1986).
3. See, e.g., R. A. Fisher, ed., Optical Phase Conjugation (Academic, New York, 1983).
4. D. Armitage and S. M. Delwart, Mol. Cryst. Liq. Cryst.
122, 59 (1985).
5. I. C. Khoo and T. H. Liu, Phys. Rev. A 39, 4036 (1989).
6. S.-H. Chen and C.-L. Kuo, Appl. Phys. Lett. 55, 1820 (1989); C.-L. Kuo and S.-H. Chen, J. Appl. Phys. 68,
4413 (1990); S.-H. Chen and C.-L. Kuo, Mol. Cryst. Liq. Cryst. 207, 131 (1991).
7. C.-L. Kuo and S.-H. Chen, Opt. Lett. 15, 610 (1990). 8. S. D. Durbin, S. M. Arakelian, and Y. R. Shen, Opt.
Lett. 6, 411 (1981). A
A