1093-0191/03/$ - see front matter䊚 2002 Elsevier Science Ltd. All rights reserved. PII: S 1 0 9 3 - 0 1 9 1 Ž 0 2 . 0 0 0 3 0 - 8
Sludge dewatering by electrokinetic technique: effect of processing
time and potential gradient
ChingYuan *, Chih-huangWeng
a, bDepartment of Civil and Environmental Engineering, National University of Kaohsiung, No. 700, Kaohsiung University Road,
a
Non-Tzu Dist., 811, Kaohsiung, Taiwan, ROC
Department of Civil Engineering, I-Shou University, No. 1, Hsueh-Chen Road., Sec. 1, Ta-Hsu Hsiang, Kaohsiung County 840,
b
Taiwan, ROC
Abstract
A sludge cake(87.8% of moisture content) from a wastewater treatment plant was used to investigate the effects
of processingtime and potential gradient on the water removal by an electrokinetic(EK) process. A potential gradient
ranging from 2.5 to 5.0 Vycm was applied to induce the movement of bound water within the sludge specimen for
a time period of 4–41 h. Results showed that the direction of electroosmosis (EO) flow was from the anode to
cathode. Due to the release of Hq and OHy through electrolysis of water, the sludge pH was maintained at 2.4–6.6 near the anode side and 8.7–10.7 near the cathode after EK treatment. At an applied potential gradient of 5.0 Vycm
for 41 h, the moisture content of sludge decreased further to 62.6%. The EO permeability and the power consumption throughout the test period were approximately 0.24–1.38=10y5 cm2yV s and 11.5–249.7 kW hym , respectively. A3
total disposal cost savingof up to 17.4–25.6% was achieved with the aid of the EK technique. Results also showed that increasing either the potential gradient or the processing time would enhance the sludge dewatering efficiency.
䊚 2002 Elsevier Science Ltd. All rights reserved.
Keywords: Dewatering; Electrokinetic process; Potential gradient; Processing time; Sludge; Sludge dewatering
1. Introduction
Sludge dewatering can be accomplished by freeze– thaw, centrifuge force, mechanical press and sun-drying. The freeze–thaw method is capable of decreasingthe water content of sludge to 50–60%(Knocke and
Trah-ern, 1987; Lee and Lee, 1995) and even lower to 43%
with addition of polymer electrolytes (Huanget al.,
1999) under low temperature conditions. However, the
consumption of energy and polymer electrolytes may become limitingfactors under economical consideration. The centrifuge process and mechanical press can not remove the bound water efficiently. Use of sunshine to remove water from sludge is an economical way but it needs a large space and sufficient time (07 days). In
Taiwan, mechanical press and sunshine are the two
*Correspondingauthor. Tel.: 7-5919178; fax: q886-7-5919376.
E-mail address: [email protected](C. Yuan).
common sludge dewatering methods being used in wastewater treatment plants. The water content of sludge can be decreased to 65–85% and 60–70% for the above-mentioned methods, respectively.
The electrokinetic(EK) process has been
demonstrat-ed to be a cost-effective remdemonstrat-ediation technology to separate and extract heavy metals and organic contam-inants from soils and sludges(Acar and Alshawabkeh,
1996; Wenget al., 2000; Yuan et al., 2001). It applies
low voltage DC to the porous medium and the pollutants or water will be removed through electroosmosis(EO)
flow which is driven by an electrical field(Wenget al.,
2000).
Hence, in this research, the EK process is used to further improve the mechanical dewateringefficiency. The purpose of this research was to investigate the effect of processingfluid and potential gradient on sludge dewatering by the EK process. Furthermore, the EK phenomenon duringtreatment was demonstrated.
Table 1
The physicochemical properties of tested sludge
Characteristics Values Metal contents(mgykg) Values
Moisture content(%) 84.1 Cd 28.5
Organics(%) 56.9 Cr 537
Sludge pH 7.2 Cu 28.5
pHzpc 3.0 Fe 5265
Average particle size(mm) 6.5 Ni 167
Pb ND
Zn 264
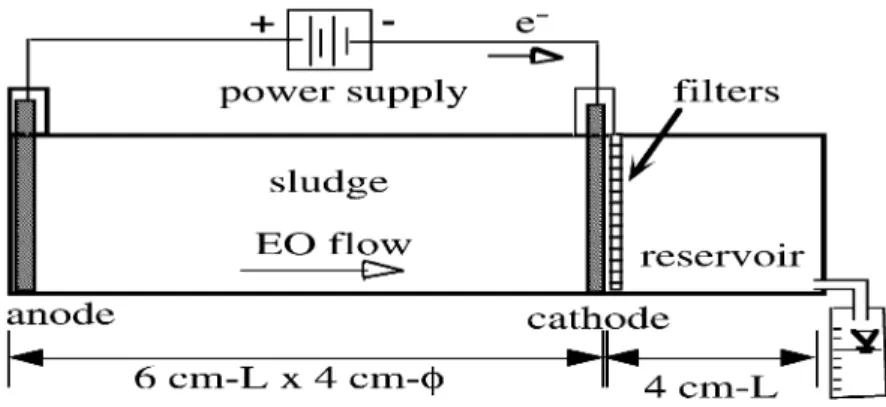
Fig. 1. The schematic of EK apparatus.
2. Materials and methods 2.1. Sludge
The sludge cakes used in this research were a mixed sludge sampled right after belt press treatment from a local wastewater treatment plant. The fundamental prop-erties of this sludge sample are listed in Table 1. The pH, water content, organic content, and the metal content of the sludge were analyzed according to Taiwan EPA methods. The zeta potential of sludge particulates was determined usinga zeta meter(Laser Zee 3.0, Pen
Kem Inc., USA).
2.2. Electrokinetic experiments
The EK experiments were conducted with acrylic cylindrical cells (Fig. 1) consistingof two
compart-ments: a sludge specimen chamber (6 cm in length)
and a cathode reservoir (4 cm in length). The tested
sludge with a moisture content of 87.8"3.0% was placed within the sludge chamber for the EK experi-ments. A fiberglass filter paper (0.45 mm, 47 mm in
diameter, advantec GS25, Japan) was inserted between
the sludge specimen and the cathode reservoir to sepa-rate the sludge from the effluent water. Two sets of graphite rod electrodes (0.64 cm in diameter, Union
Carbon Co., USA) were installed at each side of the
sludge chamber. The detailed EK experimental condi-tions are listed in Table 2. The electric current, reservoir pH, and the amounts of effluent water were monitored duringthe tests. The sludge pH, residual water content profiles alongthe sludge specimen, and the concentra-tion of metals in the effluent were determined at the end of each test.
3. Results and discussion 3.1. Electroosmotic permeability
The direction of EO flow was found as expected from the anode toward the cathode for all tests. This is because the surfaces of the sludge particles were nega-tively charged during the test periods because the sludge pH profiles alongthe cell were all greater than pHzpc (3.0). The EO permeability, K (cm yV s), for a cylin-2
e
drical sludge core of cross-section area of A (cm ) is2
calculated by Eq.(1),
Q sK i Ae e e (1)
whereQ (cm ys) is defined as EO flow, i (Vycm) is3
e e
the applied electric gradient. The results of EO flow collected in the cathode reservoir andK values for alle
Table 2
The experimental conditions for EK systems
Test Length of sludge Areas of graphite Potential gradient Processingtime
no. chamber(cm) electrodes(cm )2 (Vycm) (h)
1 6 22 2.5 4 2 6 22 2.5 24 3 6 22 5.0 4 4 6 22 5.0 24 5 6 22 5.0 41 Table 3
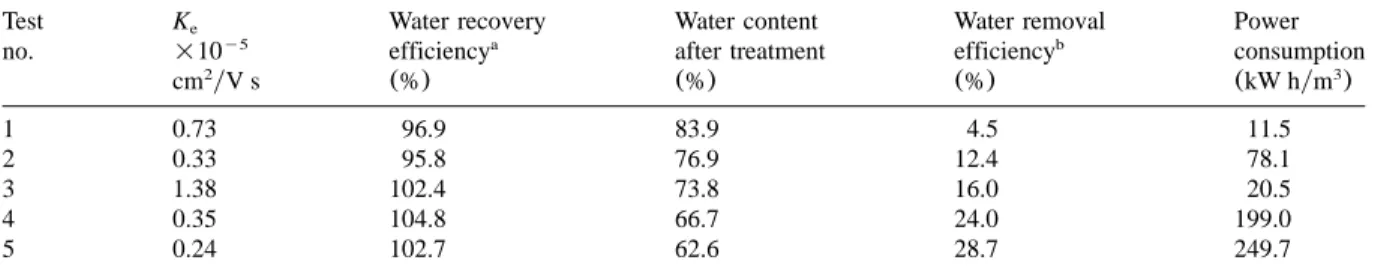
The experimental results of water removal from sludge by EK process
Test Ke Water recovery Water content Water removal Power
no. =10y5 efficiencya after treatment efficiencyb consumption
cm2yV s (%) (%) (%) (kW hym )3 1 0.73 96.9 83.9 4.5 11.5 2 0.33 95.8 76.9 12.4 78.1 3 1.38 102.4 73.8 16.0 20.5 4 0.35 104.8 66.7 24.0 199.0 5 0.24 102.7 62.6 28.7 249.7
Water recovery efficiencys(Water collected in cathodeytotal water removed)=100.
a
Water removal efficiencys((initial water content in the sludgeyresidual water content after treatment)yinitial water content in
b
the sludge)=100.
Fig. 2. Effect of processing time on sludge pH profiles.
tests are presented in Table 3. Because the processing fluid was not supplemented duringthe EK dewatering process, it was found that K increased at higher elec-e
trical voltages, whereas K decreased with increasede
elapsed time. The obtained values of Ke (0.24–
1.38=10y5 cm2yV s) are relatively lower than those (5.2–8.2=10y5cm2yV s) from studies of metal
remov-al from sludge by an EK process (Wenget al., 1999;
Yuan et al., 2001).
3.2. Sludge pH profiles
The water electrolysis reaction in which Hq and OHy are continuously released at the anode and cath-ode, respectively, (Eqs. (2) and (3)) is considered as
the predominant reaction under an electric field.
q y
Anode: 2H O™O q4H q4e (2) 2 2 g( )
y y
Cathode: 2H Oq2e ™H q2OH (3)
2 2 g( )
Duringthe EK process, the movement of Hq and OHy would change the sludge pH drastically. The sludge pH profiles along the cell affected by the proc-essing time and potential gradient are shown in Fig. 2 and Fig. 3, respectively. A general trend of low pH at the anode and high pH at the cathode was found. The occurrence of these phenomena was attributed to the acid front generated at the anode reservoir flushed across the sludge specimen and a great amount of OHy
produced at the cathode. The results also show that either higher potential gradient or longer elapsed time in the EK process would lower the sludge pH further near the anode side and increase the sludge pH further near the cathode side.
Fig. 3. Effect of potential gradient on sludge pH profiles.
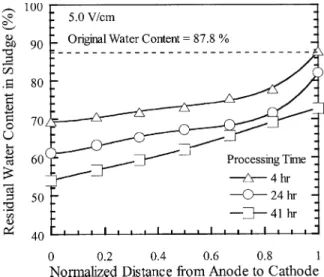
Fig. 4. The residual water content profiles in sludge for EK system at different processingperiods.
Table 4
The amount and percentage of metals in the effluent
Cd Cr Cu Fe Ni Zn
(mgykg) (mgykg) (mgykg) (mgykg) (mgykg) (mgykg)
1 0 0 0.001 0.004 0.011 0.012 (0%) (0%) (0.004%) (0.0001%) (0.007%) (0.004%) 2 0 0.021 0.005 0.110 0.031 0.009 (0%) (0.004%) (0.017%) (0.002%) (0.019%) (0.04%) 3 0.001 0.020 0.017 0.218 0.015 0.030 (0.024%) (0.004%) (0.058%) (0.004%) (0.009%) (0.011%) 4 0.001 0.025 0.017 0.082 0.058 0.021 (0.026%) (0.005%) (0.060%) (0.002%) (0.035%) (0.008%) 5 0.003 0.018 0.023 0.172 0.042 0.019 (0.105%) (0.003%) (0.079%) (0.003%) (0.025%) (0.007%)
The value in the parenthesess(metals in the effluentytotal amount of metal)=100. 3.3. Metal concentration in the effluent
The results of metals collected in the cathode reservoir are listed in Table 4. Up to 0.105% of metals were collected in the effluent. This indicates that the amount of metals obtained in the effluent is of insignificant concern. However, the EK process might result in an accumulation of soluble organic matter (in terms of
TOC or COD) and even odor in the effluent. It needs
to be further investigated and considered for effluent treatment if a rather high organic matter content of sludge, i.e. biosolid, is found in the effluent.
3.4. Water removal efficiency
The efficiency of water removal from sludge by the EK process is summarized in Table 3. Approximately
95.8–104.8% of the removed water was collected in the effluent(Table 3) which is in the allowable error range
of "5%(mass balance). As for the test with an applied
potential gradient of 5.0 Vycm, the water removal
efficiency was 16.0, 24.0 and 28.7% for the elapsed times of 4, 24 and 41 h, respectively (Tests 3–5). As
the potential gradient was increased from 2.5 to 5.0 Vy
cm, the water removal efficiency increased from 4.5 to 16.0% and 12.4 to 24.0% for the processingtimes of 4 and 24 h (Tests 2 and 4), respectively. The results
obviously indicated that the EK process operated at higher potential gradient and longer processing time would enhance water removal from sludge.
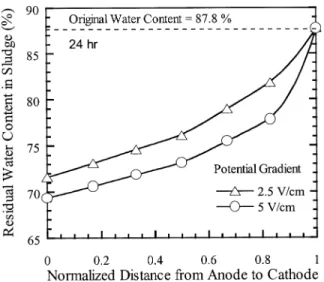
The residual water content profiles alongthe sludge specimen are shown in Fig. 4 and Fig. 5. In general,
Fig. 5. The residual water content profiles in sludge for EK system at different potential gradients.
Fig. 6. The relationship between power consumptionywater removal efficiency and processingtime.
Table 5
Cost analysis for EK dewateringprocess
Test no. Sludge water Disposal costa Energy cost Total costb Cost savingwith EKc
content(%) (USDyton) (USDyton) (USDyton) (%)
No EK With EK No EK With EK No EK With EK No EK With EK
1 87.8 83.9 96.6 79.3 0 0.5 96.6 79.8 17.4
2 87.8 76.9 96.6 73.6 0 3.7 96.6 77.3 20.0
3 87.8 73.8 96.6 70.9 0 1.0 96.6 71.9 25.6
4 87.8 66.7 96.6 65.1 0 9.6 96.6 74.7 22.7
5 87.8 62.6 96.6 61.7 0 11.6 96.6 73.3 24.1
The shippingfee is included in the disposal fee.
a
Total costs(disposal costqenergy cost). The total cost excludes the capital cost of EK apparatus.
b
Cost savingwith EKs(total cost without EKytotal cost with EK)ytotal cost without EK.
c
higher bound water removal efficiency was found at the anode side than at the cathode side. The water contents near the anode were 73.3, 71.8, and 54.0% for the elapsed times of 4, 24, and 41 h (Tests 3–5),
respec-tively, under an applied potential gradient of 5.0 Vycm.
When the test was operated under higher potential gradients, the water removal efficiency indeed increased
(Tests 1, 3 and Tests 2, 4) accordingly. Although the
highest total water removal efficiency for this research was only 28.7%, it reached as high as 38.5% for the sludge near the anode.
3.5. Power consumption
The energy consumption can be calculated based on Eq.(4):
B E
E sPyV su s
C
|
VIdt yVF
s (4)D G
whereE , energy consumption per unit volume of sludgeu (W hym ); P, energy expenditure (Wyh); V , the vol-3
s
ume of sludge (m ); V, the voltage (V); I, the current3 (A); t, processingtime (h). The energy consumption
upon the termination of the experiments was in the range of 11.5–249.7 kW hym . In the constant-voltage3
tests(Tests 3–5), the energy consumption was directly
related to the processing time. A higher energy con-sumption would result in a higher water removal effi-ciency (Fig. 6). A same phenomenon was also found
for the case of constant-processingtime: the higher the potential gradient, the more the power consumption.
The cost analysis for the EK process is listed in Table 5. A total cost savingof 17.4–25.6% for sludge dewa-teringby the EK process is estimated. As potential
gradient and processing time increased to 5.0 Vycm and
41 h, respectively, it resulted in a higher cost due to higher power consumption.
4. Conclusions
The followingconclusions were drawn based on results of water removal from sludge by the EK process: 1. Due to no supplement of water in the EK systems, the value of Ke decreased as processingtime increased, whereas there was no impact on the enhancement of water removal efficiency.
2. In this research, the sludge in the vicinity of anode was acidified, while the sludge near the cathode became more basic after EK treatment.
3. The results indicate that both higher potential and longer processing time in the EK systems would enhance the water removal from sludge. Under an electric gradient of 5.0 Vycm, the moisture content
of sludge can be lowered from 82.8 to 62.6%, 66.7 and 73.8% for 4, 24 and 41 h of processingtime. 4. A total cost savingof up to 17.4–25.6% for sludge
dewateringby the EK process was found in this research.
References
Acar, Y.B., Alshawabkeh, A.N., 1996. Electrokinetic remedi-ation. I: pilot-scale tests with lead-spiked kaolinite. J. Geo-tec. Geoenviron. Engng. 122 (3), 173–185.
Huang, C.P., Yuan, R.S., Peng, C.K., Chen, M.Y., 1999. The effect of low temperature on the dewateringcharacteristics of sludge, Proceedings of the 24th Conference of Wastewater Treatment Technology, pp. 771–775(in Chinese). Knocke, W.R., Trahern, P., 1987. Freeze–thaw conditioningof
chemical and biological sludge. Wat. Res. 23, 35–42. Lee, D.J., Lee, S.F., 1995. Measurement of bound water in
sludge: the use of differential scanning calorimetric(DSC). J. Chem. Tech. Biotechnol. 62, 359–364.
Weng, C.H., Lin, Y.H., Hsieh, Y.H., 2000. Electrokinetic remediation of trichloroethylene contaminated kaolinite. J. Chinese Institute of Environ. Engng. 10 (4), 279–289. Weng, C.H., Yuan, C., Chen, W.C., Chuang, H.P., Chen, R.C.,
1999. The feasibility study of metal removal from sludge by surfactant-electrokinetic process. Proceedings of the 14th Conference of Waste Treatment Technology, pp. 5-9–5-15. Yuan, C., Weng, C.H., Chuang, H.P., Chen, W.C., 2001.
Remediation of Cr(III) contaminated clay by electrokinetic: the effect of processingfluids. J. Chinese Institute of Environ. Engng. 11 (3), 179–186.