ELSEVIER BioSystems 40 (1997) 103-109
Modeling of the response of midbrain auditory neurons in
the rat to their vocalization sounds based on FM
sensitivities
MC. Kaoa, Paul W.F. Peon* b, X. Surf**
‘Institute of Electronics, National Chiao Tung Uniuersiry, Tainan, Taiwan, hDepattnzent of Physiology, National Cheng Kung Uniuersit), Tainm, Taiwan‘Depamnent of Physiology, University of Hong Kong, Hong Kong
Abstract
Single units were recorded from the inferior colliculus (ICY) of anaesthetized rats in response to: (a) an FM tone, the frequency of which was randomly varied, and (b) a digitized rat vocalization sound. We hypothesized that these neurons may have ‘orientation-specific’ spectrotemporal receptive field (STRF) that can be used to estimate their responses to complex communication signals. Based on the FM response, we first estimated the cell’s STRF which was then convolved with the spectrogram of the rat’s vocalization call. A simple convolution gave only crude prediction of the cell’s response to the vocalization sound. When inhibitory areas were added around certain parts of the STRF, a better match was found. We conclude that for some FM-sensitive neurons of the IC, STRF with inhibitory areas may account for their responses to vocalization sounds.
Keywords: Neural modeling; Auditory neuron; Vocalization sound; Frequency modulation; Receptive field
1. Introduction
To a large extent acoustic signals are first processed by the auditory periphery which acts like band-pass filters (Kiang et al., 1965). A pure tone is an effective stimulus when its energy falls inside the frequency tuning cmve or receptive
*Corresponding author, Fax: +886 6 2362780; e-mail: ppoon@mail.ncku.edu.hv
‘Present address: Department of Biology, East China Nor- mal University, Shanghai, China.
field (RF) of an auditory-nerve fiber (Kim and Young, 1994). Further along the central auditory pathways, cells become less responsive to such steady stimuli. For example, at the level of the midbrain or cortex, many cells simply do not respond to pure tones. Instead they respond to dynamic aspects of the sound like fluctuations in frequency or amplitude (Whitfield and Evans, 1965). Responses to tones with frequency modu- lation (FM) could be detected at the periphery (Khanna and Teich, 1989). But the differential response to the slope of an FM envelop was
0303-2647/96/$15.00 0 1996 Elsevier Science Ireland Ltd. All rights reserved PII SO303-2647(96)01635-S
104 M.C. Kao et al. /BioSystems 40 (1997) 103-109
found first at the midbrain where the response characteristics and the cytomorphology of FM- sensitive cells have been well examined (Rees and Moller, 1983; Poon et al., 1991, 1992a).
At the brainstem, and more so at the cerebral cortex, some cells respond particularly well to communication sounds (Kirzinger and Jurgens, 1991; Pelleg-Toiba and Wollberg, 1991; Rauschecker et al., 1995). For a given cell at these levels, it is often unclear as to what features of the complex sound (e.g. either FM or AM components) actually evoke its response (Nelken et al., 1994). Since a major function of the audi- tory system is to analyze complex sounds like vocalization, it is an obvious question to ask if FM-sensitivity may account for the cell’s response to complex sounds. To investigate this problem, one can either analyze the spectrum of a vocaliza- tion sound, and to correlate the response with the presence of FM components just preceding the neuronal spikes. Alternatively one can model the neuron’s response to vocalization stimulus based on its sensitivity to FM (or AM) tones, and then determine to what extent the model output matches the experimental data.
The first approach is confronted with the dif- ficulty that vocalization sound is often a highly structured signal and may consist of multiple spectral bands (e.g. like formants). Consequently it is ambiguous as to which spectral component in the vocalization sound may associate with the evoked spikes.
In this study we adopted the second approach because it is independent of complex spectral structures in the sound spectrum, and could therefore, give clearer results. Specifically, we recorded a number of midbrain auditory neurons in terms of their response first to a randomly varying FM tone, and then to a digitized rat call. We subsequently estimated the cell’s RF based on its FM response, and used the RF to predict the cell’s response to the vocalization sound. To a first approximation, we assumed that the nervous system is grossly linear, and that the FM sensitiv- ity is the major underlying mechanism for the cell’s response to complex sound. Preliminary re- sults showed that RF with both excitatory and inhibitory areas provided a sufficiently good match
to the experimental data, at least for some FM- sensitive cells.
2. Methods
2.1. Animal experiment
The procedure of electrophysiological record- ing of single unit activity which was used in this experiment has been reported previously (Poon et al., 1991, 1992a). In brief, the rat (150-250 g body weight) was first anaesthetized with urethane (1.5 g/kg, i.p.>. The head of the animal was then mounted on a special head-holder that allowed free-field acoustic stimulation. A glass micro- pipette electrode was lowered into the inferior colliculus (IC) through a skull opening overlying the auditory midbrain. Single unit spike activity was amplified and conditioned before captured by an analog-to-digital interface (Tucker Davis Technology DDl) which also generated the acoustic stimuli. Spike responses were stored and analyzed on an IBM 486 computer.
2.2. FM stimulation
A low-pass filter version (< 200 Hz) of a white noise, representing a slowly varying ‘random’ noise, was used to modulate the frequency of a sine-wave generator (Tektronix 5OlA) at its volt- age-control-frequency input. The signal was deliv- ered through a free-field speaker (Pioneer SE621 placed 70 cm directly in front of the rat. The overall frequency response was + 10 dB between 0.5 kHz and 40 kHz. Spikes generated by the neuron were used to interrupt the continuous sampling of a ‘random’ noise (Data Translation DT2801A), so that a peri-spike epoch of the mod- ulating waveform was captured at the occurrence of each spike (100 ms before, 28 ms after). For details of methodology, please refer to our previ- ous work (Peon et al., 1992b).
2.3. Vocalization stimulation
We digitized (200 kHz, 16 bit) the rat call that normally would be emitted by the restrained ani- mal when a hypodermic needle was introduced
M.C. Kao et al. /BioSystem 40 (1997) 103-109 105
for injection of anesthetics. The calls had stereo- typical spectral patterns and were quite repro- ducible across rats. The same vocalization stimu- lus (2 s in length, about 50% duty cycle) was used throughout the experiment.
2.4. Neural modeling
We hypothesized that the neuronal response to the vocalization signal can be estimated by a local convolution of the RF with its input sound en- ergy:
O=RFxI+e (1)
where ‘0’ is the known response of the cell to vocalization sound (represented as peri-stimulus time histogram, PSTH); ‘RF’, the to-be-identified spectra-temporal receptive field (STRF, Clopton and Backoff, 1991; Schafer et al., 1992) to vocal- ization sound; ‘I’ the known acoustic input (i.e. spectrogram of the vocalization sound obtained by short time Fourier Transform); ‘X ‘, the un- known operator (that approximates the operation of the underlying neural circuitry from periphery to the midbrain) and ‘e’, the unknown contribu- tions of the system (e.g. non-linear properties).
To estimate the ‘RF’ of a given cell, we used the FM data which was assumed to reflect the excitatory area of the STRF. Then we convolved the ‘RF’ with spectrogram of the vocalization sound and expressed the output as the cell’s probability of firing action potentials. To facilitate comparison with experimental data, we normal- ized the output with respect to the maximum peak value in the experimental PSTH. We con- sidered that a departure from experimental PSTH (or an error signal) would reflect incorrect esti- mation of the ‘RF’. This error signal was subse- quently minimized by modifying the ‘RF’ in an iterative manner, by a program written in MatLab (version 4.2, Mathworks Inc.). Modifications were made in a systematic way involving the choice of different weights of the excitatory FM-RF, and simultaneously adding inhibitory areas around it.
3. Results 3.1. FM response
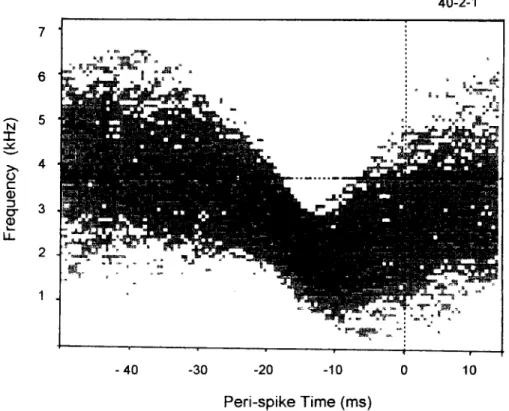
Fig. 1 shows the STRF of a typical FM-sensitive cell. It usually appeared to be ‘cigar-like’ on the time-frequency plane, suggesting that it is ‘orien- tation-specific’. The area of increased probability of the stimulus signal reveals the features of the preferred FM stimulus (e.g. in terms of its fre- quency range and velocity of sweep). For this cell, it responded to a fall in frequency when a tone swept from 3.6 kHz to 1.0 kHz within 15 ms, with a response latency of about 10 ms. In our sam- pled population, cells preferred frequency sweeps of either directions. A simple thresholding of the results in Fig. 1 suppressed areas of low probabil- ity and we used that to estimate of the cell’s STRF.
3.2. Response to vocalization
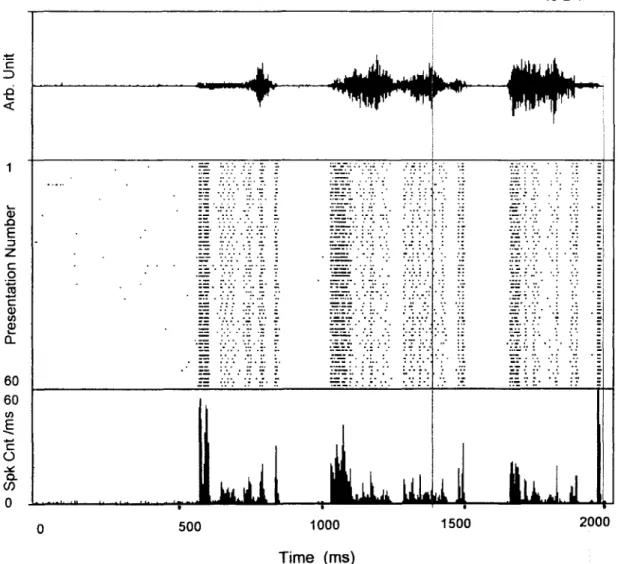
FM-sensitive cells typically responded also to the vocalization stimuli (Fig. 2). Repetitive stimu- lation of 60 identical stimuli produced highly re- producible PSTH which was used to represent ‘O’, the to-be-modeled response of the cell. For the purpose of easy explanation, we will use the data taken from the same cell through out this presentation.
3.3. Model output
We first examined the effects of choosing dif- ferent threshold values in the estimation of STRF. Results on convolution with the vocal sound spec- trogram are shown in Fig. 3. At certain threshold value, the excitatory STRF produced a model output as judged subjectively that looked closest to the empirical PSTH, with predicted response ‘peaks’ generally more extensive than those in the experimental data (e.g. Fig. 3B). Regarding tem- poral position of the peaks, the modeled output often lagged behind those in the actual PSTH, up to 20 ms in some cases. To tolerate this discrep- ancy (as will be discussed below), our iteration procedure was intentionally designed to accept mismatches in peak latency up to 20 ms.
106
6
M.C. ffio et al. /BioSystems 40 (1997) 103-109
-40 -30 -20 -10 0 10
Peri-spike Time (ms)
Fig. 1. A number of per&spike segments (64 ms long, n = 1000) of the ‘random’ modulating signal were overlaid to produce, in spectral-temporal plane, a probability distribution of the signal that triggered the occurrence of a neuronal spike (vertical dotted line) in the rat IC. The intensity of ink at each pixel is proportional to probability of occurrence of the modulating signal. The ‘cigar-like’ concentration depicts the FM features that this cell prefers, which is an FM tone sweeping from 3.6 kHz down to 1 kHz over an epoch of 15 ms. The mean frequency of the FM tone is marked by the horizontal dotted line.
By altering relative weights within the thresh- olded area, we were unable to satisfactorily minimize the error. One mismatch we found was in the temporal position of the predicted re- sponse peaks which often lagged behind the ac- tual data. In addition, the model predicted extra response peaks not present in the experimental PSTH. However, when inhibitory areas were added around certain parts of the STRF, the match would improve markedly. Specifically, the response peaks became more restricted in time and ‘valleys’ started to replace the areas where there should be little or no response (e.g. Fig. 30.
While it was possible to achieve relatively good match with the experimental results for some neurons, there were also other cases where such satisfactory match was not found in the limited
range of iterations we had performed. We noticed that for many of these FM neurons, its response especially to the beginning of the vocalization call was often vigorous, suggesting that some additio- nal AM sensitivity could be involved.
4. Discussion
Our principal finding is that it is possible to estimate, for at least some cells in the auditory midbrain, their response to vocalization sound based on FM sensitivities. The major difference between an FM-RF and the estimated STRF to vocalization sound is the addition of inhibitory areas in the latter. This discrepancy is probably not surprising since our method of generating the FM-RF would only reveal excitation areas, while concealing those inhibitory areas.
MC. Kao et al. /BioSystems 40 (1997) 103-109 40-2-I 107 0 500 1000 Time (ms) 1500 2000
Fig. 2. A recording of rat’s vocalization sounds (top) was repetitively presented to evoke neuronal spikes from an FM neuron (same cell as in Fig. 1) the response of which is shown in dot raster (middle), and in PSTH (bottom). Details of spectrogram and matching of model outputs are shown for an expanded epoch (vertical lines) in Fig. 3.
The presence of inhibitory areas in the STRF is nae. It is therefore possible that the ‘cigar-like’ consistent with the known inhibitions reported in excitatory area of an STRF can be decomposed the auditory midbrain (see Suga, 1995 for review). into smaller excitatory areas, each resembles the The inhibitory areas especially for those trailing inhibitory area in size, representing temporally behind the excitatory areas (e.g. Fig. 3C) could be related synaptic inputs (i.e. FM stimulation) from easily explained as a simple post-excitatory inhibi- adjacent isofrequency laminae. The presence of tion of the neuron. The morphological character- inhibitory areas is consistent with the FM-sensi- istics of FM-sensitive neurons (Peon et al., 1992a) tive cell’s lack of response to a pure tone, while it suggested that these cells could receive synaptic can be driven by a more transient sound like a inputs from 2 to 4 contiguous isofrequency lami- click (Peon et al., 1991).
108 M.C. Kao et al. /BioSystems 40 (1997) 103-109
I
40-2-l 6835 Prespike Time (ms) 0
Time (ms)
We were not surprised to find that not every cell in the auditory midbrain could be modeled satisfactorily with our present method which com- pletely ignored other sensitivities of the cells (e.g. to AM sounds). Since it has been known that both at the midbrain and at the auditory cortex some FM-sensitive cells also respond to AM stimuli (Rees and Moller, 1983; Eggermont, 1994; Gaese and Ostwald, 1995). However, the inclusion of other sensitivities into the model will be outside the scope of the present study. It was somewhat surprising that our relatively simple model was able to predict gross response patterns of at least some FM-sensitive cells to the vocalization sound. That simple convolution of the input sound en- ergy with RF gave a rather crude match with the empirical data implies that the inputs to those FM-sensitive cells were probably primary-like or from pure-tone cells. That some IC cells do re- spond to pure tones, with or without sharpening of frequency tuning, is consistent with previous reports in the literature (Aitkin et al., 1978; Yin and Kuwada, 1983; Suga, 1995). If FM-sensitive cells could receive synaptic inputs from these pure-tone cells, then it would justify our use of convolution as the operator for the underlying neural circuitry, especially in the context of com- plex sounds where spectral components vary rather quickly with time.
One of the non-linearities we have allowed in the model is the mismatch in latency of response peaks. From our earlier work on IC (Chen et al.,
1988; Poon et al., 19911, we observed that when
Fig. 3. A: The spectrogram, obtained by Short Time Fouier Transform, of a portion of the vocal sound stimulus (see Fig. 2). Ink represents areas of high energy. B: The model output (solid line) obtained by truncating the STRF of Fig. 1 at 65% of maximum (see ‘E’ area in Fig. 3C inset) and convolving it with the spectrogram. The peaks in the model output were typically more profuse than experimental result (dashed line). C: The addition of an inhibitory area to the right of the truncated STRF drastically improved the matching. Inset: ‘E’ represents excitatory area, ‘I’, inhibitory area in the STRF used in convolution. The maximum response levels were equated to allow comparison between experimental and model outputs.
M.C. tio et al. /BioSystems 40 (1997) 103-109 109
presented a linearly frequency-modulated tone, most FM-sensitive cells fire spikes at a fixed fre- quency point on the FM sweep. Hence for the same cell, a slow FM sweep will tend to produce a spike later in time than a fast FM sweep when the same frequency range is covered. In our convolu- tion algorithm, the model produced a fixed re- sponse latency. To allow this non-linear property to be incorporated into our model, we simply set a loose criterion for the response latency. This necessary compensation in response latency probably reflects a limitation of adopting simple convolution as the operator in our model.
Acknowledgements
We thank Dr. B.R. Sun for his help in the initial data collection, and Dr. S.G. Chen for his advice. Partly supported by National Science Council research grants 84-2331-B6-103, 85-2331- B6-64.
References
Aitkin, L.M., Dickhaus, H., Schult, W. and Zimmermann, M., 1978, External nucleus of inferior colliculus: auditory and spinal somatosensory afferents and their interactions. J. Neurophysiol. 41, 837-847.
Chen, X.Y., Poon, P.W.F., Cheung, Y.M. and Hwang, J.C., 1988, Response latencies of FM units in the inferior col- liculus of the rat. Sot. Neurosci. Abst. 14, 647.
Clopton, B.M. and Backoff, P.M., 1991, Spectrotemporal re- ceptive fields of neurons in cochlear nucleus of guinea pig. Hearing Res. 52, 329-344.
Eggermont, J.J. 1994, Temporal transfer functions for AM and FM stimuli in cat auditory cortex. Effects of carrier type, modulating waveform and intensity. Hearing Res. 74,51-66. Gaese, B.H. and Ostwald, J., 1995, Temporal coding of ampli-
tude and frequency modulation in the rat auditory cortex. Eur. J. Neurosci. 7, 438-450.
Khanna, S.M. and Teich, M.C., 1989, Spectral characteristics of the responses of primary auditory-nerve fibers to fre- quency-modulated signals. Hearing Res. 39, 159-175. Kiang, N.Y-S., Watanabe, T., Thomas, EC. and Clark, L.F.,
1965, Discharge patterns of single fibers in the cat’s audi- tory nerve. (M.I.T. Press, Cambridge, Mass., USA).
Kim, P.J. and Young, E.D., 1994, Comparative analysis of spectra-temporal receptive fields, reverse correlation func- tions, and frequency tuning curves of auditory-nerve fibers. J. Acoust. Sot. Am. 95, 410-422.
Kirzinger, A. and Jurgens, U., 1991, Vocalization-correlated single-unit activity in the brain stem of the squirrel monkey. Exp. Brain Res. 84, 545-560.
Nelken, I., Prut, Y., Vaadia, E. and Abeles, M., 1994, In search of the best stimulus: an optimization procedure for finding efficient stimuli in the cat auditory cortex. Hearing Res. 72, 237-253.
Pelleg-Toiba, R. and Wollberg, Z., 1991, Discrimination of communication calls in squirrel monkey:call ‘detectors’ or ‘cell assembles’? J. Basic Clin. Physiol. Pharmacol. 2, 257-272.
Poon, P.W.F., Chen, X. and Cheung, Y.M., 1992a. Differences in FM responses correlate with morphology of neurons in the rat inferior colliculus. Exp. Brain Res. 91, 94-104. Poon, P.W.F., Chen, X. and Hwang, J.C., 1991, Basic determi-
nants for FM responses in the inferior colliculus of rats. Exp. Brain Res. 83, 598-606.
Poon, P.W.F., Chung, G.T.T., Fung, J.C.K., Lam, F.K. and Chan, F.H.Y., 1992b, Triggering features of auditory neu- rons in the midbrain revealed by random FM stimulation. Proc. Biomed. Eng. BME’92 1, 162-165.
Rauschecker, J.P., Tian, B. and Hauser, M., 1995, Processing of complex sounds in the macaque nonprimary auditory cortex. Science 268, 11 l-l 14.
Rees. A. and Moller, A.R., 1983, Responses of neurons in the inferior colliculus of the rat to AM and FM tones. Hearing Res. 10, 301-330.
Schafer, M., Rusamen, R., Dorrsheidt, G.J. and Knipschild, M., 1992, Setting complex tasks to single units in the avian auditory forebrain. II. Do we really need natural stimuli to describe neuronal response characteristics? Hearing Res. 57,231-244.
Suga, N., 1995, Sharpening of frequency tuning by inhibition in the central auditory system: tribute to Yasuji Katsuki. Neurosci. Res. 21, 287-299.
Whitfield, I.C. and Evans E.F., 1965, Responses of auditory cortical neurons to stimuli of changing frequency. J. Neuro- physiol. 28, 655-672.
Yin, T.C. and Kuwada, S., 1983, Binaural interaction in low- frequency neurons in inferior colliculus of the cat. III. Effects of changing frequency. J. Neurophysiol. 50, 1020-1042.