The Impact of Factors on Mathematics Performance of
Vietnamese and Southeast Asian Countries' Students –
A Comparative Perspective
Quang-Vinh TrinhDoctoral student, Department of Educational Policy and Administration, National Chi Nan University Fwu-Yuan Weng
Professor, Department of Educational Policy and Administration, National Chi Nan University
一、
INTRODUCTION
Programme for International Student Assessment (PISA) is a 3-year cycle of international assessments organised by the Organisation for Economic Co-operation and Development (OECD) since 2000. In each cycle, PISA has assessed three key fields of knowledge and skill, namely reading, mathematics, and science literacies (OECD, 2013). PISA offers insight for education policy and practice, which helps to monitor trends in students’ acquisition of knowledge, and skills across countries, economies, and different demographic subgroups within each country. More specifically, PISA provides reliable empirical evidence to identify the strengths and weaknesses of the education systems.
PISA 2012 focused on measuring student mathematics literacy and its data collection covered 65 countries. Because the measurement of PISA is quite comprehensive and credible, this paper used this database of PISA to select the targeted samples. In addressing the paper gap, the purpose of this paper is to analyze the factors influence mathematics performance of Vietnamese
and Southeast Asian countries' students. Three research questions were designed in agreement with the aims of this paper. (1) How is the mathematics
performance of Vietnamese and Southeast Asian countries' students? (2) Are there significant differences
between the mathematics performance and gender in ASEAN countries' students?
(3) Are there significant differences of mathematics performance, between gender and parent's academic level in ASEAN countries' students?
二、 LITERATURE REVIEW
The Organization for Economic Co-operation and Development’s (OECD) PISA also focuses on using mathematics. It is designed to assess the readiness of 15-year-olds for life beyond school, focusing on the extent to which students are able to use their knowledge and skills to meet real-life challenges. This reflects a change in curricular goals and objectives in many countries, which are increasingly concerned with what students can do with what they learn at school (OECD, 2003).
Mathematical literacy is defined in PISA as (OECD, 1999)
“an individual’s capacity to identify and understand the role that mathematics plays in the world, to make well founded judgments and to use and engage with mathematics in ways that meet the needs of that individual’s life as a constructive, concerned and reflective citizen.”
Coben (2003) indicated that a fundamental problem for anyone reviewing the research literature in this area: there is as yet no consensus about the nature of adult numeracy. Numeracy is a deeply contested concept, beset by terminological confusion, especially when referring to adults. He argued that a plethora of similar and loosely related terms compete for attention: mathematical literacy, techno-mathematical literacy, quantitative literacy, functional mathematics, mathemacy, and so on.
A small scale study by Hackett & Betz (1989) discovered positive correlations among students' mathematics achievement and their levels of self-efficacy, mathematics attitudes, and their masculine sex-role orientation. In 1990, Matsui et al. explored the mechanisms underlying mathematics self-efficacy in Japanese college students. They found that students with high frequencies of mathematics accomplishment also had higher levels of mathematics
self-efficacy than did students with fewer accomplishments. They also found that males' mathematics self-efficacy was significantly higher than that of females. In a large longitudinal study, Akinloye (2005) investigated the variables as behavior, ethnicity, and gender towards students' mathematics performance. This study attempted to find out the effects of student-made manipulatives, behavior, ethnicity and gender on the mathematics section performance of students in a Southeast Texas school district.
According to Lloyd et al. (2005) showed that girls' achievement in mathematics met or exceeded that of boys. It seems that there have been relative gains for girls in terms of attributions. More specifically, it appears that girls' success and failure attributions tended to be more self-enhancing than reported in traditional attribution research. He pointed out that boys' success and failure attributions were also relatively self-enhancing. Also, these results seem to challenge those of previous studies that claim that girls espouse more self-defeating attribution styles than boys. The research project of Solange (2013) aimed at exploring the factors affecting the performance of students in these courses and coming up with recommendations to enhance their achievement. It also studied gender differences in the performance of students in remedial mathematics
courses and revealed patterns of students' attitude towards mathematics and mathematics anxiety.
三、 METHODS
The paper presents the research methods with three sections: Samples, Research Variables, and Data Analysis.
(一) Samples
This paper uses data mining method to explore the PISA 2012 data in order to answer the research questions and achieve the research aims. The targeted students were selected from ASEAN countries, including Vietnam (4,959), Indonesia (5,622), Malaysia (5,197), Singapore (5,546), and Thailand (6,606). The total number of samples was 27,930 and their age ranged from 15.3 to 16.2.
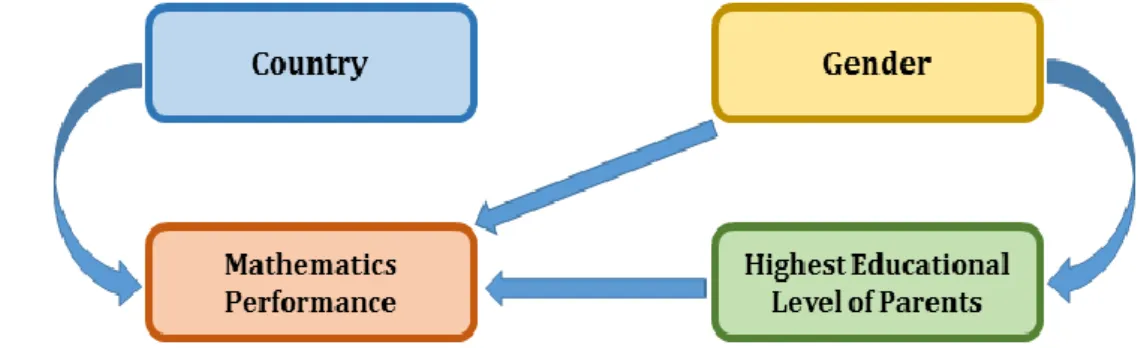
Figure 1. Research framework
(二) Research Variables
The selected variables in this paper are mathematics performance (PViMATH), gender, and highest educational level of parents (HISCED). The definitions of the research variables are as follows:
a. Mathematics performance (OECD, 2014): This used five multi-dimensional scaling models respective five plausible values from PV1MATH to PV5MATH.
b. Highest educational level of parents (OECD, 1999 & 2014):
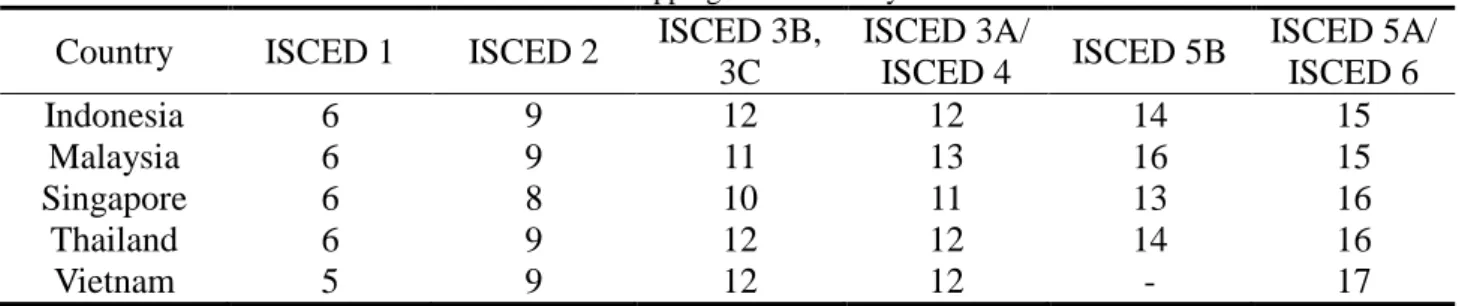
This index is constructed by taking the highest level of father and mother and having the following categories: (0) None (not received training), (1) Completed ISCED level 1 (primary education), (2) Completed ISCED level 2 (lower secondary education), (3) Completed ISCED levels 3B or 3C (upper secondary education providing direct access to the labour market or to ISCED 5B programmes), (4) Completed ISCED level 3A (upper secondary education providing access to ISCED 5A and 5B programmes) and/or ISCED level 4 (non-tertiary post-secondary), (5) Completed ISCED level 5B
(non-university tertiary education), (6) Completed ISCED level 5A (university
level tertiary education) or ISCED level 6 (advanced research programmes).
Table 1. Mapping of ISCED to years
Country ISCED 1 ISCED 2 ISCED 3B, 3C ISCED 3A/ ISCED 4 ISCED 5B ISCED 5A/ ISCED 6 Indonesia 6 9 12 12 14 15 Malaysia 6 9 11 13 16 15 Singapore 6 8 10 11 13 16 Thailand 6 9 12 12 14 16 Vietnam 5 9 12 12 - 17 (Source: OECD, 2014) (三) Data Analysis
Data analysis was performed with IBM – SPSS 22.0 software. Descriptive analysis was used to answer the research question 1: “How is the mathematics performance of Vietnamese and Southeast Asian countries' students?”. Independent-Sample t-Test analysis was used to answer the research question 2: “Are there significant differences between the mathematics performance and gender in ASEAN countries' students?”. One-Way ANOVA analysis was used to answer the research question 3: “Are there significant differences of mathematics performance, between gender and parent's academic level in ASEAN countries' students?”.
四、 RESULTS
The paper intends to explore significant differences of mathematics performance, between gender and parent's academic level in ASEAN countries' students.
(一) Student performance in mathematics in Viet Nam and Southeast Asian countries
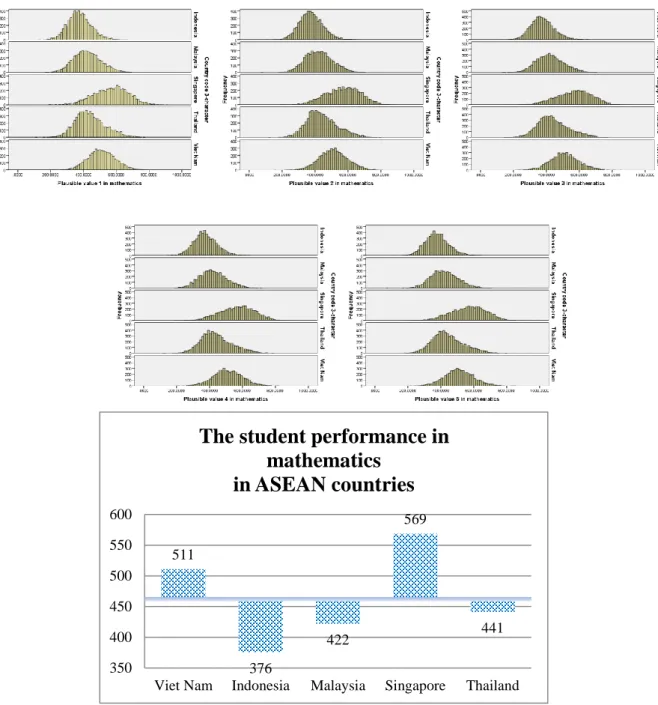
Table 2 shows the overall statistics of student performance in mathematics in Viet Nam and Southeast Asian countries. Generally, mathematics performance in ASEAN countries’ students was 462.03 – 462.22, Singapore (568.18 – 568.82) showed the highest level of the five countries, followed by Viet Nam (510.59 – 510.94), Thailand (441.15 – 441.80), Malaysia (421.47 – 422.79), and Indonesia (375.22 – 376.07).
Table 2. Descriptive Statistics of Student Performance in Mathematics in ASEAN Countries
Country PV1MATH PV2MATH PV3MATH PV4MATH PV5MATH Viet Nam N 4959 4959 4959 4959 4959
Mean 510.59 510.89 510.60 510.61 510.94 Median 508.34 509.59 508.97 507.72 508.97 SD 83.53 83.80 84.69 84.71 84.37 Skewness 0.09 0.04 0.08 0.04 0.10
Country PV1MATH PV2MATH PV3MATH PV4MATH PV5MATH Kurtosis -0.02 0.05 0.09 -0.03 0.03 Indonesia N 5622 5622 5622 5622 5622 Mean 376.07 375.31 375.57 375.22 375.93 Median 371.76 371.79 371.25 370.70 373.00 SD 70.40 70.19 69.95 69.87 69.87 Skewness 0.29 0.27 0.32 0.28 0.30 Kurtosis 0.25 0.17 0.29 0.17 0.26 Malaysia N 5197 5197 5197 5197 5197 Mean 422.79 422.14 421.89 421.47 421.54 Median 418.53 419.15 417.75 417.67 417.05 SD 80.76 80.72 80.44 80.62 80.63 Skewness 0.20 0.18 0.21 0.22 0.20 Kurtosis -0.19 -0.16 -0.13 -0.14 -0.11 Singapore N 5546 5546 5546 5546 5546 Mean 568.36 568.70 568.68 568.82 568.18 Median 574.63 573.73 574.67 573.50 573.77 SD 104.71 104.55 104.95 104.08 104.97 Skewness -0.19 -0.20 -0.24 -0.20 -0.23 Kurtosis -0.23 -0.27 -0.25 -0.25 -0.23 Thailand N 6606 6606 6606 6606 6606 Mean 441.15 441.53 441.19 441.80 441.41 Median 430.88 430.92 430.99 430.99 430.22 SD 91.86 92.24 92.16 92.23 92.32 Skewness 0.45 0.44 0.42 0.44 0.44 Kurtosis 0.07 0.05 0.05 0.02 0.03 Total N 27930 27930 27930 27930 27930 Mean 462.22 462.16 462.03 462.05 462.05 Median 450.47 450.66 448.99 449.69 449.61 SD 110.29 110.57 110.64 110.60 110.54 Skewness 0.41 0.40 0.41 0.40 0.41 Kurtosis -0.22 -0.24 -0.25 -0.25 -0.24
(Source: based on the PISA 2012 data)
Overall, the coefficient of Skewness in Thailand (0.42 – 0.45) showed the highest level, followed by Indonesia (0.27 – 0.32), and Malaysia (0.18 – 0.22), that means the student performance in mathematics distribution skewed to the left; only Singapore (-0.24 – -0.19) skewed to the right. The
coefficient of Kurtosis in Singapore (-0.27 – -0.23) and Malaysia (-0.19 – -0.11), had the low degree of the peakedness; only Indonesia (0.17 – 0.29) had the high degree of the peakedness. Viet Nam was the most stable country, less affected by the coefficient of Skewness and Kurtosis.
Figure 2. Student performance in mathematics in ASEAN countries (Source: based on the PISA 2012 data)
(二) The differences between the mathematics performance and gender in ASEAN countries' students
In five countries of ASEAN, Viet Nam (five plausible values from PV1MATH to PV5MATH have pi = .000), Thailand (five plausible values
from PV1MATH to PV5MATH have pi = .000), and Malaysia (five plausible values from PV1MATH to PV5MATH have respectively pi = .001, .001, .004, .002, .001) show that there are statistically significant differences between male and female of student performance in mathematics (Table 3). 511 376 422 569 441 350 400 450 500 550 600
Viet Nam Indonesia Malaysia Singapore Thailand
The student performance in
mathematics
Particularly for case of Indonesia (four plausible values PV2MATH, PV3MATH, PV4MATH, and PV5MATH have pi = .027, .035, .012, and .036 respectively) and Singapore (three plausible values PV2MATH, = .037, .020, and .024 respectively) can’t conclude that there were statistically
significant differences between male and female student performance in mathematics. So to determine whether there are statistically significant differences between male and female student performance in mathematics in Indonesia and Singapore, we will conduct further analysis at the bottom.
Table 3. Results of the Means, Standard Deviations, Mean Differences, and the Independent Samples t-Test of Differences of Male and Female of mathematics performance in ASEAN countries’ students
Gender N Mean SD Mean
Difference t p Country = Indonesia PV1MATH Female 2860 374.41 69.31 1.30 -1.80 .072 Male 2762 377.79 71.49 1.36 PV2MATH Female 2860 373.28 68.88 1.29 -2.21 .027* Male 2762 377.42 71.46 1.36 PV3MATH Female 2860 373.64 68.74 1.29 -2.11 .035* Male 2762 377.57 71.13 1.35 PV4MATH Female 2860 372.92 68.27 1.28 -2.52 .012* Male 2762 377.61 71.42 1.36 PV5MATH Female 2860 374.01 68.50 1.28 -2.09 .036* Male 2762 377.91 71.21 1.35 Country = Malaysia PV1MATH Female 2745 426.39 79.38 1.52 3.41 .0007*** Male 2452 418.76 82.11 1.66 PV2MATH Female 2745 425.57 79.03 1.51 3.25 .0012** Male 2452 418.30 82.42 1.66 PV3MATH Female 2745 424.96 78.74 1.50 2.91 .004** Male 2452 418.46 82.18 1.66 PV4MATH Female 2745 424.69 77.84 1.49 3.05 .002** Male 2452 417.86 83.50 1.69 Female 2745 425.03 78.97 1.51 3.31 .00095*** Male 2452 417.64 82.28 1.66
Gender N Mean SD Mean Difference t p Country = Singapore PV1MATH Female 2752 571.04 99.17 1.89 1.89 .059 Male 2794 565.72 109.86 2.08 PV2MATH Female 2752 571.64 99.21 1.89 2.08 .037* Male 2794 565.80 109.49 2.07 PV3MATH Female 2752 571.38 99.04 1.89 1.90 .058 Male 2794 566.03 110.43 2.09 PV4MATH Female 2752 572.10 98.82 1.88 2.33 .020* Male 2794 565.58 108.94 2.06 PV5MATH Female 2752 571.39 99.50 1.90 2.26 .024* Male 2794 565.02 110.02 2.08 Country = Thailand PV1MATH Female 3736 447.52 89.95 1.47 6.46 .000*** Male 2870 432.85 93.66 1.75 PV2MATH Female 3736 448.11 90.86 1.49 6.63 .000*** Male 2870 432.97 93.34 1.74 PV3MATH Female 3736 447.24 90.63 1.48 6.11 .000*** Male 2870 433.31 93.55 1.75 PV4MATH Female 3736 448.15 91.07 1.49 6.38 .000*** Male 2870 433.54 93.09 1.74 PV5MATH Female 3736 447.40 90.63 1.48 6.03 .000*** Male 2870 433.62 93.91 1.75
Country = Viet Nam
PV1MATH Female 2648 506.16 79.62 1.55 -4.00 .000*** Male 2311 515.66 87.53 1.82 PV2MATH Female 2648 506.08 80.71 1.57 -4.33 .000*** Male 2311 516.40 86.90 1.81 PV3MATH Female 2648 506.30 81.35 1.58 -3.83 .000*** Male 2311 515.52 88.12 1.83 PV4MATH Female 2648 505.75 80.55 1.57 -4.33 .000*** Male 2311 516.17 88.94 1.85 PV5MATH Female 2648 506.07 81.28 1.58 -4.36 .000*** Male 2311 516.52 87.45 1.82 Note. *ρ<.05, ** ρ<.01, ***<.001, two-tailed, N = 27930
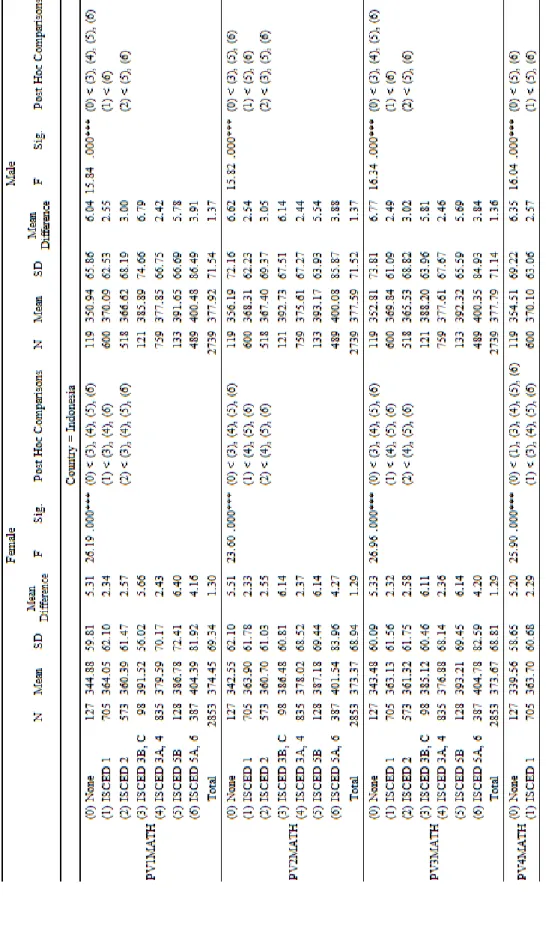
Table 4. Results of the Means, Standard Deviations, Mean Differences, and the ANOVA of Differences of Male and Female among Groups of Highest educational level of parents in ASEAN
(三) The differences of mathematics performance, between gender and parent's academic level in ASEAN countries' students
The results obtained from the preliminary analysis of the Means, Standard Deviations, Mean Differences, and the ANOVA of Differences of Male and Female among Groups of Highest educational level of parents in ASEAN countries’ students can be compared in Table 4.
In Vietnam, it is interesting to note that both male and female of the ISCED 2 group give significantly higher student performance in mathematics than the not received training and ISCED 1 groups. Moreover, both male and female of the ISCED 3 or more groups give dramatically higher student performance in mathematics than the ISCED 2 group.
In Indonesia, the male of the ISCED 5B or more groups gives significantly higher student performance in mathematics than the remaining groups, while the female of the ISCED 3B, 3C or more groups give
considerably higher. Also, four groups (not received training, ISCED 1, ISCED 2, and ISCED 5B) have higher mathematics performance of male than female.
In Malaysia, the male students of the ISCED 5B or more groups gives significantly higher student performance in mathematics than the remaining groups, while the female students of the ISCED 3A, 4 or more groups give considerably higher.
In Singapore, both male and female students of the ISCED 5B or more groups give significantly higher performance in mathematics than the remaining groups. Besides, four groups (not received training, ISCED 2, ISCED 5B, and ISCED 5A, 6) have higher mathematics performance of female than male.
In Thailand, the male of the ISCED 5A, 6 group gives significantly higher student performance in mathematics than the remaining groups, while the female of the ISCED 3B, 3C or more groups give considerably higher.
Table 5. Differences of Male and Female among Groups of Highest educational level of parents in ASEAN countries’ students
五、 CONCLUSIONS
The important finding of this paper was the gender and the parent's academic level create the significant differences in the mathematics performance of Vietnamese and Southeast Asian countries' students in PISA 2012, as follows:
First, Singapore and Viet Nam have the highest scores in mathematics, above the average of Southeast Asian countries performers in mathematics.
Second, all five countries have faced the gender gap in mathematics scores. Boys perform better than girls in mathematics in Viet Nam and Indonesia, but girls outperform boys in Thailand, Malaysia, and Singapore. In Viet Nam and Indonesia, the anxiety and self-efficacy may contribute significantly towards explaining
variation in math achievement. Therefore, we will give more evidence in the subsequent studies.
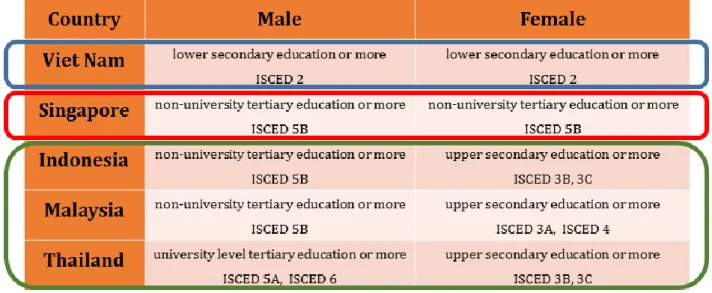
Finally, both five countries have significant difference between parents' academic achievement and mathematics scores. In Indonesia, Malaysia, and Thailand: Parents, whose boys are good at mathematics than other boys, have a non-university level tertiary education or more. Also, girls, whose parents just have an upper secondary education or more, are good at mathematics than other girls. Children, whose parents have a non-university level tertiary educations or more, are better than other students in Singapore. Parents who have a lower secondary education or more, their children are better than the others in Viet Nam.
REFERENCE
Akinloye, J. (2005). A study of
the effects of student-made
manipulatives, behavior, ethnicity and gender on low-income students' mathematics
performancemanipulatives, behavior, ethnicity and gender on low-income students' mathematics performance.
ProQuest Dissertations Publishing, 3251881
Coben, D. (2003). Adult
numeracy: review of research and related literature. http://www.
wellpractitioners. Retrieved from com.au/wp-content/uploads/2013/06/ Coben-Adult-Numeracy.pdf
Hackett, G & Betz, E. (1989). An Exploration of the Mathematics Self-Efficacy/Mathematics
Performance Correspondence.
Journal for Research in Mathematics Education, 20(3), 261-273.
Lloyd, V; Walsh, J. & Manizheh, Y. (2005). Sex Differences in
Performance Attributions,
Self-Efficacy, and Achievement in Mathematics: If I'm So Smart, Why Don't I Know It?. Canadian Journal
of Education, 28(3), 384-408.
Matsui, T. (1990). Mechanisms Underlying Math Self-Efficacy Learning of College Students.
Journal of Vocational Behavior, 37(2), 225-238.
Organization for Economic Co-operation and Development. (1999). Classifying Educational
Programmes: Manual for ISCED-97 Implementation in OECD Countries.
Retrieved from
http://www.oecd.org/education/skills-beyond-school/1962350.pdf
Organization for Economic Co-operation and Development. (2003). The PISA 2003 assessment
framework: Mathematics, reading, science and problem solving
knowledge and skills. Retrieved from
https://www.oecd.org/edu/school/pro grammeforinternationalstudent assessment pisa/35188570.pdf Organization for Economic Co-operation and Development. (2013). PISA 2012 Results: What
Students Know and Can Do - Student Performance in Mathematics,
Reading and Science (Volume I).
Retrieved from
https://www.oecd.org/pisa/keyfinding s/pisa-2012-results-volume-I.pdf
Organization for Economic Co-operation and Development. (2014). PISA 2012 Technical Report. Retrieved from
https://www.oecd.org/pisa/pisaproduc ts/PISA-2012-technical-report-final.p df
Solange, G. (2013). Factors
affecting the performance of students in university remedial mathematics courses. ProQuest Dissertations