奈米生物感測粒子用於細胞內氧化壓力
即時偵測之發展及研究
Development of Intracellular Nanobiosensor for
Oxidative Stress Detection
研 究 生:杜靜如 Student:Jing-Ru Tu
指導教授:袁俊傑 博士 Advisor:Dr. Chiun-Jye Yuan
國 立 交 通 大 學
生 物 科 技 系 所
碩 士 論 文
A Thesis
Submitted to Institute of Biological Science and Technology National Chiao Tung University
In Partial Fulfillment of the Requirements for the Degree of
Master In
Biological Science and Technology September 2009
Hsinchu, Taiwan, Republic of China
Development of intracellular nanobiosensor for oxidative stress detection
Student: Jing-Ru Tu Advisor: Dr. Chiun-Jye Yuan
Department of Biological Science and TechnologyNational Chiao Tung University
Abstract
Balance between oxidants and antioxidants is important to maintain
normal cellular functions. Although the most oxidative events are carefully
monitored and controlled by the natural defense systems of cells, sustained
perturbation of this balance may result in oxidative stress. Oxidative
stress-induced damages are usually key factors for aging and many disorders
in human cell. In this study, a ratiometric optical PEBBLE (probes
encapsulated by biologically localized embedding) nanosensor, which
encapsulates catalase and two fluorescent dyes, Ru(II)-tris(4,7-diphenyl-1,10-
phenanthroline) chloride ([Ru(dpp)
3]
2+) and Oregon Green 488-dextran was
developed by sol-gel technology for the detection oxidative stress in vivo. The
developed ratiometric optical PEBBLE nanosensor is spherical with an
average size of 200±50 nm. The catalase encapsulated in the nanosensor is
around 8U/mg nanoparticle. Catalase in nanosensor converts H
2O
2to oxygen
that quenches the fluorescence of [Ru(dpp)
3]
2+; whereas, the fluorescence of
Oregon Green 488-dextran is unaffected, acting as a reference for ratiometric
intensity measurement. The developed optical nanosensor exhibits potential
for the real-time detection of oxidative stress in living cells.
奈米生物感測粒子用於細胞內氧化壓力即時偵測之發展及研究
學生: 杜靜如 指導教授: 袁俊傑 博士 國立交通大學生物科技研究所碩士班 中文摘要 要維持生物細胞功能正常運作,細胞中的氧化劑及抗氧化劑的平衡作用是不可或 缺的。一般來說,在自然的情況下,細胞會有相對應的防禦機制將氧化劑還原並維持 體內氧化鈦平衡。當細胞因為自然因素或是外在因素致使細胞內產生額外的氧化劑, 且防禦機制無法平衡時,過多的氧化劑與細胞中的各物質發生交互作用並造成氧化傷 害,即氧化壓力(oxidative stress);關於氧化壓力及其所造城的傷害在近年來已經 被證實與老化與多種疾病有關。在本文中,提出以光學比率測量原理為基礎的奈米生 物感測粒子[PEBBLE (probes encapsulated by biologically localized embedding) nanosensor]。粒子中含有過氧化還原酵素-catalase (EC 1.11.1.6)以及兩種螢光 染劑-Ru(II)-tris(4,7-diphenyl-1,10-phenanthroline) chloride ([Ru(dpp)3]2+) 和 Oregon Green 488-dextran。並使用 sol-gel 技術將上述物質包覆於例子中以用 於偵測體內過氧化氫濃度。此光學比率測量奈米生物感測粒子粒子為圓球體,平均尺 寸約為 200±50nm,並具有約 8U/mg 的 catalase 活性。Catalase 可以將細胞中造成氧化壓力的過氧化氫還原生成氧氣。同時,粒子中的[Ru(dpp)3]2+的螢光訊號會因為氧
氣的存在而產生 quenching,造成螢光強度的改變;而相反的 Oregon Green
488-dextran 之螢光訊號則不受氧氣濃度影響,可作為測量的基準值,與[Ru(dpp)3]2+
誌 謝
本篇論文能夠完成,學生首先要感謝袁俊傑老師的辛苦指導。在研究上,老師 總是能夠指引我明確的大方向,同時不厭其煩的與我討論實驗上遇到的問題以及各項 數據所表現的意義,與學生一起設計實驗、面對問題並且解決問題。在生活上,老師 也總是時時關心我們,時時為我們設想。 實驗室就如同一個大家庭,有辛苦,也有歡笑。在這兩年間,感謝何威震學長 願意與我分享他的知識與實驗經驗,教導我各項實驗技巧、引領我設計每一個實驗步 驟,更時常關切我的實驗進度,和我一起與老師討論每一個實驗環節。感謝林佳穎學 姐教導我細胞培養的技術,對於原本是化學系畢業的我是一個非常珍貴的經驗。感謝 邱奕榮學長、吳弘毅學長、趙俊炫學長以及黃佩琴學姐,在我有任何問題時都能夠和 善的給予我答案與指導。感謝我的同學:王中亮、姜君怡、王義宇、張恒毅、賴昆鉦 給予我課業、實驗及各項生活上的幫助。 同時,我要感謝默默支持我的家人們。正因為家在新竹,正因為就讀於交通大 學,在研究所修業期間我不用感受離家求學的辛勞。感謝你們對我的關心,感謝你們 容忍我的壞脾氣,你們永遠是我前進的助力。 最後我在此再向老師、實驗室的大家、我的家人以及所有幫助過我的人獻上最 真摯的感謝。Index of Content
Abstract... 1 中文摘要... 2 誌 謝... 3 1. Introduction ... 6 1.1. Oxidative stress ... 6 1.2. Properties of ROS... 7 1.3. Sources of ROS ... 8 1.4. Influences of ROS ... 111.5. Methods of intracellular detection for oxidative stress ... 12
1.5.1. Lipid peroxidation assay... 14
1.5.2. Fluorescence probes used for intracellular detection of ROS ... 14
1.5.3. Electron paramagnetic resonance (EPR) probes used for intracellular ROS detection... 16
1.6. Applications of nanotechnology in biological researches ... 16
1.6.1. Synthesis of nanoparticles by sol-gel process ... 17
1.6.2. Entrapment of enzyme in silica sol-gel ... 20
1.6.3. Probes encapsulated by biologically localized embedding (PEBBLEs ) .. 21
2. Objective... 24
3. Material and methods ... 26
3.1. Materials ... 26
3.2. Preparation of enzyme entrapped sol-gel PEBBLEs... 27
3.3. Activity assay of HRP and HRP-entrapped particles ... 28
3.4. Activity assay of catalase and catalase-entrapped PEBBLEs ... 29
3.5. Scanning Electron Microscope (SEM) Imaging... 31
3.6. Fluorescent spectroscopy spectrum of PEBBLEs and fluorescent calibration... 31
3.7. Cell culture ... 32
3.8. Cell viability test... 32
3.9. Cell images ... 33
4. Results and discussion... 34
4.1. PEBBLEs formation... 34
4.2. HRP entrapment in silica-PEG particle ... 36
4.5. Particle morphology ... 42
4.6. Cell uptake and cytotoxicity of PEBBLEs ... 43
5. Conclusion... 45
Table 1. The reported PEBBLEs sensors... 46
Table 2. Conditions for the synthesis of PEBBLEs... 47
Figure 1. SEM images of Silica and Silica-PEG particles ... 48
Figure 2. SEM images of Silica-PEG-HRP particles ... 49
Figure 3. SEM images of Silica-PEG-bCAT particles ... 50
Figure 4. SEM images of bCAT-Ru/488-PEBBLEs particles ... 51
Figure 5. Catalase calibration curve ... 52
Figure 6. SEM images of Silica-PEG-cgCAT (from Corynebacterium glutamicum) particles... 53
Figure 7. Fluorescence emission spectrum of bCAT-Ru/488-PEBBLEs ... 54
Figure 8. Fluorescence spectrum of cgCAT/BSA-Ru/488-PEBBLE v.s. [H2O2]... 55
Figure 9. Fluorescence emission spectrum cgCAT/BSA-Ru/488-PEBBLEs... 56
Figure 10. SEM images of cgCAT/BSA-RU/488-PEBBLEs... 57
Figure 11. Fluorescent microscopy images of HeLa cell incubated with cgCAT/BSA-Ru/488-PEBBLEs ... 58
1. Introduction
1.1. Oxidative stress
Living in oxygenated environment, the balance between oxidants and antioxidants is important to maintain normal cell functions. As a consequence of aerobic metabolism, oxidants are constantly formed in organisms. These oxidants are usually oxygen molecules containing one or more unpaired electrons, which are called reactive oxygen species (ROS). ROS occur endogenously and exogenously by metal-catalyzed enzyme reactions,
neutrophils and macrophages during inflammation and the leakage of mitochondrial electron transport reactions [1]. While ROS are generated, the cellular natural defense system will act in concert to detoxify oxidants. The overall oxidant level is strictly
regulated by sophisticated enzymatic and non-enzymatic systems, including catalase (CAT), superoxide dismutase (SOD), glutathione peroxidase (GPx) and vitamins A, C and E, to maintain the physiological homeostasis.
However, the intrinsic balance between oxidants and anti-oxidants can be influenced by many environmental stresses. For example, oxidants can be generated during irradiation of UV light, X-rays, and γ- rays. Toxins and drugs can also elevate the oxidants in cells. Under these conditions, the level of oxidants quickly elevates and exceeds that of antioxidant, rising up the oxidative level within cells. The highly active oxidants would easily react with many biomolecules, such as proteins, nucleic acids and lipids, to give
oxidative damages.
Oxidative stress is generally defined as a disturbance in the oxidant-antioxidant balance, resulting in potential oxidative damages [3]. The presence of ROS can be an indicator of oxidative stress. Studies in last decades have found that oxidative stress resulting damages are accumulative [2]. Accumulation of oxidative damages to DNA, to proteins and to lipids in cells are closely correlated with aging, aging related diseases, cardiovascular diseases, neurodegenerative disorders and cancers [4-5]. Besides, ROS also act as specific signaling molecules under both pathophysiological and physiological conditions with certain boundaries [2].
1.2. Properties of ROS
Free radicals can be defined as molecules or molecular fragments containing one or more unpaired electrons in atomic or molecular orbitals. The unpaired electrons usually give a considerable degree of reactivity to the free radicals [6-7]. ROS are radical derivatives of oxygen and the most prominent free radicals in biological systems. ROS encompass a wide variety of oxygen-containing free radicals including superoxide anion (O2-•), hydrogen peroxide (H2O2), singlet oxygen (1O2), hydroxyl radical (•OH), and
peroxyl radical (ROO•). Although H2O2 is not a free radical, it may easily break down into
harmful hydroxyl radical (•OH) with the presence of metal ions. Most ROS are extremely unstable, short-lived, and charged, causing great damages to the sites where they are
produced. In contrast, hydrogen peroxide is rather stable, long-lived and uncharged thus diffusible between membranes [2] to give random damages within the cell.
1.3. Sources of ROS
ROS can be produced from both endogenous and exogenous substances (Figure 1). Mitochondria, cytochrome P450, and peroxisomes are potential endogenous sources in inflammatory cells for ROS generation [1].
Figure.1. Endogenous ROS sources and main defense mechanisms [9].
In aerobic cells, the mitochondrial electron transport chain is one of essential sources for ROS [8]. The electron transport chain in the mitochondrial inner membrane plays an important role in the generation of ATP. During the process of oxidative phosphorylation, electrons from electron donors, e.g., NADH and FADH2, pass along the electron transport
of H2O. However, a portion of electrons may leak from electron transport chain and forms
superoxide anions (O2-•) by interacting with dissolved dioxygen. Under physiological
conditions, superoxides are constantly produced from both Complexes I (NADH dehydrogenase) and III (ubiquinone–cytochrome c reductase) of the electron transport chain [7].
Evidence indicates that around 1–2% dioxygen molecules are converted into
superoxide anions (O2-•) instead of contributing to the reduction of oxygen to water [1-2,
6-8]. The generated superoxide anions (O2-•) are then consumed by Mn-superoxide
dismutase (MnSOD) to produce hydrogen peroxide [9]. Compare to the strong negative charged superoxide anions (O2-•), hydrogen peroxide is permitted to diffuse through
mitochondrial membranes. Once hydrogen peroxide meets transition metal ions, such iron, cupper and cobalt ions, in the environment, hydroxyl radical (•OH) quickly forms due to Fenton reaction (Eq. 1) [1,10].
Mn+ + H
2O2 → M(n+1) + •OH + OH− ( M = Cu2+, Fe2+, Ti4+, Co3+) (Eq. 1)
Under the stress, an excess of superoxide induces the release of iron ions from iron-containing proteins, such as [4Fe–4S] cluster containing enzymes of the
dehydratase-lyase family [7]. The released Fe2+ then triggers the conversion of hydrogen peroxide to the highly reactive hydroxyl radical (•OH) by Fenton reaction [1, 6]. Reactive hydroxyl radicals are also generated by Haber-Weiss reaction (Eq. 2). in the presence of
superoxide and hydrogen peroxide. In this reaction, Fe3+ is reduced by superoxide to yield Fe2+ and oxygen (Fe3+ + O2-•→Fe2+ + O2) [1, 7]. The hydroxyl radical (•OH) is highly
reactive with a half-life in aqueous solution of less than 1 ns. Thus when produced in vivo it reacts close to its site of formation.
O2-• + H2O2 → O2 + •OH + OH− (Eq. 2)
The phase I cytochrome P-450 is the terminal component of the monoxygenase
system found within the endoplasmatic reticulum (ER) of most mammalian cells. The main role of cytochrome P-450 is to convert foreign toxic compounds into less toxic products in the presence of dioxygen [11]. This enzyme also participates in removing or inactivating xenobiotic compounds by hydroxylation. In addition, monoocygenase is also involved in steroidogenesis. During the oxidation and hydroxylation reactions electrons may ‘leak’ into surrounding environment, in which they may be uptaken by dioxygen molecules and form superoxide radicals (O2-•) [6].
Microsomes and peroxisomes are also the sources of ROS. Microsomes are responsible for the 80% H2O2 produced in tissues with hyperoxia [6]. Peroxisomes are
known to produce H2O2, but not O2-•under physiologic conditions [6]. Peroxisomal
Oxidation of fatty acids in peroxisomes was recognized as one of potentially sources for H2O2 production after prolonged starvation [1, 6-7]. Although peroxisome is ubiquitously
peroxisomes. Neutrophils generate and release superoxide radical (O2-•) by nicotine
adenine dinucleotide phosphate (NAD(P)H) oxidase to induce the destruction of bacteria. On the other hand, the nonphagocytic NAD(P)H oxidases produce superoxide at a level only 1–10% to that produced in neutrophiles. Superoxide radicals are thought to play a role in the intracellular signaling pathways [7].
1.4. Influences of ROS
It has been estimated that one human cell is exposed to approximately 105 oxidative hits a day from hydroxyl radicals and other such species [6]. Although all types of bio-molecules may be attacked by free radicals, lipid is probably the most sensitive one. Cell membranes are rich sources of polyunsaturated fatty acids, which are readily attacked by ROS. Lipid peroxidation involves very destructive chain reactions that cause damage on the structure of membrane directly or the damage of other cell components indirectly by producing reactive aldehydes. Lipid peroxidation has been implicated to be involved in a wide range of tissue injures and diseases, such as atherosclerosis [4].
Random oxidative damages of proteins may not give very destructive consequences to cell function unless the damages are very extensive and/or accumulative. Proteins may be damaged by the transition metal ion that binds at their specific site(s). The reaction between transition metal ion and hydrogen peroxide generates harmful hydroxyl radical (•OH) that further causes oxidative damages of proteins [4].
ROS can attack bases or deoxyribose of DNA to produce damaged bases or strand break. Alternatively, the intermediates generated from the oxidation of lipid or protein molecules by oxygen radicals may react with DNA to form adducts. Attempt to replicate this damaged DNA sequence leads to mutation and/or apoptosis [12]. Permanent
modification of genetic material resulting from these oxidative damages represents the first step of carcinogenesis.
Several lines of evidence suggest that oxidative stress-induced damages are
indiscriminate and accumulative. Damages accumulated in DNAs, proteins and lipids are potential keys for the development of aging and age-related diseases, such as cancers, vascular diseases [13], arthritis and neurodegenerative diseases. Oxidative stress is also found to be responsible for dysfunction or death of neuronal cells that contributes to the pathogenesis of several diseases [18], such as amyotrophic lateral sclerosis [14],
Parkinson’s disease [15] and Alzheimer’s disease [16-17].
1.5. Methods of intracellular detection for oxidative stress
Oxidative stress and its bringing effects are thought to be playing an essential role in the pathogenesis of many diseases and disorders. ROS was shown to be the indicator of oxidative stress. Thus, the detection of concentration and distribution of ROS in cell is important to understand the relation between oxidative damage and cell responses.
and high reactivity to almost all substances. For example, the half life of hydroxyl radical (•OH), is about 1 ns. Conventionally, the detection of ROS relies on the measurement of products or intermediates of free radical oxidative reactions, which are also transitory in nature [4]. Common ways to detect ROS in cells including lipid peroxidation assays, image analysis based on ROS-specific fluorescence dyes and electron spin resonance (ESR).
A suitable detection method for ROS is necessary to allow scientist to elucidate the role of certain types of free radicals in oxidative stress. Oxidation reactions could be a wide-ranged and prolonged process due to the characteristics of oxidative damages are usually random and accumulative. Therefore, real-time monitoring ROS in cell may help to elucidate the true role of oxidative stress. Several criteria are required for the development of sensors for the detection of ROS, including fast detection, high sensitivity, good
reproducibility and miniaturization [19]. The detection of ROS has to be fast in order to follow actual changes, in particular the interplay with other reactive species. Rather low concentrations have to be analyzed since the range under physiological conditions covers the nano- and micromolar concentration level. The sensor configuration should be stable under repeated radical bursts in order to be reusable several times. The effect of
miniaturization of the sensor elements for the spatially resolved detection and high selectivity of the sensor signal for the reactive species is under investigation.
1.5.1. Lipid peroxidation assay
Lipid peroxidation is one of the most widely used indicators of oxidant/free radical formation in vitro and in vivo. Potent oxidants, such as hydroxyl radical, peroxyl radicals, nitrogen dioxide, and higher oxidation states of heme and hemoproteins (ferryl heme), are capable of initiating peroxidation of polyunsaturated fatty acids. The appearance of oxidative stress can be determined by detecting of the lipid oxidation product,
F2-isoprostanes (IsoP). Detection of oxidative stress by lipid peroxidation assay exhibits
many advantages, including low interferences, noninvasiveness and proportional to radicals [20-21]. However, low sensitivity, low reliability and required other quantitative method for the quantification of oxidized lipids are the major drawbacks of this approach. Moreover, this approach reflects oxidative stress condition indirectly without knowing the level of ROS in cells [20].
1.5.2. Fluorescence probes used for intracellular detection of ROS
Fluorescence dye is commonly used in the measurement of ROS because of its high sensitivity, simplicity in data collection, and high spatial resolution in conjugating with microscopic imaging techniques [21]. Some fluorescent probes have been developed for the detection of ROS, such as dichlorodihydrofluorescein and its numerous derivatives. Dichlorodihydrofluorescein (2′,7′-dichlorodihydrofluorescein diacetate
fluorescence dye for hydrogen peroxide and hydroxyl radical [21-22]. When DCFHDA passively enters cells, the cellular esterases cleaves DCFHDA into
2′,7′-dichlorodihydrofluorescein (DCFH2).Generated DCFH2 can beoxidized by
peroxidases, cytochrome c and Fe2 + to form 2′,7′-dichlorofluorescein (DCF, λexcitation=498
nm; λemission=522 nm) in the presence of hydrogen peroxide. The generated DCF is then
accumulated and trapped in cells. A flow cytometer can de used to detect the fluorescence signal of DFC, which is proportional to the concentration of hydrogen peroxide in cells.
However, it has been found that some DCFHDAs are quite sensitive to ambient O2
levels, and tends to be oxidized by illumination light alone. In addition to hydrogen peroxide, DCFH2 can also be oxidized by a variety of ROS andRNS (reactive nitrogen
species, that contain nitrogen with one or more unpaired electrons), causing a noise during the detection. Moreover, high degree of cellular leakage of fluorescence dyes remains common to all of the fluorescein-derived dyes, which brings difficulties to long-term monitoring of ROS [23]. At present, fluorescent probes based on boronate are the only contrast agents that can detect hydrogen peroxide with high specificity at physiologic concentrations. However, their potential for in vivo imaging is limited because of low tissue penetrating ability [24].
1.5.3. Electron paramagnetic resonance (EPR) probes used for intracellular ROS detection
Electron spin resonance (ESR) spectroscopy, also known as electron paramagnetic resonance (EPR), is at present the only analytic approach that permits the direct detection of free radicals. This technique provides information about the magnetic properties of unpaired electrons and their molecular environment by detecting energy differences between unpaired electrons at different spin states under an applied magnetic field [20]. A “spin-trap” is used to stabilize the free radicals, which is very short-lived and unstable, during the detection. The spin trapping reagent reacts with highly reactive radicals to
produce relatively longer-lived carbon adduct than that of the primary reactive free radicals. The stable radical adducts are detectable by their characteristic features in EPR spectra [25].
With spin trapping reagent, ESR spectroscopy is capable of detecting the unstable free radical-derived species produced during oxidative and inflammatory injury. However, the spin-trapping reagent is lack of specificity and the secondary adduct might be metabolized by tissue though time. In addition, the cost of ESR is high, making this technique less attractive than other detection methods for the in vivo determination of free radicals [20].
1.6. Applications of nanotechnology in biological researches
mainstream of physical sciences and engineering from 1980s [26]. With the capability of controlling matters within nano-scale (<10-9 m), nanotechnology has been applied to manufacture materials and devices in a variety of applications, including medicine, electronics, cellular imaging and clinical diagnosis. While living cells and organisms are formed with various biological molecules of nano-scale, the application of nanotechnology in the researches of life science and biomedicine is inevitable [27].
Recently, various nanodevices (e.g., nanoparticles, nanotubes, and nanowires) were developed and employed in the biological and biomedical researches. The dimension of the fabricated nanodevies can be controlled by predictable manufacture method [28].
Nowadays, nanoparticles have been widely used in development and delivery of imaging contrast agents, anti-cancer drugs, enzymes and diagnosis probes in animal model [29, 31-33]. Nanoparticles can be fabricated by various materials, such as metal oxides (e.g., iron oxide, silica oxide and titanium oxide), carbon nanostructure, gold and silica. Among these materials, silica nanoparticles have been widely used for chemical mechanical polishing and as additives to drugs, cosmetics, printer toners, varnishes, and food [30].
1.6.1. Synthesis of nanoparticles by sol-gel process
The fabrication of nanoparticles sol-gel technology involves the concept of
polycondensation, which gives three-dimension network-like matrix with pores (10~1000 nm in size) within the structure. Thus porous sol-gel is ideal for doping with biomolecules.
The flexible process also allows the product to be tailored in size, shape and porosity by controlling reaction condition. In addition, the silica particle is optical transportable, high purity and chemically inert, thus makes it an ideal material to biological applications.
The history of sol-gel science could be trace to about 40 years ago. Stöber and coworkers [34] reported a sol-gel process that hydrolyzes TEOS in the presence of basic catalyst and produce powders with controlled morphology and size [35]. Sols are
dispersions of colloidal particles in a liquid where colloids are solid particles with diameters of 1-100 nm. A gel is an interconnected, rigid network with pores of submicrometer dimensions and polymeric chains [35]. Therefore, a sol-gel process includes gel formation from colloid particles in sol.
A typical sol-gel process involves 4 steps: (i) hydrolysis, (ii) condensation (iii) gelation (iv) aging. At the hydrolysis step, a silica alkoxide precursor, commonly use tetraethoxysilane (TEOS) and tetramethoxysilane (TMOS), is added to a mixture of ethanol containing base or acid (such as aqueous ammonium hydroxide or hydrogen chloride) as hydrolyzing catalyst. The precursor is then hydrolyzed into hydroxy derivatives (e.g., silicicacids, hydroxometallates and hydroxysilanes) [36] (Eq. 3).
Si(OR)4 + nH2O → (HO)n-Si(OR)4-n + nROH R= C2H5 or CH3 (Eq. 3)
Hydrolysis condition greatly affects the hydrolysis rate of silica alkoxide precursor. With acidic electrophilic mechanism, the stronger acid uses in the hydrolysis, the faster
hydrolysis rate occurs. The hydrolysis can also be catalyzed by basic neuclophilic mechanism. However, the hydrolysis rate is no only influenced by the concentration of base but also the steric effect of the alkoxyl group of silica alkoxide precursor.
Once hydroxyl derivatives formed, the condensation reaction between two hydroxyl groups of hydrosylated silica occurs and forms Si-O-Si linkage (siloxane bond). As the reaction goes further, a polycondensation occurs to form an extensive linkage between hydroxyl groups of hydrolyzed hydrosylated tetrahedral silica (Eq. 4 and Eq. 5) [35].
(HO)n-Si(OR)4-n + (HO)n-Si(OR)4-n
→ [(HO)n-1(OR)4-n -Si-O-Si-(OR)4-n (HO)n-1] + H2O (Eq. 4)
Polycondensation:
(Eq. 5)
Polycondensation reaction eventually leads to gelation (Eq. 5), causing the formation of a three-dimensional cross-linked polymer. The size and structure (e.g. density or
porosity) of the silica particles are dominated by R ratio, a ration of [H2O] to [Si(OR)4], pH
value and reaction rate in the early steps. During the polymerization, trapping small molecules into the porous of the silica particles is possible.
Aging of a gel is a time-dependent process, in which condensation remains for a period of time (hours to days) [37]. It further strengthens the structure of sol-gel matrix. Finally, the drying process removes the liquid in the space of sol-gel matrix. When liquid is removed under the hypercritical condition (critical point drying), the highly porous aerogel can be obtained. Drying the gel by thermal evaporation leads to pore-collapse and bulk shrinkage. Under this condition, the product becomes xerogel, which is poor in porosity, but high in hardness. In addition, the process can also be tailored to form different kinds of product such as thin film, rod, particle and electrode coating.
1.6.2. Entrapment of enzyme in silica sol-gel
The development of sol–gel derived biomaterials start in the 1990, Braun and
coworkers successfully entrapped enzyme in sol-gel matrix [38]. Ever since, lots of works have described the entrapment of a wide variety of biological species, including enzymes, antibodies, regulatory proteins, membrane-bound proteins and nucleic acids [39]. Several studies have demonstrated that the entrapped enzymes are still functional for the
applications of kinetic study, biological analysis and biocatalyzation [32, 38-39]]. An ideal enzyme entrapping matrix should retain enzymes tightly inside a
mechanically stable, chemically inert hydrophilic porous matrix. The silica sol-gel derived matrix exhibits an unparalleled optical property, which is ideal for optical signal detection
physical durability that can protect enzymes from denaturation by environmental factors, such as pH and temperature. The modification of silica sol-gel is easy through flexible sol-gel process by adding polymerizable or nonpolymerizable organic substituents to form an organic/inorganic hyubid material (Ormosils). In addition, the pore size and pore distribution of silica sol-gel are tuneable that allows analytes diffuse into and product diffuse out of the matrix easily without disturbing the entrapped enzymes [32, 36, 39].
A general enzyme sol-gel entrapping process involves hydrolysis and
polycondensation stages as described previously. The sol-gel precursors (e.g. silica alkoxides) are hydrolyzed, at least partially, in the mixture to form aqueous sol. At this stage, additives, such as organic polymers, protein stabilizers, drying control additives, templating agents, redox species or fillers that modify silica matrix, can be added and mixed with the precursor in the presence of catalyst, either acid or base [39]. Subsequently, the polycondensation reaction occurs to form cross-linked silicate structure to entrap protein molecules. The gelation is then performed for a period to time based on the requirement of applications. Finally, water and ethanol are removed by drying under the 4°C to obtain the enzyme-encapsulated silica sol-gel.
1.6.3. Probes encapsulated by biologically localized embedding (PEBBLEs )
The intracellular detection becomes more and more important for the understanding of biological functions and cellular responses. Therefore, developing a suitable nano-scaled
intracellular probe seems necessary to fulfill these tasks. The probes should be narrowed down in scale and non-toxic in order to offer an intracellular detection with least physical or chemical disturbances to cell. Therefore, measurement of chemical and physical parameters with negligible physical disturbance and high spatial resolution becomes an important issue of the intracellular environment measurement [40].
Development of bionanotechnology opens a new horizon for the detection of specific chemical species within cells directly. In 1998, Clark and co-works [41] described a stand-alone nano-sphere optical sensor, which is consisting of several key components necessary for the intracellular detection. The sensor, know as PEBBLEs (probe
encapsulated by biologically localized embedding), was reported to be capable of detecting some chemical changes occurred in cells. The concept of PEBBLE was demonstrated to be feasible for the fabrication of optical nanosensors for intracellular detection (Table 1).
A typical PEBBLEs is now give a clear definition as an optical nano-sensor (20-200 nm), which encapsulates an analyte-specific dye (indicator dye) and a reference dye within a biologically inert matrix. Polyacrylamide, polydecylmethacrylate (PDMA), metal oxide, and organically modified silicates (Ormosils) are known matrices to be used in the
fabrication PEBBLEs. The confinement of the indicator dyes enables the differentiation of nano-optode locations from those of auto fluorescence centers in cell and also makes the simultaneous observation of analytes possible [42]. The small size and inert characteristic
of PEBBLEs provide a distinct sensing mechanism for intracellular environment and can possibly avoid the chemical interference and cytotoxicity to cell [43]. Furthermore, PEBBLE optical nanosensors offer several advantages over conventional ways for real-time detection of intracellular substances, including proventing loading dye from degrading, protecting intracellular environment from toxic dyes, easy detection and quantification [49]. Compare to loading free dyes into cell, the inert matrix of PEBBLEs protects the intracellular environment from potentially toxic effects of the sensing dyes. The matrix can also protect the sensing dyes from potential interferences from the cellular components, such as non-specific binding proteins and organelles. PEBBLE is small in size, giving negligible physical perturbation to cell. Nanosensors have not being reported to be selective sequestrated into cellular compartments, leak from cell or even be pumped out of cells. Finally, PEBBLE provides a ratiometric measurement by the embedded multiple dyes.
2. Objective
Accumulating oxidative damages caused by oxidative stress is harmful to cells. Since ROS are responsible of oxidative injuries of oxidative stress, a real-time detection of ROS distribution and concentration change is essential to understand how cell responses against oxidative stress. Among various ROS, hydrogen peroxide is an uncharged molecule with a relatively lower reactivity and longer life time than other free radicals. These
characteristics allow hydrogen peroxide to diffuse through membranes in cell and bring oxidative damages all over the cell.
In order to detect the generation of hydrogen peroxide real-time, we designed a sol-gel glass-based PEBBLE to detect intracellular hydrogen peroxide. The PEBBLE will encapsulate a catalase (EC 1.11.1.6) and two fluorescent dyes by sol-gel process. Oregon Green 488-dextran® (FITC derivatives and connected with dextran) and
Ru(II)-tris(4,7-diphenyl-1,10-phenanthroline) chloride ([Ru(dpp)3]2+), two fluorescent dyes,
are chosen to be entrapped in the PEBBLE. While catalase specifically consume H2O2 to
produce oxygen, resulting in a fluorescent quenching effect on the oxygen-sensitive dye, [Ru(dpp)3]2+. The other fluorescence dye, Oregon Green 488-dextran® is an
oxygen-insensitive dye, will give an unaffected fluorescence emission signal as reference [46, 47]. A ratiometric measurement can be made by collecting the signal of [Ru(dpp)3]2+
The detection principle is summarized in the schematic diagram bellow.
Catalase reduces H2O2 in the environment and forms Oxygen.
( Catalase + 2H2O2 → 2H2O + O2 )
The emission signal of entrpped [Ru(dpp)3]2+ quenches ( result in intensity decrease)
by the out coming oxygen.
Comparing quenched signal with Oregon Green 488-dextran® (stable emission, oxygen insensitive) to get detection message.
Reference dye: 488-dextran Indicator dye: [Ru(dpp)3]2+ Cell H2O2 Exciting Light source Catalase 488-dextran: Reference emission [Ru(dpp)3]2+: indicator emission Quenching O2 Intracellular detection of H2O2
3. Material and methods
3.1. Materials
Catalase (EC 1.11.1.6, from bovine liver, lyophilized powder, 2000-5000 units/mg protein; bCAT), horseradish peroxidase (HRP type VI, EC1.11.1.7, lyophilized powder, 275 units/mg solid), tetraethyl orthosilicate (TEOS, reagent grade, 98%), bovine serum albumin (BSA, lyophilized powder), MTT (3-(4-5-Dimethylthiazol-2-yl)-2,5-
diphenyltetrazolium bromide) and 2,2'-azino-bis (3-ethylbenzthiazoline-6-sulphonic acid) (ABTS) were purchased from Sigma-Aldrich. Polyethylene glycol 6000 (PEG, MW 6000), ammonium hydroxide (28%) and hydrogen peroxide (H2O2, 30%) were obtained from
SHOWA. Catalase (EC 1.11.1.6, from Corynebacterium glutamicum, solution, ~500000 U/mL; cgCAT) and indicator fluorescent dye, Ru(II)-tris(4,7-diphenyl-1,10-
phenanthroline) chloride ([Ru(dpp)3]2+, were purchased from Fluka. The
oxygen-insensitive dye, Oregon Green 488-Dextran® (MW 10000) was purchased from Molecular Probe. Ethanol (95%) is obtained from TTL, Taiwan. In addition, water used to prepare solutions was autoclaved double distilled water. DMEM (Dulbecco modified Eagle's minimal essential medium), FBS (fetal bovine serum), penicillin, and streptomycin were purchased from GIBCO Life Technology.
3.2. Preparation of enzyme entrapped sol-gel PEBBLEs
The hydrogen peroxide sensitive PEBBLEs, bCAT-Ru/488-PEBBLE and cgCAT-Ru/488-PEBBLE, that contain fluorescent dyes, [Ru(dpp)3]2+, Oregon Green
488-Dextran® and catalase were prepared as described previously with modification [46]. Briefly, 2.5g poly(ethylene glycol) (PEG, MW 6000 monomethyl ether) was first dissolved in a mixture containing 6 mL ethanol (95%), 25μL Oregon Green 488-dextran (MW 10 000) (stock 0.1 mM in H2O), 200μL [Ru(dpp)3]2+ (stock 0.4 mM in 95% ethanol), and 4.2
mL 28 wt % ammonia water for 30 minutes or until the solution became transparent and viscous. Ammonia is served as a catalyst, while water acts as one of the reactants.
The enzyme stock solution was prepared separately by dissolving enzyme in double distilled water (ddH2O). The specific activity of HRP was determined as described in
Section 3.3 and diluted to 1000 units /mL solution. Various amounts (0.1, 0.08, 0.05, 0.03
and 0.01 g) of catalase from bovine liver (powder, 2000-5000 units/g) were dissolved in 1 mL water to obtained the stock solutions. Whereas, the catalase stock solution from
Corynebacterium glutamicum (~500000 Units/mL buffered solution containing ~30%
glycerol and 10% ethanol) was prepared by diluting 10 μL, 30 μL or 50 μL original enzyme solution in water containing 2.5 mg BSA to give a final volume of 1 mL. The enzyme stock solution (1 mL each) was mixed with 0.5 mL TEOS to make an
stock solution that was prepared previously by micropipette to initiate the hydrolysis and condensation reaction. About 1/3 of enzyme/TEOS sol was added at a time. The stirring continued for at least 1 h to allow the gelation to proceed thoroughly. To prevent
fluorescent dye from photobleaching, the reaction is performed in the dark.
The whole solution was then transferred to enppendorf tubes and centrifuged at 13,000 rpm for 9 min. The supernatant was discarded to remove the unreacted monomers, such as PEG, ammonia, and dye molecules. The pelleted PEBBLEs were washed by
suspending in the autoclaved PBS buffer and centrifuged at 13,000 rpm for 3 min. Remove and discard supernatant carefully after centrifugation. Repeat washing process at least three times. Finally, PEBBLEs was stored in PBS buffer under 4˚C. The control nanoparticles were also produced by the same process without enzymes and dyes.
3.3. Activity assay of HRP and HRP-entrapped particles
Activity of HRP and HRP-entrapped particles was performed with a conventional peroxidase assay by using ABTS and hydrogen peroxide as subtracts [50]. A standard 1 mL activity assay solution contains ?? units HRP, 0.5 mM ABTS (ammonium salt) (Boehringer Mannheim) and 3 mM H2O2 in 100 mM sodium acetate buffer (pH of 5.5) . ABTS is
oxidized by HRP in the presence of H2O2 to form an oxidized form, which exhibits an
absorbance with time in the presence of oxidized ABTS. The extinction coefficient of oxidized ABTS (εABTS) at 405 nm is 36.8 mM-1 cm-1 (at 25˚C, pH 5.5) for following
calculations. One unit HRP is defined as oxidizing 1 μmole of ABTS within one min. at 25 ˚C and pH 5.5.
Particles were sonicated for 10 minutes in PBS buffer to prevent aggregation before activity assay. The activity of HRP-entrapped silica nanoparticle was then measured by using the same assay process as that of free HRP. The background absorption of
HRP-entrapped silica nanoparticle was subtracted from the total absorption. There is no obvious background absorption when the particles used is in the range of 0.01-0.1 mg.
3.4. Activity assay of catalase and catalase-entrapped PEBBLEs
Catalase activity was determined by recording absorbance change at 240 nm of 10 mM hydrogen peroxide in 50 mM potassium phosphate buffer (pH 7.0) on a UV-Vis spectrometer (HITACHI U- 3010). The total volume of reaction mixture is 1 mL. The detecting principle was based on the conversion of hydrogen peroxide and generating H2O
and O2. Thus, one unit of catalase is defined as decomposing 1 μmole H2O2 per minute at
pH 7.0 and 25°C. The molar absorption coefficient for H2O2 (εH2O2) is 39.4 M-1 cm-1.
The catalase entrapped-PEBBLEs were sonicated for 10 min. in PBS to prevent aggregation prior to activity assay. The activity of catalase entrapped-PEBBLEs was determined as the same assay process as that of free catalase. Catalase
entrapped-PEBBLEs at low concentration give stable absorbance background at 240 nm. Background absorbance is determined by adding catalase entrapped-PEBBLEs into potassium phosphate buffer as reference before catalase activity assay. However, when catalase entrapped-PEBBLE activity is low, longer incubation is needed to obtain a
significant change in the absorbance of H2O2. Therefore, a calibration curve was conducted
by using a catalase/HRP coupled enzyme assay system to avoid the existence of high background due to the addition of large amount of catalase entrapped-PEBBLE particles.
Catalase was diluted by PBS buffer in a concentration of 3.5, 4, 4.5 and 6 units in 10 μL. Each assay solution contained 50 mM potassium phosphate buffer and 10 mM H2O2
with a final volume of 1 mL. The reaction mixture was allowed to stand at room temperature for 30 min. An obvious oxygen bubbles can be observed in tube during reaction. After incubation, the remaining H2O2 in the tube was further detected by a HRP
assay. A portion of the above catalase reaction solution (100 μL) was added to HRP assay solution (100 mM sodium acetate buffer, pH 5, containing 0.5 mM ABTS and 10 units of HRP) with final volume of 1mL. The assay mixture was allowed to stand at room
temperature for 5 min. The absorbance of oxidized ABTS was determined on a UV–Vis spectrophotometer (HITACHI U-3010) at 405 nm. Each catalase activity point was repeated for at lease three times. PEBBLEs exhibit no obvious background in following HRP assay at 405 nm.
3.5. Scanning Electron Microscope (SEM) Imaging
PEBBLEs were dispersed in water and sonicated for 20 min. to prevent aggregation. Place 2 μL of the PEBBLE suspension on the small piece of silica wafer and dried
gradually in an anti-humidity cabinet. The sample was then sputter coated with platinum (12V, 90 sec.), and the SEM images were taken on the Thermal Field Emission Scanning Electron Microscope (JEOL, JSM-6500F).
3.6. Fluorescent spectroscopy spectrum of PEBBLEs and fluorescent calibration
PEBBLEs (10 mg) were dispersed in 1 mL water and sonicated for 20 min. to prevent aggregation. In each 10 mg PEBBLEs/H2O suspension solution 1 mL of various
concentrations of hydrogen peroxide was added to make the final concentrations of 0.1, 0.5, 1, 5, 10 and 20 mM. The final volume of reaction mixture is 2 mL. The mixture was then mixed thoroughly in a 3-mL cuvette and incubated at room temperature for 3 minute, followed by wave scanning fluorescence detection on the HITACHI F-4500 with exciting wavelength of 488 nm. The emission scanning range was between 500 and 750 nm. The obtained emission intensity (ransom light units; RLU) of [Ru(dpp)3]2+ at 607 nm was
normalized with the emission intensity units of Oregon Green 488-Dextran at 524 nm. The normalized value from control was defined as 100%.
3.7. Cell culture
The human cervical carcinoma cell line (HeLa) was maintained in DMEM (Dulbecco modified Eagle's minimal essential medium) containing 10% FBS, 100 units/mL penicillin, and 100 μg/mL streptomycin (GIBCO Life Technology). Cells were incubated in a
humidified 37˚C incubation chamber containing 5% CO2. Cells were subcultured for every
2-3 days.
3.8. Cell viability test
Cell viability was measured by the MTT (3-(4-5-Dimethylthiazol-2-yl)-2,5
-diphenyltetrazolium bromide) assay. HeLa cells were seeded on 24-well culture plates with 2×10⁴ cells in 500 μL culture medium per well and put in humidified 37˚C incubation chamber for 24 hour prior to assay. Afterward, each well was treated with 100 μg, 200 μg, 300 μg and 400 μg of the sonicated catalase-entrapped PEBBLEs and control (silica-PEG only) particles in PBS for 24 and 48 h. At the end of incubation, cultural medium was removed and cells were washed once with pre-wormed PBS, followed by incubating with 500 μL MTT solution (0.5 mM in culture medium) in a 37 ˚C incubation chamber
containing 5% CO2 for 3 h.
The produced blue-purple formazan in each well was solubilized with 600 μL acidic isopropanol (0.1 N HCl in absolute isopropanol). The absorbance soluble formazan was
viability of the treated group was expressed as the percentage of control group (added no PEBBLEs but PBS buffer only) which was assumed to be 100%.
3.9. Cell images
The location of the PEBBLEs in HeLa cells was monitored using an inverted fluorescence microscope. The HeLa cells (4×10⁵ cells/well) were cultured in a 6-well cultural dish with a sterilized cover glass with in 2 mL culture medium and put in humidified 37˚C incubation chamber for 24 h. Each well is then incubated with the PEBBLEs in PBS. After incubation at 37˚C for 24 h, cells were fixed with 4%
paraformaldehyde in pH 7.4 PBS at room temperature for 20 min, followed by PBS wash for 4 times and monitoring under the inverted fluorescent microscope (Leica DMIL model).
4. Results and discussion
4.1. PEBBLEs formation
Silica is well known for its advantages in biological-friendly chemical properties, optical clarity, porosity and controllable sol-gel fabricated process. These advantages make silica as a potential matrix for biological applications. However, such material can be brittle, may undergo cracking owing to hydration stresses, and, in some cases, can block the accessibility of analytes to the entrapped biomolecules [39]. Silica particles derived from conventional Stöber method usually have the size in micrometer scale due to aggregations between colloid particles during condensation stage in sol-gel process. Additionally, drying process may also cause irreversible aggregation of silica particles and forms precipitation by inter-particle hydrogen bonding. An improvement in the preparation of silica nanoparticle was reported by Xu and colleagues [46] by adding the organic
additive, polyethylene glycol (PEG MW 6000), in the TEOS precursor to modify the chemical and physical properties silica nanoparticles (e.g., size and morphology) [51].
Polyethylene glycol (PEG , , H(OCH2CH2)nOH) is a biocompatible
linear polymer with low toxicity. It is also biodegradable. The hydroxyl group at the two end of the structure would participate in condensation reaction between silica alkoxide precursor and PEG during the sol-gel process (Eq. 6).
≣Si-OC2H5 + H(OCH2CH2)nOH
→ ≣Si-O-CH2(CH2-O-CH2)nCH2O-Si≣ + C2H5OH (Eq. 6)
PEG was demonstrated to be anchored on the surface of the silica particles by covalent bonds (Si-O bond) between the silica alkoxide precursor ((HO)n-Si(OR)4-n) and
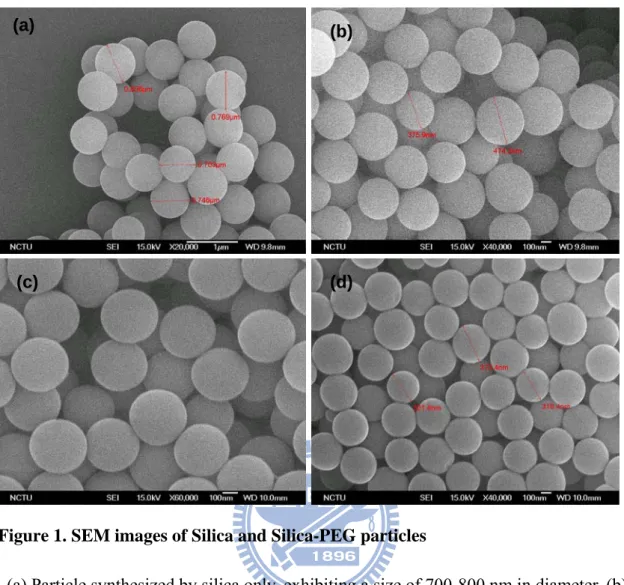
PEG [46, 51-53]. Possibly, the PEG chain may extend from the surface of particles into the solution. Thus, in a solution, the aggregation among the nanoparticles can be prevented by the repulsion force and solvation layer of the PEG surface moiety [52]. In addition, PEG also exhibit an effect on the formation of silica nanoparticles of colloidal size during condensation through the formation of both covalent bonds with silicon alkoxide and hydrogen bonds with residual silanol groups in the structure silica nanoparticle [54]. This postulation was demonstrated by the observation under the thermal field emission scanning electron microscopy (SEM) (Fig.1a,and 1b) The silica nanoparticles coated with PEG exhibited smaller size (400-500 nm in diameter) than that of silica nanoparticles without coating (700-800 nm in diameter). Both types of nanoparticles are smooth and
spherical-shaped. This result indicates that PEG modification do not alter the morphology of nanoparticles.
PEG coating also affects the behavior of silica nanoparticle in aqueous solution. The generated PEG-coated PEBBLEs took a shorter time (around 10 min.) to be resuspended in a buffer by sonication than that of silica nanoparticles without PGE coating. It took around
30 min. to allow silica nanoparticles to be resuspended in a buffer by sonication. Therefore, PEG coating on the surface of the silica nanoparticles acts as a steric stabilizer to prevent silica nanoparticles from forming aggregates by hydrogen bonds.
4.2. HRP entrapment in silica-PEG particle
Two enzymes, HRP (EC1.11.1.7) and catalase (EC 1.11.1.6), were used as models to study protein entrapment in PEBBLEs for H2O2 detection. HRP is a widely used enzyme in
biological applications because of its small size (~44 kDa), high temperature resistance and less expensive. Furthermore, the activity of HRP is well defined and easily to be
determined. For decades, ABTS was used as a common chromogen for HRP to quantify hydrogen peroxide. This assay protocol allows us to easily determine the initial rates in the enzymatic reaction by a spectrometer. Recent study also demonstrated that HRP using ABTS as substrate can be readily applied for the determination of the activity of enzyme encapsulated in silica glass matrix [56].
The specific activity of HRP-entrapped in silica particle coated with PEG
(silica-PEG-HRP NP) was summarized in Table 2. The activity of silica-PEG-HRP NP was 0.3 units/mg particles with a diameter of about 500 nm in diameter. This result shows that HRP is able to be entrapped in the nanoparticles and retain all or part of its original activity. However, the morphology of silica-PEG-HRP NP was irregular and the size was also
adsorption to the precursor during sol-gel process could be the reason.
4.3. Catalase entrapment in PEBBLEs particle
Catalase is a tetrameric heme-containing enzyme with a molecular of around 240 kDa. It is largely but not exclusively, localized in peroxisomes, where many H2O2-producing
enzymes reside in. As a protective mechanism for oxidative stress, catalase exhibits a extremely high turnover numbers for H2O2, allowing a quick removal of H2O2 to avoid its
diffusion to other parts of the cell. Interestingly, catalase degrades H2O2 without
consuming cellular reducing equivalents, providing cells with an energy efficient
mechanism to remove H2O2. It has been proposed that catalase may play an essential role
in regulating the homeostasis of H2O2 in cells. In practical, catalase was used widely for
removing H2O2 in manufactured food and other industrial usage.
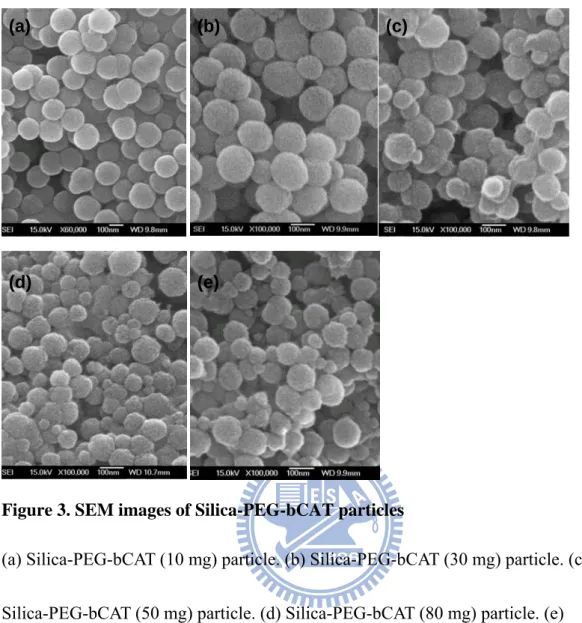
In this study, different amount of catalase was mixed with TEOS/PEG sol to study the encapsulating efficiency of the adapted sol-gel process. The activity of encapsulated catalase in silica nanoparticles in each preparation was summarized in Table 2. As shown in Figure 3, increasing amount of catalase leads to obvious particle aggregation and
amorphous morphology with a smaller particle size than that of without catalase. When the TEOS/PEG sol contains 10, 30, 50, 80, or 100 mg catalase in the synthesized silica-PEG particles exhibited a size of 150±10, 130±50, 100±50, 80±50, and 70±50 nm (size
This result indicates that the size of generated nanoparticles reduced aroung 100-300 nm in the presence of catalase compared to the particles without protein entrapped. Based on the effect of catalase on the size of fabricated silica-PEG nanoparticles, we chose a reaction mixture containing TEOS/PEG and 50 mg catalase for the fabrication of catalase-entrapped PEBBLEs.
The catalase-entrapped PEBBLE containing two fluorescence dye, [Ru(dpp)3]2+ and
Oregon Green 488-Dextran®, (bCAT-Ru/488-PEBBLE) for intracellular hydrogen peroxide detection was prepared. [Ru(dpp)3]2+ and Oregon Green 488-Dextran® were mixed with
PEG prior to the addition of TEOS/(50 mg) catalase (bovine liver) sol. The specific activity of bCAT-Ru/488-PEBBLE was assay and determined. The resulting activity was 0.03 units/mg particles. The reduction of catalase activity probably due to protein denature by the strong base (e.g., NH4OH in sol-gel process) and ethanol in the reaction. To overcome
these problems, a thermal stable and pH insensitive catalase may be needed.
Catalase from Corynebacterium glutamicum (C. Glutamicum.) was reported to exhibit a better thermal and pH resistance than that from bovine liver [57-58]. Thus catalase from
C. Glutamicum was then used to prepare catalase-entrapped silica/PEG nanoparticles. In a
total reacting mixture, different amounts of catalase form C. Glutamicum was added into TEOS/PEG sol for the fabrication of catalase-entrapped silica/PEG nanoparticles. As shown in Figure 6, the obtained nanoparticles are less aggregate and exhibits a spherical
morphology with an average size within 400 nm. The specific activity of
catalase-entrapped silica/PEG nanoparticles was 20~138 units/mg nanoparticles dependent on the amount of catalase used in the sol-gel process (Table 2). In addition, the catalase from C.Glutamicum was kept in a buffered solution with 30% glycerol, which might help to stabilize catralsae under the basic condition [59].
4.4. Fluorescence calibration of sol-gel PEBBLEs
Organic fluorescent ruthenium complex, [Ru(dpp)3]2+, a luminescence dyes, is used as
an indicator dye in many applications and is readily quenched by oxygen [28]. It exhibits many characteristics, such as photostable, long excited-state life time (5.3 μs), high luminescence quantum yield (~30%) and long life time, The reference dye, Oregon Green 488-Dextran®, was normally used in neuronal tracing. It is a stable FITC derivative, giving a strong emission peak at 524 nm. The covalent-bonded dextran molecule formed a large backbone which could be greatly trapped within the particle matrix. The hydroxyl groups on the dextran may also participate in condensation reaction to give more rigid interaction of the particle. In the sol-gel process, the well dispersed, hydrophobic organic ruthenium complex dye and Oregon Green 488-Dextran® could be trapped in the porous oxide gel matrix when gelation occurs, the dye molecules are, forming an organic–inorganic
nanomaterial [60]. It has been indicated that two dyes exhibited an excellent stability inside the sol-gel matrix [46]. No leakage of dyes was observed in the developed
catalase-entrapped PEBBLE, i.e., bCAT-Ru/488-PEBBLE, suggesting that even small size dyes could not diffuse through the porous structure into the surrounding environment. PEG coat in the catalase-entrapped PEBBLE may act as an organic shell to prevent leakage of dyes from inner core.
The fluorescence emission calibration curve of bCAT-Ru/488-PEBBLE was shown in Figure 7. Two distinct emission peaks at 607nm ([Ru(dpp)3]2+) and 524nm (Oregon Green
488-Dextran®) were observed. Unless mentioned, the catalase encapsulated in the
PEBBLE is from bovine liver. However, the emission peak of Oregon Green 488-Dextran® (524 nm) is relatively weak compared to the peak of [Ru(dpp)3]2+ at 607 nm. The reason
for this reason is unknown. Interestingly, when adding various concentrations of H2O2 into
the bCAT-Ru/488-PEBBLE suspension solution the fluorescent peak at 607 nm quenched in a dose-dependent manner; whereas, the fluorescent peak at 524 nm was almost
unchanged (Figure 7). This result suggests that the developed bCAT-Ru/488-PEBBLE is capable of responding to H2O2 and providing an appropriate signal.
The fluorescent spectrum of the cgCAT-Ru/488-PEBBLE with catalase from
C.Glutamicum was also studied (Figure 8). However, the encapsulated Oregon Green
488-Dextran® exhibited a extremely strong fluorescent emission at 524 nm. In comparison, the emission peak at 607 nm is relatively weak, indicating that two dyes were not
different commercial resources the affect the encapsulation efficiency of two dyes in the TEOS/PEG nanoparticles. Therefore, an extra protein (e.g., BSA) was added along with catalase in the TEOS sol during the preparation of cgCAT/BSA-Ru/488-PEBBLE. Figure 8 showed that when BSA was added, the intensity of Oregon Green 488-Dextran®
fluorescent peak decreased; while the fluorescent peak of [Ru(dpp)3]2+ increased. When 10
mg BSA along with catalase was added in the preparation mixture during sol-gel process the fluorescent response of Oregon Green 488-Dextran® was almost disappeared. This result suggests that the encapsulation of Oregon Green 488-Dextran® in silica/PEG matrix may be interfered with BSA. In contrast, BSA may facilitate the entrapment of
[Ru(dpp)3]2+ dye. It is postulated that [Ru(dpp)3]2+ dye may be absorbed on the surface of
proteins via charge interactions (positively charged of [Ru(dpp)3]2+). In this study, the
cgCAT/BSA-Ru/488-PEBBLE was fabricated by adding a TEOS sol containing 30 μL catalase from C.Glutamicum and 2.5 mg BSA into the PEG/ethanol/ammonium solution containing both Ru(dpp)3]2+ and Oregon Green 488-Dextran® fluorescent dyes for
subsequent condensation and gelation reactions.
The fluorescent calibration curve of cgCAT/BSA-Ru/488-PEBBLE was performed by adding various concentrations of H2O2 (0~10 mM). As showed in Figure 9, the quenching
of the fluorescent peak of [Ru(dpp)3]2+ at 607nm, was inversely proportion to the
cgCAT/BSA-Ru/488-PEBBLE is capable of responding to H2O2 and providing an
appropriate signal.
4.5. Particle morphology
The morphology of silica nanoparticles may be changed by the entrapping molecules that added during the sol-gel reaction as observed in SEM images (Figures 1-4, 6, 10). The Reaction compositions are summarized in Table 2. The presence of PEG may reduce the size of the generated particles (Figure 1b). This is similar to the effect of Oregon Green 488-Dextran® (Figure 1d). On the other hand, when [Ru(dpp)3]2+ or proteins (e.g., catalase
and HRP) was added, morphology and the size of particles were unchanged (Figures 1c, 2, and 3). These results suggest that substances sue in sol-gel reaction, including acidic/basic and charged residues, may influence the mechanism and rates of alkoxysilane hydrolysis and condensation. Any molecule with charge or polarity may form electrostatic,
hydrophobic, and/or H-bonding between molecules and silica alkoxides, resulting in interfacial templates that control the formation of developing polysilicate/polysiloxane colloids to generate branching pattern, functionality, growth, topology, and aggregation [61].
Therefore, when enzyme is added into the process and disperses in the solvent. Enzyme may adsorb onto the silica surface in a variety of orientations, associate with
within a nanocomposite material, or even aggregate if the protein is present at a high enough concentration [39].
4.6. Cell uptake and cytotoxicity of PEBBLEs
The cgCAT/BSA-Ru/488-PEBBLEs particles were incubated with HeLa cell for a day and then uptake rate was discussed through fluorescent microscope images (Figures 11a-c). As the green fluorescence of the Oregon Green 488-Dextran® (524nm) showed in Figure 11b, indicated that the fluorescence signal of the cgCAT/BSA-Ru/488-PEBBLEs is successfully entrapped in the silica-PEG matrix and ready to be detected by fluorescent microscope. The comparison is also made by using silica-PEG particle (Figure 11d-f), since there was no fluorescence signals, the fluorescence signal were contributed by the Oregon Green 488-Dextran® (524nm) is confirmed.
The uptake and distribution of the PEBBLEs particles were observed by the overlaid image of Figure11a and 11b in 11c. The particles are occurred in the overlapping region of the cell, and the background was very clean with no particles. Since wash process was repeated for 4 times, it indicated that the particles were located inside the cell and the particles were able to enter the cell through an endocytosis process.
Meanwhile, the cell viability test by MTT assay was also under processing. 2x10⁴ HeLa cell in 24-well plate was treated with 200-1000μg/mL silica-PEG particles and cgCAT/BSA-Ru/488-PEBBLEs respectively for 48h. Preliminary results show that 80%
cell viability of cgCAT/BSA-Ru/488-PEBBLEs and 40% of silica-PEG particles under 600μg/mL. This result indicated that toxicity would not come from fluorescence dyes and proteins within particles.
Since cgCAT/BSA-Ru/488-PEBBLEs and silica-PEG particles are different in size (200-300nm for cgCAT/BSA-Ru/488-PEBBLEs and 400-500nm for silica-PEG particles) and morphology (both spherical in shape but roughed surface for
cgCAT/BSA-Ru/488-PEBBLEs comparing to silica-PEG particles) result in different surface area. A report of silica-based nanoparticle toxicology in 2009 indicted that the toxicity of silica nanoparticle is strongly depends on the particle size, concentration and metabolic activity of the cells [62].
On the other hand, cgCAT/BSA-Ru/488-PEBBLEs contain catalase, BSA and fluorescence dyes within particle matrix which may brings structural and functional discrepancies. The presence of catalase reduces hydrogen peroxides as an oxidative stress defender while giving detection in cell.
5. Conclusion
In this work, a nano-sized particle with silica matrix coated with PEG was fabricated. The particles were synthesized using a modified Stöber method incorporating PEG
monomethyl work as a steric stabilizer to reduce aggregation between the particles while narrow down particle diameter. The particle is also entrapped catalase, [Ru(dpp)3]2+ and
Oregon Green 488-dextran with retaining enzyme activity. The combination of the catalase and dyes enabled a ratiometric fluorescent determination of hydrogen peroxide in vitro. We also find that the amount of protein in sol-gel compositions are closely concerned with the particle morphology and entrapping rate to fluorescence dyes.
Continued investigations in the future will focus on in vitro measurement. The cell uptake rate by endocytosis and cytotoxicity will be study next. Meanwhile, further improve the detecting limit is also important to let the CAT-PEBBLEs to be able to give real-time hydrogen peroxide detection within physiological concentration (from μM to mM).
In summary, we report details the preparation of enzyme-entrapped PEBBLE nanosensors and their characterization.The same fabrication method can be applied to produce photodynamic nanoplatforms for various applications.
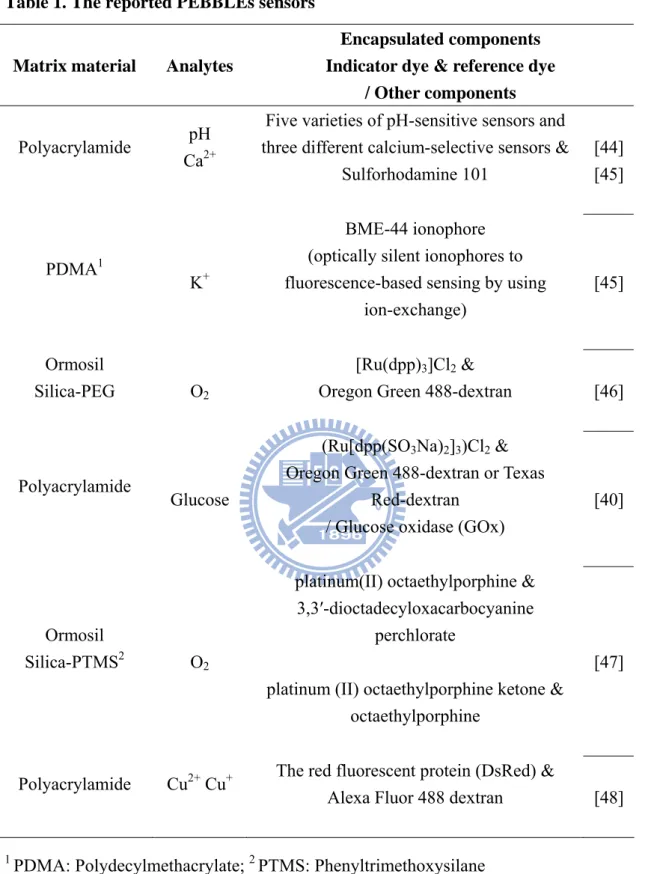
Table 1. The reported PEBBLEs sensors
Matrix material Analytes
Encapsulated components Indicator dye & reference dye
/ Other components
Polyacrylamide pH Ca2+
Five varieties of pH-sensitive sensors and three different calcium-selective sensors &
Sulforhodamine 101 [44] [45] PDMA1 K+ BME-44 ionophore (optically silent ionophores to fluorescence-based sensing by using
ion-exchange)
[45]
Ormosil
Silica-PEG O2
[Ru(dpp)3]Cl2 &
Oregon Green 488-dextran [46]
Polyacrylamide
Glucose
(Ru[dpp(SO3Na)2]3)Cl2 &
Oregon Green 488-dextran or Texas Red-dextran
/ Glucose oxidase (GOx)
[40]
Ormosil
Silica-PTMS2 O2
platinum(II) octaethylporphine & 3,3′-dioctadecyloxacarbocyanine
perchlorate
platinum (II) octaethylporphine ketone & octaethylporphine
[47]
Polyacrylamide Cu2+ Cu+ The red fluorescent protein (DsRed) &
Alexa Fluor 488 dextran [48]
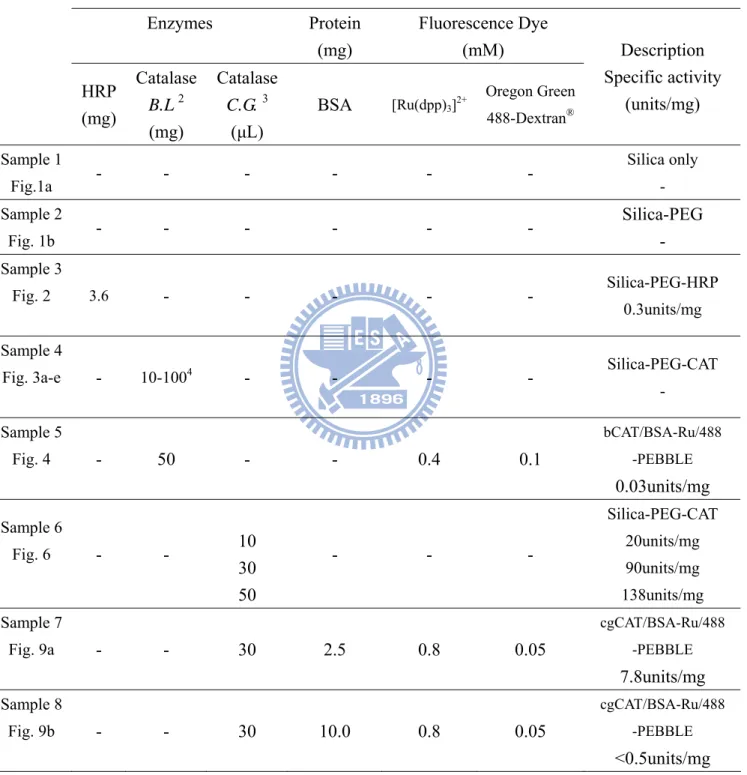
Table 2. Conditions for the synthesis of PEBBLEs
Reaction Composition
Containing EtOH 50%, NH4OH 10%, TEOS 4%, H2O 36% and PEG 6000 2.5g1 for each reaction.
Enzymes Protein (mg) Fluorescence Dye (mM) HRP (mg) Catalase B.L 2 (mg) Catalase C.G. 3 (μL) BSA [Ru(dpp)3]2+ Oregon Green 488-Dextran® Description Specific activity (units/mg) Sample 1 Fig.1a - - - - - - Silica only - Sample 2 Fig. 1b - - - - - - Silica-PEG - Sample 3 Fig. 2 3.6 - - - - - Silica-PEG-HRP 0.3units/mg Sample 4
Fig. 3a-e - 10-1004 - - - - Silica-PEG-CAT
- Sample 5 Fig. 4 - 50 - - 0.4 0.1 bCAT/BSA-Ru/488 -PEBBLE 0.03units/mg Sample 6 Fig. 6 - - 10 30 50 - - - Silica-PEG-CAT 20units/mg 90units/mg 138units/mg Sample 7 Fig. 9a - - 30 2.5 0.8 0.05 cgCAT/BSA-Ru/488 -PEBBLE 7.8units/mg Sample 8 Fig. 9b - - 30 10.0 0.8 0.05 cgCAT/BSA-Ru/488 -PEBBLE <0.5units/mg
1 PEG 6000 was not contained in sample 1
2 Catalase from Bovine Liver, powder, 2950units/mg
3 Catalase from Corynebacterium glutamicum, solution, 1500units/μL
Figure 1. SEM images of Silica and Silica-PEG particles
(a) Particle synthesized by silica only, exhibiting a size of 700-800 nm in diameter. (b) Particles generated by silica-PEG exhibit a size distribution of 400-500 nm in diameter. (c) Silica-PEG-[Ru(dpp)3]2+ particles exhibit a size of 700-800 nm in diameter. (d)
Silica-PEG-Oregon Green 488-Dextran® particles exhibit a size of 300-400 nm in diameter.
(b) (a)
(d) (c)
Figure 2. SEM images of Silica-PEG-HRP particles
HRP was used as an enzyme model to fabricate enzyme-entrapped particles. As the image shows, the morphology of Silica-PEG-HRP was irregular and the diameter was also diverse from 200 to 500 nm in diameter. Some agglomerate could also be found in the SEM images. Particle was calibrated by the activity assay and the specific activity was 0.3 units/mg particles. This result revealed that the method was enabling to trap enzyme within.
Figure 3. SEM images of Silica-PEG-bCAT particles
(a) Silica-PEG-bCAT (10 mg) particle. (b) Silica-PEG-bCAT (30 mg) particle. (c) Silica-PEG-bCAT (50 mg) particle. (d) Silica-PEG-bCAT (80 mg) particle. (e)
Silica-PEG-bCAT (100 mg) particle. As the SEM images show, adding proteins (Catalase from bovine liver) into the reaction shows smaller particle size accompany with
morphology changes. When catalase amount increased from 10 mg to 100 mg in the reaction, the particles became irregular and aggregated.
(a) (b) (c)
Figure 4. SEM images of bCAT-Ru/488-PEBBLEs particles
The generated of bCAT-Ru/488-PEBBLEs exhibited a size in a range of 100-200 nm with a specific activity of 0.03 units/mg particles
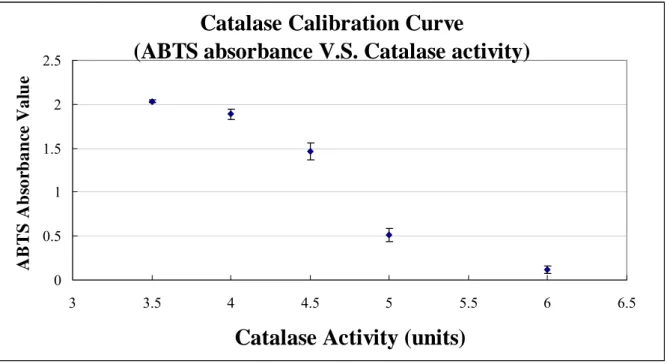
Catalase Calibration Curve
(ABTS absorbance V.S. Catalase activity)
0 0.5 1 1.5 2 2.5 3 3.5 4 4.5 5 5.5 6 6.5
Catalase Activity (units)
ABTS Ab so rb a n ce Va lu e
Figure 5. Catalase calibration curve
Catalase-HRP coupled enzyme assay was carried out to determine the activity of
bCAT-Ru/488-PEBBLE. Since PEBBLEs raises no obvious background in oxidized ABTS solution at 405 nm, this calibration curve is suitable for activity test of
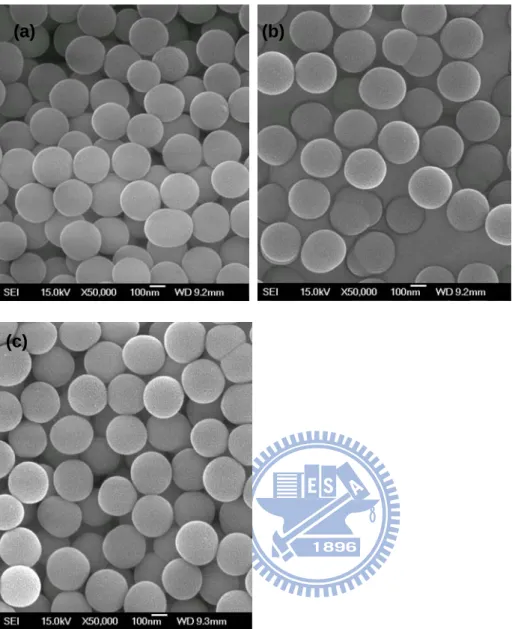
Figure 6. SEM images of Silica-PEG-cgCAT (from Corynebacterium glutamicum) particles
(a) Silica-PEG-cgCAT (10 μL) exhibits a particle size of 300-400 nm with a specific activity of 20 units/mg (b) Silica-PEG-cgCAT (30μL) exhibits a particle size of 300-400 nm with a specific activity of 90 units/mg (c) Silica-PEG-cgCAT (50μL) exhibits a particle size of 300-400 nm with a specific activity of 138units/mg. Particles are fabricated by adding different volume of Catalase from Corynebacterium glutamicum (solution, 1500units/μL) and fluorescence dyes. Reaction composition was summarized in Table 2.
(a) (b)
Figure 7. Fluorescence emission spectrum of bCAT-Ru/488-PEBBLEs
The quenching effect of H2O2 on the fluorescent peak at 607 nm ([Ru(dpp)3]2+) indicated
that the particle was ready to be used for the detection of hydrogen peroxide.
0.019g particle V.S. H
2O
2concentration (10min.)
0 200 400 600 800 1000 1200 1400 510 560 610 660 710 Wavelength (nm) Intensi ty reference 20mM 40mM 60mM 80mM
0 1000 2000 3000 4000 5000 6000 7000 8000 9000 510 530 550 570 590 610 630 650 670 690 710 730 750 Wavelength (nm) In te ns ity Silica-PEG-Ru/488 particle cgCAT(30uL)-Ru/488-PEBBLEs cgCAT (50uL)-Ru/488-PEBBLEs cgCAT(30uL)/BSA(2.5mg)-Ru/488-PEBBLEs cgCAT(30uL)/BSA(10mg)-Ru/488-PEBBLEs
Figure 8. Fluorescence spectrum of cgCAT/BSA-Ru/488-PEBBLE v.s. [H2O2]
Fluorescence spectrum shows that when the ratio of catalase to BSA increased in the reaction composition, the fluorescencedye entrapping efficiency was altered. When the amount of protein increased, the intensity of fluorescent peak at 607 nm ([Ru(dpp)3]2+)
increased, while the intensity of fluorescent peak at 524 nm (Oregon Green 488-Dextran®) decreases.


![Figure 8. Fluorescence spectrum of cgCAT/BSA-Ru/488-PEBBLE v.s. [H 2 O 2 ] Fluorescence spectrum shows that when the ratio of catalase to BSA increased in the reaction composition, the fluorescencedye entrapping efficiency was altered](https://thumb-ap.123doks.com/thumbv2/9libinfo/8410056.179791/56.892.133.787.115.452/fluorescence-fluorescence-spectrum-increased-composition-fluorescencedye-entrapping-efficiency.webp)
