在下鏈路正交分頻擷取系統下之利益函數式無線資源分配架構
60
0
0
全文
(2) 國. 立. 交. 通. 大. 學. 電信工程學系碩士班 碩士論文. 在下鏈路正交分頻擷取系統下之 利益函數式無線資源分配架構 Utility-based Framework for Radio Resource Allocation in Downlink OFDMA Systems. 研 究 生︰李宗軒 指導教授︰張仲儒. 教授. 中華民國九十四年六月.
(3) 在下鏈路正交分頻擷取系統下之 利益函數式無線資源分配架構 Utility-based Framework for Radio Resource Allocation in Downlink OFDMA Systems 研 究 生︰李宗軒 指導教授︰張仲儒. Student: Tsung-Hsuan Lee Advisor: Dr. Chung-Ju Chang. 教授. 國立交通大學 電信工程學系碩士班 碩士論文. A Thesis Submitted to Institute of Communication Engineering College of Electrical Engineering and Computer Science National Chiao Tung University in Partial Fulfillment of the Requirements for the Degree of Master of Science in Electrical Engineering June 2005 Hsinchu, Taiwan, Republic of China. 中華民國九十四年六月.
(4) 在下鏈路正交分頻擷取系統下之 利益函數式無線資源分配架構 研究生︰李宗軒. 指導教授︰張仲儒教授. 國立交通大學電信工程學系碩士班 中文摘要 在現今的通訊技術中,正交多頻擷取(Orthogonal Frequency Division Multiple Access OFDMA)是相當具有發展潛力的技術。因為其具有將使用者的封包同時多路傳輸至時間 域及頻率域上的能力,使無線傳輸的效能可以大幅提升。而在多媒體的通訊環境下,能 提供傳輸服務品質保證(Quailty of Service QoS)的系統就變得非常重要的議題。 在本篇論文中,我們提出了一個利益函數模型來增強傳輸效能以及補償對服務尚未 滿意的使用者。此外,我們利用此利益函數發展一個無線資源分配(Utility-based Radio Resource Allocation URRA)架構,並且將其分成兩個階段。第一個階段以滿足使用者的 傳輸服務品質要求來分配無線資源,第二個階段是分配剩餘的無線資源給非即時 (Non-real-time NRT)使用者以達到系統傳輸的最大化。為了要找到最佳的子載波分配向 量,我們應用模擬退火演算法(SA-URRA)在第一個階段,而為了減少運算的複雜度, 我們再提出一個啟發式演算法(H-URRA)在第一個階段。 在模擬結果中,我們以系統傳輸效益以及使用者服務品質要求的滿意度來衡量演算法。結 果使用此架構的兩個演算法在系統傳輸總量上以及使用者服務品質要求的滿意度上都比以鏈 路增益為基礎的無線資源(LRRA)演算法好。. i.
(5) Utility-based Radio Resource Allocation Framework in Downlink OFDMA Systems. Student: Tsung-Hsuan Lee. Advisor: Dr. Chung-Ju Chang. Institute of Communication Engineering National Chiao Tung University. Abstract Among state-of-the-art communication technologies, orthogonal frequency division multiplexing (OFDM) technique is a promising modulation scheme for high data rate wireless communications. And in multimedia wireless environments, quality-of-service (QoS) guarantee becomes an important issue. This thesis formulates a utility function to enhance transmission efficiency and compensate for unsatisfied users. By using the proposed utility function, two utility-based radio resource allocation (URRA) algorithms are proposed. The first phase allocates the radio resources with the consideration of satisfying user’s QoS requirements, while the second phase allocates the residual radio resources for non-real-time (NRT) users to maximize the system throughput. In simulation results, we evaluate algorithms in terms of the transmission efficiency and the user’s satisfaction. The results show that the proposed two algorithms outperform the link-gain-based RRA (LRRA) algorithm.. ii.
(6) Acknowledgment 完成這本碩士論文時,有種「呼,終於結束了」的喜悅與滿足。經過兩年來對論 文方向的摸索、定題、深入研究與模擬討論,我才發現原來作論文不如想像中的容易。 首先,我想感謝張仲儒教授在論文上的指導與建議,給予我到瑞典參與 VTC 的機會。也 謝謝義昇和青毓在北歐之旅時還有耐心聽我演練講稿和討論我的畢業論文。 謝謝兩年來一起奮鬥的朕逢、凱元、立忠和志明,我們終於要畢業了,希望將來 各位飛黃騰達時不要忘了小弟我。謝謝老是被我們碩二欺負的煖玉、家源、俊帆和琴雅, 希望你們未來的一年能順利寫出很棒的論文。還有遠從法國來的 J.B.,祝你在台灣玩 的愉快。謝謝正在外面打拚事業的同昊、崇禎、皓棠和俊憲,碩一時候受了你們不少的 指點。謝謝家慶、立峰、芳慶、界和、詠翰和文祥平時給予我珍貴的建議與幫助,你們 真的是我很努力想要學習的優秀榜樣。 最後,我想感謝我的家人和支持我的朋友們。我,是很悲觀的,常常在事情預見 失敗時就無法勇往直前,如果沒有你們的支持與鼓勵,也不會有今天寫致謝中的我。. 李宗軒 謹誌 民國九十四年. iii.
(7) Contents 中文摘要 ........................................................................................................... i Abstract ........................................................................................................... ii Acknowledgment............................................................................................ iii Contents.......................................................................................................... iv List of Figures ................................................................................................. v List of Tables .................................................................................................. vi Chapter 1 Introduction................................................................................... 1 Chapter 2 System Model of OFDMA............................................................. 5 2.1 OFDM Transceiver ......................................................................................................5 2.2 OFDMA System ..........................................................................................................6 2.3 System Constraints ......................................................................................................8 2.4 Channel Model ..........................................................................................................10 2.5 Services ..................................................................................................................... 11. Chapter 3 Radio Resource Allocation.......................................................... 13 3.1 Link-gain-based RRA (LRRA) Algorithm..................................................................13 3.2 Utility-based RRA (URRA) Framework ....................................................................17 3.2.1 Concept .............................................................................................................17 3.2.2 Utility Function .................................................................................................19 3.2.3 Simulated-annealing URRA (SA-URRA) Algorithm .........................................23 3.2.4 Heuristic-URRA (H-URRA) Algorithm .............................................................30. Chapter 4 Simulation Results....................................................................... 36 4.1 Simulation Environment ............................................................................................36 4.1.1 OFDM System Parameters ................................................................................36 4.1.2 Source Traffic Models and QoS requirements ....................................................37 4.1.3 Parameters Setting of SA...................................................................................39 4.2 Performance Evaluation.............................................................................................40. Chapter 5 Conclusions.................................................................................. 47 Bibliography.................................................................................................. 49 Vita................................................................................................................. 51. iv.
(8) List of Figures Fig. 2.1 OFDM Transceiver for Single User .................................................. 5 Fig. 2.2 An Example of OFDM 2-D Structure ............................................... 6 Fig. 2.3 Downlink OFDMA System ................................................................ 8 Fig. 3.1 The Flowchart of the LRRA Algorithm.......................................... 14 Fig. 3.2 The Flowchart of the SA-URRA Algorithm ................................... 27 Fig. 3.3 The Flowchart of the H-URRA Algorithm ..................................... 32 Fig. 4.1 Average Throughput per TTI.......................................................... 41 Fig. 4.2 Mean Delay per Packets of RT Users.............................................. 42 Fig. 4.3 Packet Dropping Ratio of RT Users................................................ 43 Fig. 4.4 Un-guaranteed Ratio of RT Users................................................... 43 Fig. 4.5 Average Transmission Rate of NRT Users...................................... 44 Fig. 4.6 Un-guaranteed Ratio of NRT Users................................................ 45 Fig. 4.7 Value of Objective Function ............................................................ 46. v.
(9) List of Tables Table 3.1 Notations of the LRRA Algorithm ............................................... 16 Table 3.2 Notations of the Rate-power Function ......................................... 20 Table 3.3 Notations of the QoS Function ..................................................... 21 Table 3.4 Notations of the Priority Function ............................................... 23 Table 4.1 OFDMA System-level Configuration ........................................... 37 Table 4.2 Speech Source Model .................................................................... 38 Table 4.3 Data Source Model........................................................................ 39 Table 4.4 The QoS Requirements of RT and NRT Service ......................... 39. vi.
(10) Chapter 1 Introduction Chapter 1 Introduction. T. he orthogonal frequency division multiplexing (OFDM) technique is a promising modulation scheme for high data rate wireless communications. The main idea of. the OFDM scheme is that the high rate data streams are split into a number of lower rate streams, and transmitted by a set of orthogonal subcarriers. The OFDM system has many compelling properties, such as: (1) flat fading per subcarrier (2) comparatively short inter-symbol interference (ISI) (3) N short equalizers needed if there are N subcarriers (4) maximum spectral efficiency (Nyquist rate). In a single user OFDM system, when the channel state information (CSI) is available at the transmitter, the transmit power for each subcarrier can be adapted according to the CSI in order to increase the data rate. There were many related works have studied on this issue. In a multi-user environment, the OFDM scheme has many choices to implement multiple access, such as code division multiple access (CDMA), time division multiple access (TDMA), and frequency division multiple access (FDMA). Accordingly, there are various kinds of OFDM systems: OFDM-CDMA, OFDM-TDMA and OFDM-FDMA. The OFDM-CDMA has processing gain due to frequency diversity, but it has the negative effect of multiple access interference (MAI) because of sharing common subcarries. Moreover, it has another drawback of no adaptation to channel characteristics. Unlike the OFDM-CDMA, the OFDM-TDMA has no MAI because each user has a specified time slot to transmit. For the OFDM-FDMA, Reference [1] has proved that the data rate of a multi-user OFDM system is maximized when each subcarrier is assigned to only one user with the best channel gain and the transmit power is distributed over the subcarriers by the water-filling policy. -1-.
(11) In downlink OFDMA systems, many papers show that it is advantageous to use a well-designed radio resource allocation (RRA) algorithm to fully utilize power and bandwidth of the system. The main idea of the RRA algorithms is exploiting the multi-user diversity, which means that the system can efficiently allocate power and bandwidth among users having different CSI profiles.In the OFDMA system, however, the best subcarrier for a user can also be the best subcarrier for another user, so a conflict exists in the allocation of radio resource. Recently, many studies focused on how to propose efficient RRA algorithm with low computational complexity in OFDMA systems. M. Ergen et. al. [2] considered the resource allocation problem of assigning a set of subcarriers and determining the number of bits to be transmitted for each subcarrier in OFDMA systems with computational simplicity and fairness between users. C. Y. Wang et. al. [3] applies Lagrangian relaxation (LR) to this problem, in which the QoS requirement defined as achieving a specified data transmission rate and bit error rate (BER) of each user in each transmission was taken in account. However, Kivanc et. al. challenged the feasibility and validity of the LR method. [4] Instead, the author [4] proposed two different approaches, called rate-craving greedy (RCG) and amplitude-craving greedy (ACG) algorithms, to achieve the near-optimal solution with the decrease on computational complexity. For the same reason, [5] also proposed another adaptive bit allocation (ABA) algorithm and adaptive subcarrier allocation (ASA) algorithm to reduce computational complexity with the same QoS requirements and goal of minimizing total transmission power. Furthermore, the authors in [6] introduced the concept of a utility function for cross-layer optimization, which is based on maximizing the sum of the utilities over all active users in multi-user frequency-selective fading wireless environments. More precisely, the utility function in [6] was only a function of transmission rate of each user, which is not appropriate applied to fulfill different kinds of service requirements, such as delay tolerance, maximum dropping ratio, fairness, and priority among users. Moreover, a buffer management is another important issue on cross-layer design because of. -2-.
(12) the further consideration of users’ source traffic. In previous works, the user’s QoS requirements are only required transmission rate and required bit error rate (BER), and the goal of their RRA algorithms is to minimize transmission power and to satisfy the two QoS requirements. However, when radio resources are not enough for all the users, their RRA algorithms do not work well because no compensation is made for unsatisfied users. As a result, parts of users cannot be satisfied with their QoS requirements and the unfairness among users arises. Moreover, in more realistic environments, users haves different service types, and their traffic model should be taken into account. In addition, the related buffer management should also be embedded, such as a packet-dropping mechanism or a packet-queuing mechanism. Base on the motivations mentioned above, this thesis formulates a utility function to enhance transmission efficiency and compensate for unsatisfied users. Besides, the utility function is designed with three factors: the allocation preference of BS, the satisfaction of user’s QoS requirements, and the subscription preference of user. With the proposed utility function, a utility-based RRA (URRA) framework is proposed in this thesis. The goal of the URRA algorithms is to maximize the system throughput and to satisfy user’s QoS requirements; accordingly, the URRA framework is designed in two-phase operations. The first phase allocates the radio resources with the consideration of satisfying user’s QoS requirements, while the second phase allocates the residual radio resources for non-real-time users to maximize the system throughput. In order to find an optimal subcarrier allocation vector to maximize the sum of assigned utilities, a simulated-annealing (SA) method is implemented in the first phase (SA-URRA), and another suboptimal heuristic method is proposed in the first phase (H-URRA) to replace the SA method for reducing computational complexity. The organization is described as follows. In chapter 2, the OFDMA system model is introduced in section 2.1-2.2, and four constraints required to be considered for the RRA problem are discussed in section 2.3. The channel model assumed in this thesis is formulated. -3-.
(13) in section 2.4, and the services types, including real-time (RT) service and non-real-time (NRT) service, and their traffic models are mentioned in section 2.5. In chapter 3, a conventional link-gain-based RRA (LRRA) algorithm is described in section 3.1. The proposed URRA framework is discussed in detail in section 3.2. The main concept of the URRA framework is described in section 3.2.1, and the utility function is formulated in section 3.2.2. In section 3.2.3, a SA method is implemented in the URRA algorithm to find an optimal allocation subcarrier vector. For reducing the computational complexity of the SA-URRA algorithm, a heuristic method is implemented in the URRA algorithm to find a suboptimal allocation subcarrier vector. The H-URRA algorithm is discussed in section 3.2.4. In chapter 4, the simulation results are presented. The system throughput and the satisfaction of users are evaluated for the LRRA, the SA-URRA, and the H-URRA algorithms. It is shown that the SA-URRA and the H-URRA algorithms outperforms the conventional LRRA algorithm both in the the system throughput and the QoS satisfaction of users. In chapter 5, concluding remarks are provided to this thesis.. -4-.
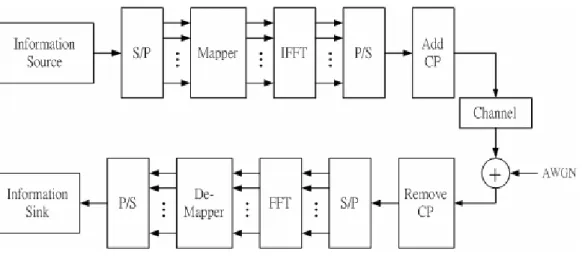
(14) Chapter 2 System Model of OFDMA Chapter 2 System Model of OFDMA. 2.1 OFDM Transceiver. Fig. 2.1 OFDM Transceiver for Single User. F. igure 2.1 shows a simplified OFDM transceiver block diagram. An OFDM transmitter separates a symbol of serial bits within symbol time Ts into a parallel. form; i.e., each bit is transmitted within the same Ts and fed into the corresponding subcarrier. In the discrete time domain, an OFDM modulator can be easily implemented by inverse fast Fourier transform (IFFT) and a parallel-to-serial (P/S) converter. In order to cancel the inter-carrier interference (ICI) of a subchannel due to multipath, a cyclic prefix (CP) is attached, which is a copy of the last portion of OFDM signal, to the front (or head) of itself. In contrast to OFDM transmitter, an OFDM receiver removes the CP first, and then converts serial bits into parallel form for performing the fast Fourier transform (FFT) as a demodulator. Finally, the output bits from the FFT block will be fed into the de-mapper block to restore the -5-.
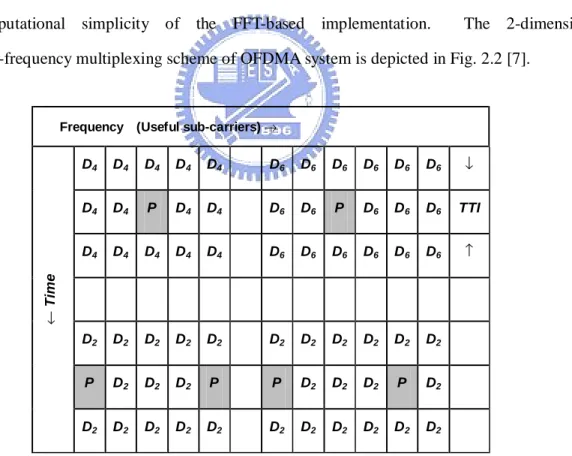
(15) original bits, and P/S conversion is followed.. 2.2 OFDMA System In the multiuser environment, the OFDMA system is a time-frequency multiplexing system. Users are multiplexed both in time and frequency domain, with pilot and signaling information. In the frequency domain (i.e. the sub-carrier domain), users data symbol can be multiplexed onto different numbers of useful sub-carriers. In addition, sub-carriers or group of sub-carriers can be reserved to transmit pilot, signaling or other kinds of symbols. Multiplexing can also be performed in the time domain, as long as it occurs at the OFDM symbol rate or at a multiple of the symbol rate. The modulation scheme (modulation level) used for each sub-carrier can also be changed at the corresponding rate, keeping the computational simplicity of the FFT-based implementation.. The 2-dimensional. time-frequency multiplexing scheme of OFDMA system is depicted in Fig. 2.2 [7].. Frequency (Useful sub-carriers) →. D4. D4. D4. D4. D6. D6. D6. D6. D6. D6. ↓. D4. D4. P. D4. D4. D6. D6. P. D6. D6. D6. TTI. D4. D4. D4. D4. D4. D6. D6. D6. D6. D6. D6. ↑. D2. D2. D2. D2. D2. D2. D2. D2. D2. D2. D2. P. D2. D2. D2. P. P. D2. D2. D2. P. D2. D2. D2. D2. D2. D2. D2. D2. D2. D2. D2. D2. ← Time. D4. P = pilot or signalling, D = data. TTI = transmission time interval The subscript indicates the modulation level M=2,4 or 6 (QPSK, 16QAM or 64QAM).. Fig. 2.2 An Example of OFDM 2-D Structure. -6-.
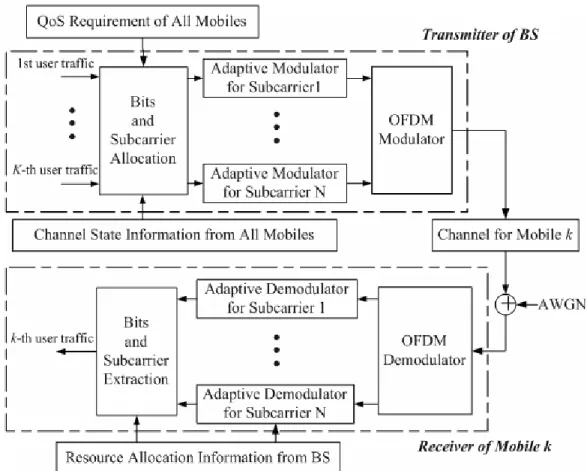
(16) According to [7], three types of OFDM physical channels are defined: OFDM common pilot channel (OFDM-CPICH), OFDM shared control physical channels (OFDM-SCCH), and OFDM-physical downlink shared channels (OFDM-PDSCH). OFDM-CPICH contains pilot information, where the pilots are inserted in the time-frequency domain and must satisfy the 2-D sampling theorem in order to enable reconstruction of the time-and frequency varying channel response [8]. OFDM-SCCH, contain signaling information. The specific frequency locations used for signaling should be scattered, in order to benefit from frequency diversity. Conversely, the time locations can be spread across the subframe, while limited to a small number of OFDM symbols to ease extraction of the OFDM-SCCH information by users. OFDM-PDSCHs, are dedicated to carry data or higher layer signaling information. The concept of downlink OFDMA system is illustrated in Fig. 2.3, where K users and N subcarriers are assumed. At the transmitter of a base station (BS), the Bits and Subcarrier Allocation function block executes every transmission time interval (TTI) to distribute all users’ data streams to each subcarrier with appropriate modulation order. Its functionality is performed according to a specific RRA algorithm so that the QoS requirements of all active users are fulfilled, or the overall throughput of the OFDMA system is improved. If a user’s data stream cannot be transmitted completely at a TTI, the data stream then is queued in a buffer and waits for the RRA in the following TTI. Notably, the queued data are treated differently for RT and NRT users due to their delay tolerances. The data stream of a RT user will be dropped if it excesses the maximum delay tolerance of the QoS requirements, while the data stream of a NRT user will not. The Adaptive Modulator at each subcarrier maps the data bits from the previous function block, Bits and Subcarrier Allocation, into a QAM symbol. Finally, the last function block, OFDM Modulator, will converts the N QAM symbols into an OFDM symbol by IFFT. At the kth user’s receiver, OFDM Demodulator converts a noisy OFDM symbol to N QAM symbols by FFT. It is assumed that the resource allocation information of the kth user is obtained in advance, which includes the information subcarriers allocations and the. -7-.
(17) related modulation orders. With these information, the OFDM Demodulator filters the needed QAM symbols, and then Adaptive Demodulators converts them to extract the original data bits. Finally, the last function, Bits and Subcarrier Extraction, will restore all the data bits to the kth user’s data stream.. Fig. 2.3 Downlink OFDMA System. 2.3 System Constraints In the downlink OFDMA systems, some realistic considerations are taken into consideration in this thesis. Here, four system constraints are imposed on the design of radio resource allocation algorithm for Bits and Subcarrier Allocation at the transmitter of a BS, which are stated as follows.. -8-.
(18) (I) Subcarrier Allocation Constraint In OFDMA system, a subcarrier can only be allocated to one user at a TTI. Denote Ψn the index of the user granting the nth subcarrier and Φ n the modulation order assigned to the nth subcarrier. Ψn = {φ ,1,L , K }, for n = 1, L, N Φ n = {0,1, 2,3 (no transmission, QPSK, 16QAM, 64QAM)} , for n = 1,L , N. (1) (2). (II) Maximum Subcarrier Power Constraint To prevent from the peak-to-average power ratio (PAPR) problem, the power allocation of a subcarrier should be limited, which denotes as the maximum subcarrier power constraint, p max . Γ (Ψn , Φ n ) ≤ p max ,. (3). where Γ( Ψn , Φ n ) denotes the power allocated to the nth subcarrier, which is allocated to the Ψn th user with the modulation order Φ n . Moreover, the maximum available modulation order is given by. Φ max n. 0 1 = 2 3. if Γ (Ψn ,1) > p max , if Γ(Ψn ,1) ≤ p max and Γ(Ψn ,2) > p max , if Γ(Ψn ,2) ≤ p max and Γ(Ψn ,3) > p max ,. (4). if Γ (Ψn ,3) ≤ p max .. It is noted that, the assigned modulation order, Φ n cannot excess Φ max for a given Ψn . n. (III) Total System Power Constraint The power allocation for data transmission should be limited at the transmitter of a BS; that is, the sum of the maximum power allocated to each subcarrier will be bounded at the total system power constraint, p system . Moreover, the power allocated to a subcarrier is determined by user’s link gain and the assigned modulation order. The total system power. -9-.
(19) constraint is formulated as follows, N. ∑ Γ(Ψn , Φ n ) ≤ p system ,. (5). n =1. (IV) Allocation Buffer Constraint For transmission efficiency and QoS quarantement, the transmitter at a BS only allocates a user enough transmission rate to clean up the packets in the user’s buffer. The allocation buffer constraint is formulated by N. ∑ {Φ n | Ψn = k } ≤ RkB , for k = 1, L , K ,. (6). n =1. where RkB denotes the required rate to clean up the packets of the kth user’s buffer.. 2.4 Channel Model In wireless environment, the bandwidth of each subcarrier should be smaller than the coherence bandwidth of the channel to overcome the frequency-selective fading. No correlation between each subcarrier is assumed, and each subcarrier has a flat-fading channel with a constant link gain within a TTI, which is given by α k ,n = FL , k ⋅ FS , k ,n , FL , k = (. d0 s ) ⋅ PL(d 0 ) ⋅ X σ , dk. (7) (8). where α k ,n denotes the link gain of the kth user at the nth subcarrier. The link gain consists of two parts: one is large-scale fading, and the other is small-scale fading. FL ,k is large-scale fading of the kth user due to free space degrading and shadowing effect [9], d k is the distance between BS and the kth user, d 0 is the close-in reference distance, PL (d 0 ) is the mean path loss at the reference distance d 0 , s is the path loss exponent depending on the surroundings and building type, and X σ is the shadowing effect with log-normal distribution of parameter σ . FS ,k , n is the small-scale fading of the kth user in the nth subchannel with Rayleigh distribution due to multipath. In a mobile, the large-scale fading of all subchannels are the same at one random time instant, but the small-scale fading of all -10-.
(20) subchannels are different. Furthermore, perfect estimation of the CSI of each users is assumed, and retransmission due to transmission error is not considered in this thesis.. 2.5 Services In this thesis, two kinds of service are considered, one is real-time (RT) service and the other is non-real-time (NRT) service. The RT services are delay-sensitive, such as voice services, and their traffic characteristics are described by ON/OFF model. The packets are generated in a constant rate during ON period, while no packets are generated during the OFF period. Four QoS requirements are considered for the RT services. The first requirement is required transmission rate, R * during the ON period, the second requirement is required bit error rate, BER * , the third requirement is maximum delay tolerance, D * , and the last requirement is maximum packet dropping ratio, PD* . The packets of RT services will be queued in buffers if the radio resources are not enough for transmission; however, they will be dropped if the delay of head of line (HOL) packets exceeds the maximum delay tolerance. A RT service is called “unguaranteed” if the ratio of dropped packets over the total arrival packets is larger than the maximum packet dropping ratio PD* . The NRT services are delay insensitive, such as WWW application, and their traffic characteristics are described by Pareto model. The packets are generated with burstness when a NRT user click a web page, and no packets are generated when the NRT user is reading the web page. Different from the RT services, the packets of NRT services can be queued for a long time without being dropped. Only two QoS requirement are considered for the NRT * services: required BER, BER * and minimum required transmission rate, Rmin .. Moreover, token bucket method is implemented in the buffer management of the NRT services. The system generates tokens at a constant rate for a NRT user, and the actual transmission rate of the packets of the NRT user are determined by a RRA algorithm in Bits. -11-.
(21) and Subcarrier Allocation according to the remaining tokens, which is the difference between the total aggregated tokens and the total transmitted packets.. -12-.
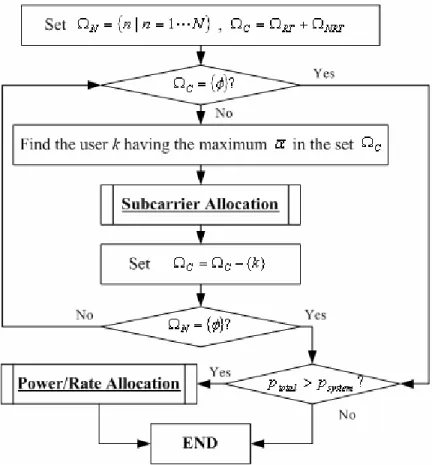
(22) Chapter 3 Radio Resource Allocation Chapter 3 Radio Resource Allocation. 3.1 Link-gain-based RRA (LRRA) Algorithm. I. n comparison to the proposed URRA framework, a conventional RRA algorithm, link-gain-based RRA (LRRA) algorithm, is described in this section. In the LRRA. algorithm, the QoS requirement is defined as achieving a specified BER of each user in each transmission under the subcarrier allocation constraint (1), the maximum subcarrrier power constraint (3), the total system power constraint (5), and the allocation buffer constraint(6). The LRRA algorithm allocates the radio resources in three steps and describes as follows. Step 1: Pick up the user k having the best average link gain, α k , out of candidate user set ΩC . k = arg {MAX {α i }} i∈Ω C. Ω C = Ω C - {k}. Step 2: Allocate subcarriers to the user i according to the link gains of the subcarriers by executing Subcarrier Allocation function. The subcarrier with the best link gain is allocated firstly and the others are in order. The subcarrier allocation process will not be stopped until the assigned rate is equal to user’ required rate or no subcarrier is available. If the unallocated subcarriers set Ω N or the candidate user set ΩC is empty, then go to Step 3. Otherwise, go back to Step 1. Step 3: Determine power and modulation order of subcarriers. If the total assigned. -13-.
(23) power is larger than the total system power constraint, the power reduction is performed by executing Power/Rate Allocation function to reducing the modulation order of subcarriers. Subcarrier with the worst link gain is firstly picked up to reduce the modulation order, and the others are in order. This step will not be stopped until the total assigned power is under the constraint. The notations used in the section are listed in Table 3.1.. Fig. 3.1 The Flowchart of the LRRA Algorithm (I) Subcarrier Allocation /* The function is to allocate unassigned subcarrier to a user who has the maximum link gain in Ω C , and to assign the maximum allowable modulation order to the user. */ RkB := the required rate to clean up the kth user’s buffer; RkA := 0; /* Rk2 is the assigned rate of the kth user */ -14-.
(24) While ( R kA < RkB ) { If ( Ω N = {φ } ) {Break;} nˆ := the subcarrier having the maximum link gain of the kth. user in set Ω N ; /* assign the nˆ th subacrrier to the kth user with the maximum allowable modulation order */ Ψnˆ := k ; Φ nˆ := Φ max ; nˆ R kA = RkA + Φ nˆ ;. If ( RkA > R kB ){ /* reduce the modulation order */ Φ nˆ = Φ nˆ − ( R kA − RkB ) ; RkA = R kB ;. } Ω N = Ω N − {nˆ};. }. (II) Power/Rate Reduction /* The function is separate into two steps. The first step is to reduce modulation orders until QPSK is used. The second step is to reduce modulation order until no transmission is used. */ N. ptotal :=. ∑ Γ (Ψn , Φ n ) ; n =1. While ( p total > p system ) { If ( at least one subcarrier using 16QAM) { nˆ := the subcarrier using at least 16QAM with the worst. link gain; Φ nˆ = Φ nˆ − 1 ; /* reduce the modulation order */ ptotal = ptotal − reduced power; -15-. }.
(25) Else { Break; } } While ( p total > p system ) { If (at least one subcarrier using QPSK) { nˆ := the subcarrier using at least QPSK with the worst. link gain; Φ nˆ = Φ nˆ − 1 ; /* reduce the modulation order */ p total = p total − reduced power;. } }. Notation. Description. αk. The average link gain of the kth user αk =. 1 N. N. ∑ α k ,n n =1. Ω RT. A set of RT users having packets in buffer. Ω NRT. A set of NRT users having packets in buffer. ΩN. A set of unallocated subcarriers. ΩC. A set of candidate users to be allocated radio resource Table 3.1 Notations of the LRRA Algorithm. -16-.
(26) 3.2 Utility-based RRA (URRA) Framework 3.2.1 Concept For OFDMA system supporting multimedia, user satisfaction as well as throughput maximization is the goal to achieve in the design of RRA. However, these two goals are conflicted sometimes when the radio resources are not enough to satisfy all the users. The LRRA algorithm is a simple and intuitive method to approach the optimal throughput at each TTI, which allocates the radio resources to users with best link gain. However, considering the satisfaction of each user, the system should allocate additional radio resources to unsatisfied users for compensation though system throughput is reduced. In order to make a balance between system throughput maximization and user satisfaction, this thesis proposes a utility-based RRA (URRA) framework. The design idea of the URRA framework comes from the understanding that radio resources should be firstly provided to urgent users for their QoS requirements and then the residual radio resources, if possible, are allocated secondly to improve the system utilization. Accordingly, the URRA framework is designed in a two-phase operation: QoS Fulfillment Phase and Throughput Maximization Phase. In QoS Fulfillment Phase, the radio resources are allocated according to a utility function of subcarriers which consists factors of allocation preference of BS, satisfaction of user’s QoS requirements, and the subscription preference of user. Here, we briefly describe the concept of the utility function, which will be clearly explained in 3.2.2. The allocation preference of BS is represented by a rate-power function. For a subcarrier, the value of the rate-power function is inversely related to the required transmission power for a given modulation order; that is, higher the function value lower the transmission power. For transmission efficiency, the system allocates a subcarrier to a user having the best value of the rate-power function consequently. -17-.
(27) The satisfaction of user’s QoS requirements is represented by a QoS function. A higher value of the QoS function is corresponding to a lower satisfaction of a user whatever the service type is, which implies that the system should make a compensation for the user. For the RT service, the degree of satisfaction is described in terms of packet delay. But, for the NRT service, the degree of satisfaction is described in terms of the difference between the aggregated tokens and the already transmitted packets. The subscription preference of user is represented by a priority function. A user may have different values of the priority function, which depends on the service type and the CSI of the user. In the three design factors mentioned above, the first one allocates the radio resources with respect to throughput maximization; on the other hand, the second and the third factors allocate radio resources with respect to user’s satisfaction. However, it is usually a tradeoff between user satisfaction and system utilization so that we define the product of the rate-power function, the QoS function, and the priority function, as a utility function, to allocate the radio resources. Moreover, for optimizing the utility function for given constraints (1), (3), (5), and (6), it is impossible to determine optimal subcarrier allocation and optimal modulation assignment at the same time due to the high computation complexity. Alternatively, only subcarrier allocation constraint (1), maximum subcarrier power constraint (3), and allocation buffer constraint (6) are taken into account in QoS Fulfillment Phase regardless of total system power constraint (5). The constraint (5) is left for Throughput Maximization Phase. That is, subcarrier allocation is determined first, and then maximum allowable modulation order defined in (4) is assigned to each subcarrier. After the QoS Fulfillment Phase is completed, the OFDMA system provides enough radio resource to guarantee the QoS requirements for both RT and NRT users. In Throughput Maximization Phase, two kinds of function are executed. The first one is that the BS allocates residual subcarriers only to the NRT users whose buffers are not empty, according. -18-.
(28) to the CSI of these NRT users. Notably, NRT users may still have packets in buffer although their token buckets are empty. The system throughput is improved by allocating the residual subcarriers to those NRT users The other one is that the URRA algorithm checks whether the allocation results meets the constraint (5). If constraint (5) is violated, then the BS will reduce the assignment of modulation orders to lower the sum of allocated power until the constraint (5) is met. Therefore, the utility function mentioned above is formulated as a mathematical form in the following section, and the three functions (rate-power function, QoS function and priority function) embedded in the utility function are also discussed in detail.. 3.2.2 Utility Function The utility function is designed with three main allocation principles. First, in order to improve the system throughput, a subcarrier is allocated to a user if the user has the best link gain, compared to the other users. Second, the system should make appropriate compensation for a user if the user is not allocated with enough radio resource to meet the QoS requirements. Third, for the transmission efficiency, a user is allocated with the best subcarriers as could as possible. Base on the three principles discussed above, three functions are defined as evaluation criterions accordingly, and the product form of the three functions is defined as the utility function for RRA, which is represented by [10] U RRA (k , n) = R(k , n) ⋅ Q (k ) ⋅ P(k , n) ,. (9). where R(k , n) is the power-rate function of the kth user on the nth subcarrier, Q(k ) is the QoS function, and P(k,n) is the priority function. The contents of the three functions are further discussed in the following. (I) Power-rate Function The power-rate function, R(k , n) is derived from the BER of M-QAM in AWGN. -19-.
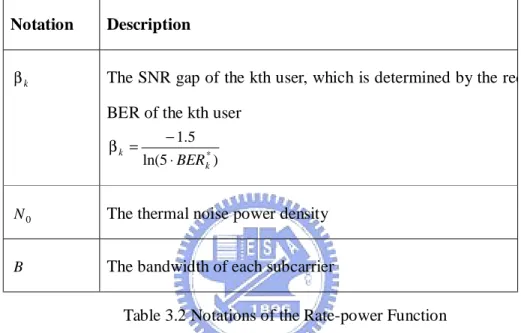
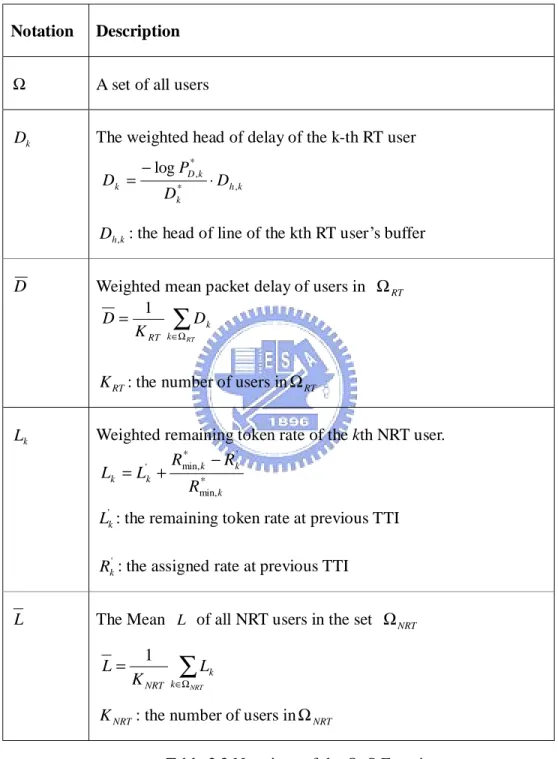
(29) channel [11], which is expressed by R(k , n ) = log 2 (1 + β k ⋅. α k ,n ⋅ p max. N0 ⋅ B and notations used in (10) are described in Table 3.2.. ). ,. (10). The R(k , n) increases as the α k ,n increases, which means the kth user can use higher modulation order on the nth subcarrier. In addition, a user with a strict required BER requires higher link quality than those with with a loose QoS. Notation. Description. βk. The SNR gap of the kth user, which is determined by the required BER of the kth user βk =. − 1.5 ln(5 ⋅ BER k* ). N0. The thermal noise power density. B. The bandwidth of each subcarrier Table 3.2 Notations of the Rate-power Function. Notably, if the utility function equals to the power-rate function, then the proposed utility-based RRA algorithm becomes a link-gain-based algorithm. (II) QoS Function For the second allocation principle of the RRA of an OFDMA system, the Q(k ) is defined as Dk − D exp 1/ 2 1 + D L −L Q(k ) = exp k 1 / 2 1 + L 0 . for k ∈ Ω RT for k ∈ Ω NRT. ,. (11). for k ∈ Ω − Ω RT − Ω NRT. where the notations used in (11) are described in the following Table 3.3. The QoS function is to evaluate the relative satisfactory according to their QoS -20-.
(30) requirements, among users with the same service type. All the users are sorted into three sets by their service types and buffer conditions.. Notation. Description. Ω. A set of all users. Dk. The weighted head of delay of the k-th RT user Dk =. − log PD* ,k. ⋅ Dh , k. Dk*. Dh ,k : the head of line of the kth RT user’s buffer. D. Weighted mean packet delay of users in Ω RT 1 D= ∑ Dk K RT k∈Ω RT K RT : the number of users in Ω RT. Lk. Weighted remaining token rate of the kth NRT user. * ' Rmin, k − Rk Lk = L'k + * Rmin, k L'k : the remaining token rate at previous TTI Rk' : the assigned rate at previous TTI. L. The Mean L of all NRT users in the set Ω NRT L=. 1 K NRT. ∑L. k∈Ω NRT. k. K NRT : the number of users in Ω NRT Table 3.3 Notations of the QoS Function In the first set, Ω RT ,the QoS function compares the weighted head of line delay of the kth RT user Dk with the average weighted head of line delay of the users in the first set D , in an exponential form. It is expected that the value of Q(k ) becomes higher while the -21-.
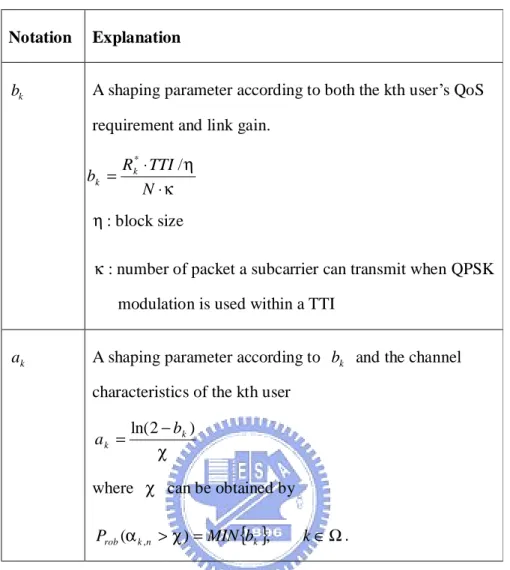
(31) weighted mean packet delay of the kth RT user is much larger than those of other RT users. Larger value of Q(k ) means that the kth user’s packets are more likely dropped by the system so the kth RT user should be allocated more radio resource to compensate the satisfaction of QoS requirements, compared to other RT users in the first set. Similarly, in the second set, Ω NRT , the Q(k ) compares the degree of satisfactory of the kth NRT user, Lk , to the averaged one of all the NRT users in the second set, L , in an exponential form. Longer Lk results in larger Q(k ) , making the kth NRT user get more radio resource to compensate the satisfaction of QoS requirements, compared to other NRT users in the second set. In the third set, the value of Q(k ) is set to be zero because no packets in the kth user’s buffer are to be transmitted. (III) Priority Function For the third allocation principle of the RRA, the priority function, P(k , n) , is given by α k ,n + bk − 1 k ∈ Ω RT + Ω NRT exp a k ⋅ P(k , n) = a k 0 (12) k ∈ Ω − Ω RT − Ω NRT where the notations used in (12) are described in the following Table 3.4. The priority function determines the subscription preference of a user from the point of views of both the user and a BS. From user’s point of view, the subscription preferences of subcarriers are positively related to the link gain by the priority function. From BS’s point of view, the allocation preferences of subcarriers are discriminated by the radio of user’s required radio resources over the overall radio resources. The preference gap is large for a user who can be easily satisfied with the QoS requirements, but small for a user who requires more radio resources for the satisfaction.. -22-.
(32) Notation. Explanation. bk. A shaping parameter according to both the kth user’s QoS requirement and link gain. Rk* ⋅ TTI / η N ⋅κ. bk =. η : block size κ : number of packet a subcarrier can transmit when QPSK modulation is used within a TTI ak. A shaping parameter according to bk and the channel characteristics of the kth user ak =. ln( 2 − bk ) χ. where χ can be obtained by Prob (α k ,n > χ ) = MIN {bk },. k ∈Ω.. Table 3.4 Notations of the Priority Function. 3.2.3 Simulated-annealing URRA (SA-URRA) Algorithm In QoS Fulfillment Phase, with the consideration of those constraints (1), (3), and (6), the searching space of the optimal subcarrier allocation problem is so extremely large that the solution of the optimization problem is not trivial. That is, examining the optimal solution for exhausted search is impossible. In this section, we adopt the simulated-annealing (SA) algorithm for the optimization problem and propose a simulated-annealing URRA (SA-URRA) algorithm. In 1953, Metropolis firstly proposed a method to simulate the annealing in physical sciences, and the concept of “Markov chain”, which each state was related to its previous -23-.
(33) state, was introduced. Until 1983, Kirkpatric applied SA algorithm to solve NP-hard combinational optimization problem. In order to adapt the SA algorithm to the RRA problem, a state of the Markov chain is defined as X = [ Ψ1. Ψ2 L ΨN ], where Ψn ∈ Ω Un for n ∈ {1,2, L , N } ,. (13). where Ω Un is the candidate user set of the nth subcarrier. The state X stands for a subcarrier allocation vector, which represents the allocated users on each subcarrier. The goal of the SA algorithm is to find an optimal state X having the maximum value of the objective function , U, which is the sum of assigned utilities. N MAX U = ∑ U RRA ( Ψn , n ) Ψn ∈ X n =1 . (14). The state X also has to meet those constraints mentioned above. Futhermore, as the subcarrier allocation vector is selected, each subcarrier will be assigned the maximum allowable modulation order defined in (4). In below, the general concept of a SA algorithm [12] is given. Simulated Annealing ( X 0 , Tmax ){ /* Given an initial state X 0 and an initial value for the parameters, T , Tmax */ T = Tmax ; Xi = X0; While ( Outer loop criterion is not satisfied ) { While (Inner loop criterion is not satisfied) { X j = Generate( X i ); If( Accept ( X j X i , T ) ) { Xi = X j ; } }. -24-.
(34) T = Update( T );. } The general form of SA algorithm involves five parameters: (I). The function Generate( X i ) is to select a new solution state X j according to the present state X i ,. (II). The function Accept ( X j X i , T ) determines whether the new solution state Xj is accepted according to a acceptance function f T (∆U ij ) . Its structure is shown below,. Accept ( X j , X i , T ){ /* The function returns a 1 if the cost variation passes a test. T is the control parameter */ ∆U ij = U j − U i ; y = f T (∆U ij ) ; r = random ( 0, 1); /* random is a function which returns a pseudo-random number uniformly distributed on the interval [0,1] */ If ( r < y ) return (1); Else Return (0); } The value Ui represents the objective function of the present state X i , while Uj represents the objective function of the next state X j . The acceptance function f T (∆U ij ) is given by ∆U ij f T (∆U ij ) = MIN 1, exp T. , . which gives a probability to accept the worse next state X j . (III) The function Update( T) is to decrease the present temperature T to a new lower. -25-. (15).
(35) temperature with a decrement rate. (IV) Outer loop criterion is used to test whether T is low enough to stop the SA algorithm. (V) Inner loop criterion is to decide whether sufficient number of moves has been tried to reach equilibrium condition at this temperature and T is about to decrease.. Moreover, to reduce the searching space of X for the fast convergence of the SA algorithm, a threshold parameter, Pth , is used in the priority function. If the priority function P(k , n) is lower than the priority threshold, then the kth user will not be allocated to the nth subcarrier because it is not preferable for the kth user to use the nth subcarrier. Given an appropriate setting of threshold Pth , the convergence of SA method can be efficiently achieved without sacrificing the performance of the SA-RRA algorithm. Fig. 3.2 shows a complete flowchart of the SA-URRA algorithm, and the detail is discussed as follows. (I) Initialization First of all, initial temperature, Tmax, final temperature, Tmin, decrement rate of temperature, γ, the maximum number of iteration at a temperature level, Lmax, should be set to appropriate values. Second, the initial subcarrier allocation vector X 0 is randomly selected from searching space. (II) Selection and Comparison The objective function U is defined as the sum of the assigned utility of all subcarriers, ˆ to maximize U, which and the goal is to find a reasonable subcarrier allocation vector X implies that maximizing the sum of assigned utilities under satisfying the system constraints (1), (3), and (6). If X i = X 0 , i denotes the present state, the next state X j will be selected from the neighborhood of X 0 . The SA method will determine whether it accepts X j as the next X i or not according to the acceptance function. X j will be absolutely accepted if Uj is larger than Ui, or it will be accepted by probability. The significant advantage of the SA method comparing to greedy algorithm is. -26-.
(36) that the SA method gives a probability to accept a worse next state, because always choosing the better next state may lead to a suboptimal solution. The acceptance function f T (∆U ij ) in Fig.3.2 is the same as (15). (III) Annealing If the number of iteration at a temperature level reaches Lmax, then the temperature will decrease by the decrement rate γ until the temperature reaches the final temperature Tmin. In initial stage of the SA method, higher Tmax is appropriate to increase the probability of accepting a worse next state to prevent from falling into suboptimal solution. Moreover, high decrement rate γ reduces the tendency of accepting a worse next state quickly and makes fast convergence ; Low γ is on the contrary at the expense of convergence time.. Fig. 3.2 The Flowchart of the SA-URRA Algorithm In Throughput Maximization Phase, the residual radio resources are allocated to NRT users. Candidate NRT User Set Construction function is used to find NRT users that still require for transmission. This function is executed only once in the beginning of this phase. -27-.
(37) If at least one Ω Un , which is defined as the candidate user set of the nth subcarrier, is not empty, residual subcarriers are reallocated to those NRT users in the candidate NRT user set by executing NRT Subcarrier Reallocation. After that, modulation orders are initially assigned and redundant subcarriers are released by executing NRT Subcarrier Release 2. The process will be not stopped until all Ω Un sets are empty. If all Ω Un sets are empty, the BS checks whether the constraint (5) is violated or not. If the constraint (5) is not violated, the whole process will be stopped. Otherwise, the function Power/Rate Allocation is executed to reduce the assignment of modulation orders and then go to END. In summary, the Throughput Maximization Phase contains four function blocks, Candidate NRT User Set Construction, NRT Subcarrier Reallocation, NRT Subcarrier Release 2, and Power/Rate Allocation, and their pseudo codes are described as follows. (I) Candidate NRT User Set Construction /* The function is to construct the candidate sets for unallocated subcarriers at the throughput maximization phase */ From n=1 to n=N { If ( Φ n = { φ }) { From k=1 to k=K { If ( k ∈ Ω NRT && R(k , n ) ≥ 2 ) { ΩUn = Ω Un + { k }; } }. }. }. (II) NRT Subcarrier Reallocation /* The function reallocates each subcarrier to a NRT user having the best utilities in each NRT candidate user set */ Ω Sk := the candidate subcarrier set of the kth user;. From n=1 To n=N {. -28-.
(38) If ( Ψn == {φ } ){ Ψn := The NRT user having the maximum U ( k , n ) in Ω Un ; Ω SΨn = Ω ΨS n + {n} ;. } }. (III) NRT Subcarrier Release 2 /* The function assigns modulation orders to a NRT user until the constraint (6) is violated or until the useful subcarrier sets are all empty. */ Ω Sk := the candidate subcarrier set of the kth user; RkB := the required rate to clean up the kth user’s buffer; RkA := 0; /* Rk2 is the assigned rate of the kth user */. While ( R kB < RkA ) { If ( Ω Sk == {φ } ) { Break; } nˆ := the subcarrier having the maximum link gain of the kth. user in the set Ω kS ; Ψnˆ := k ; Φ nˆ = Φ max ; R kA = RkA + Φ nˆ ; nˆ. From n=1 To n=N { ΩUn = {ΩUn − {k }| Ψn ≠ k }; } If ( RkA > R kB ){ /* reduce the modulation order */ Φ nˆ = Φ nˆ − ( R kA − RkB ) ; RkA = R kB ;. } }. (IV) Power/Rate Allocation /* The function is separate into two steps. The first step is to reduce modulation orders until QPSK is used. The second step. -29-.
(39) is to reduce modulation order until no transmission is used. */ N. ptotal :=. ∑ Γ (Ψn , Φ n ) ; n =1. While ( p total > p system ) { If ( at least one subcarrier using 16QAM) { nˆ := the subcarrier using at least 16QAM with the worst. link gain; Φ nˆ = Φ nˆ − 1 ; /* reduce the modulation order */ ptotal = ptotal − reduced power;. }. Else { Break; } } While ( p total > p system ) { If (at least one subcarrier using QPSK) { nˆ := the subcarrier using at least QPSK with the worst. link gain; Φ nˆ = Φ nˆ − 1 ; /* reduce the modulation order */ p total = p total − reduced power;. } }. 3.2.4 Heuristic-URRA (H-URRA) Algorithm Although the SA-URRA algorithm can find an optimal state X to achieve (14), but it may not be able to reach an optimal stable state within a TTI due to various possible combinations. Therefore, for fast searching of a suboptimal solution in QoS Fulfillment Phase, a heuristic method is proposed in this section, called heuristic-URRA (H-URRA) algorithm. -30-.
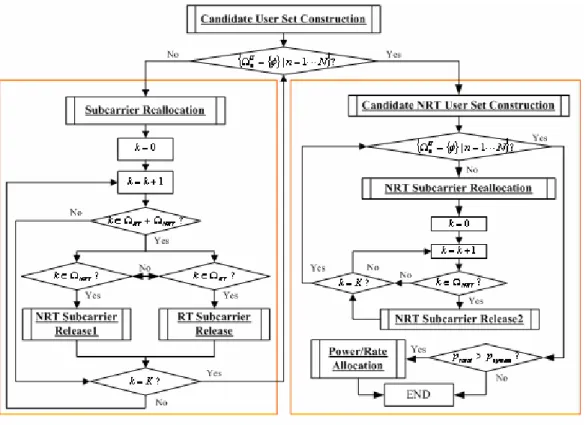
(40) The basic idea is that allocating iteratively subcarriers to the user having the best utility in the candidate sets of subcarriers. In addition, subcarriers will be released from users if some specific situations are satisfied. The process will not be stopped if all subcarriers are allocated to users, or the packets of all users have been transmitted. Notably, the H-URRA is not a water filling-like algorithm because the subcarrier allocation is determined by the utility which comprises of link gain and user satisfaction. In the SA-URRA algorithm, the SA method approaches the optimal X by iterations, and the iteration number depends on four parameters: Tmax , Tmin , Lmax , γ . Unfortunately, the required iteration number for reaching an optimal state is usually very large. Conversely, in the worst case, the required iteration number of the H-URRA algorithm is equal to the total user number, which is much less than that of SA-URRA algorithm. Moreover, in the H-URRA algorithm, subcarriers are firstly allocated to users having the best utilities and then partially released for the next iteration. Accordingly, the residual subcarriers for reallocation will decrease with iteration increase, and the computational complexity will also be reduced greatly with iteration increase. The flowchart of the H-URRA algorithm is illustrated in Fig. 3.3, which is decomposed into 5 steps described as follows. Step 1 and Step 2 consist of the operations in QoS Fulfillment Phase, and Step 3 to Step 5 consist of the operations in Throughput Maximization Phase. Step 1: Candidate User Set Construction is executed to construct the candidate set in which the users have packets to transmit.. This function is executed once at the beginning of. the flowchart at each TTI. If all Ω Un sets are empty, go to Step 3. Otherwise, go to Step 2. Step 2: Residual subcarriers are allocated to users by executing Subcarrier Allocation. Next, modulation orders are assigned and redundant subcarriers are released in terms of users. The function RT Subcarrier Release is executed for RT users, while the function NRT Subcarrier Release 1 is executed for NRT users. After the iteration, go back to Step 1. Step 3: Candidate NRT User Set Construction is used to construct the candidate set in. -31-.
(41) which the NRT users still requiring radio resources. And, the function is executed once when Step 3 is firstly performed at each TTI. If all ΩUn sets are empty, go to Step 5. Otherwise, go to Step 4. Step 4: Modulation orders are assigned and redundant subcarriers are released by executing NRT Subcarrier Release 2. Then, go back to Step 3. Step 5: If the total system constraint defined in (3) is violated, the function Power/Rate Allocation will be executed and then go to END. Otherwise, go to END.. Fig. 3.3 The Flowchart of the H-URRA Algorithm. In the proposed H-URRA algorithm, several function blocks are embedded in the flowchart, Fig. 3.3. An introduction of these function blocks are descried as follows. In addition, the Throughput Maximization Phase is the same as in section 3.2.3, and the detail will not be described again in this section.. -32-.
(42) (I) Candidate User Set Construction /* The function the candidate user sets for subcarriers by different criterion between RT users and NRT users. In order to reduce the searching space at the beginning of the algorithm, a priority threshold, Pth , can be used. A user can only use the subcarriers if their priority function is larger than the threshold in the phase. */ From n=1 To n=N { ΩUn := { φ } ;. From k=1 To k=K { If ( k ∈ Ω RT ){ /* The Criterion for candidate RT users */ If ( R(k , n ) ≥ 2 && P ( k , n) > Pth ) { ΩUn = Ω Un + { k };. }} If ( k ∈ Ω NRT ){ /* The Criterion for candidate NRT users */ If ( R(k , n ) ≥ 2 && P ( k , n) > Pth && Lk ≥ 1 ) { ΩUn = Ω Un + { k };. }} } }. (II) Subcarrier Reallocation /* The function reallocates each subcarrier to a user having the best utilities in each candidate user set */ Ω Sk := the candidate subcarrier set of the kth user;. -33-.
(43) From n=1 To n=N { If ( Ψn == {φ } ){ Ψn := a user having the maximum U ( k , n) in the set ΩUn ; Ω SΨn = Ω SΨn + {n} ;. } }. (III) RT Subcarrier Release /* The function assigns modulation orders to a RT user until the assigned rate is more than the required rate, or until the useful subcarrier set is empty */ Ω Sk := the candidate subcarrier set of the kth user; RkB := the required rate to clean up the kth user’s buffer; RkA := 0; /* Rk2 is the assigned rate of the kth user */. While ( R kA < RkB ) { If( Ω Sk == {φ } ) { Break; } nˆ := the subcarrier having the maximum link gain of the kth. user in the set Ω kS ; Ψnˆ := k ; Φ nˆ = Φ max ; R kA = RkA + Φ nˆ ; nˆ. If ( RkA > R kB ){ /* reduce the modulation order */ Φ nˆ = Φ nˆ − ( R kA − RkB ) ; RkA = R kB ;. From n=1 To n=N { ΩUn = {ΩUn − {k }| Ψn ≠ k }; } } }. (IV) NRT Subcarrier Release 1 /* The function assigns modulation orders to a NRT user until. -34-.
(44) the constraint (6) or than the aggregated tokens, or until the useful subcarrier sets are all empty. */ Ω Sk := the candidate subcarrier set of the kth user; RkB := the required rate to clean up the kth user’s buffer; RkA := 0; /* Rk2 is the assigned rate of the kth user */. While ( R kA < RkB ) { If ( Ω Sk == {φ } ) { Break; } nˆ := the subcarrier having the maximum link gain of the kth. user in the set Ω kS ; Ψnˆ := k ; Φ nˆ = Φ max ; R kA = RkA + Φ nˆ ; nˆ. If ( RkA > R kB ){ /* reduce the modulation order */ Φ nˆ = Φ nˆ − ( R kA − RkB ) ; RkA = R kB ;. From n=1 To n=N { ΩUn = {ΩUn − {k }| Ψn ≠ k }; } } If ( Lk < R kA ) { Break; } }. -35-.
(45) Chapter 4 Simulation Results Chapter 4 Simulation Results. 4.1 Simulation Environment. I. n this section, the related OFDM system parameters, the user’s traffic model, and the SA parameters are listed in here.. 4.1.1 OFDM System Parameters The downlink system-level OFDMA simulation environments are configured mainly according to [7], and the related parameters are listed in Table 4.1. In the following simulations, the number of total subcarriers is equal to the FFT size, 512, but only 299 subcarriers are used for data transmission, while the others are used for pilot channel and signaling. The block size is defined in terms of bits that can be transmitted within a TTI by a subcarrier at least, and each user’s traffic streams are segmented into packets by the block size. Besides, the maximum system power constraint p system is defined as 80% of the BS total transmission power, and the maximum subcarrier power constraint p max is defined as the power that sustains a QPSK transmission at the cell boundary with 12 dB shadowing.. Parameters. Explanation / Assumption. TTI duration. 2 msec. FFT size (points). 512. OFDM sampling rate. 7.68 Msaples/sec -36-.
(46) Guard time interval (cyclic prefix). 56 / 7.29(NOTE) samples/ µ sec. Subcarrier separation. 15 kHz. # of OFDM symbols per TTI. 27. Block Size. 54. OFDM symbol duration. 73.96 μsec. # of useful subcarriers per OFDM symbol (N) 299 OFDM bandwidth. 4.485 MHz. Cell size. 1600 m. Propagation model. L = 128.1 + 37.6 ⋅ log 10 ( R) dB. Fast fading model. Rayleigh distribution ( µ = 1 ). Standard deviation of slow fading. 8 dB. Carrier frequency. 2000 MHz. Thermal noise density. -174 dBm/Hz. BS total Tx power. 44 dBm. Power allocated to data transmission ( p system ) 43.10 dBm Maximum Tx power on a subcarrier ( p max ). 21.76 dBm. NOTE: Requires one extra prefix sample for 8 out of 9 OFDM symbols Table 4.1 OFDMA System-level Configuration. 4.1.2 Source Traffic Models and QoS requirements For evaluating the proposed utility-based algorithms and link-gain-based algorithm, two kinds of traffic types are considered in the simulations [13]. The first traffic type is the speech source model of RT service whose parameters are listed in Table 4.2. Each RT users is modeled as an ON-OFF voice model, in which the mean of ON period is the same as the mean of OFF period, and the source rate is a constant rate, 12.2kbps, during ON period. The second traffic type is the data source model of NRT service. -37-.
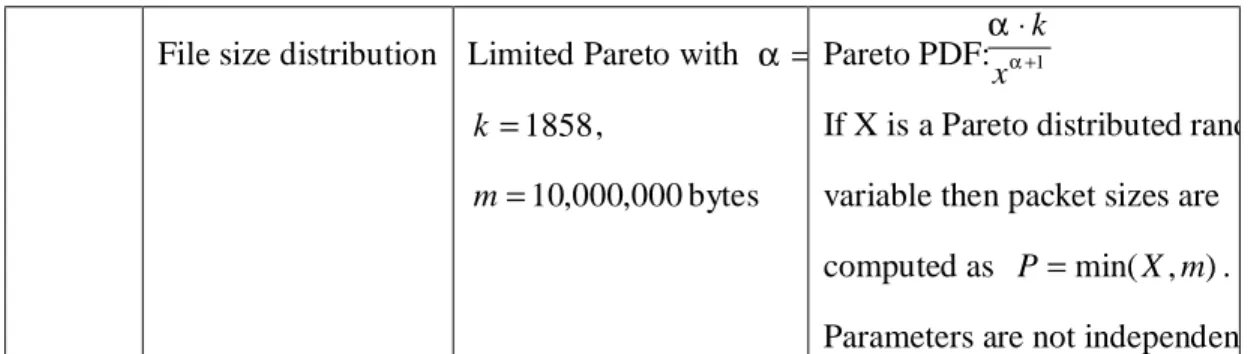
(47) Each NRT user is modeled as a WWW application, consisting of a sequence of file downloads. Each file download is modeled as a sequence of packet arrivals. The parameters of the data traffic are listed in Table 4.3. In this thesis, the QoS requirements of these two services are listed in Table 4.4 [14]. The required BER of NRT services is larger than that of RT services for accurate data transmission. In addition, the required transmission rate of RT services is the same as the source rate, while the minimum required transmission rate of NRT services is equal to the token rate. Class. Parameter. Values. Transmission Bit rate [kbits/sec]. 12.2k bps. File. Duration of On-state Distribution. Exponential. Duration of On-state mean. 3 sec. Duration of Off-state Distribution. Exponential. Duration of Off-state mean. 3 sec. Table 4.2 Speech Source Model. Class. Parameter. Values. Remark. File. # of packets per. Chop with packet size. call distribution. 1500 bytes. Packet inter arrival. Exponential. time distribution Packet inter arrival. Packet inter arrival time within a packet call. 0.00083 sec. time mean Inter-file. Exponential. time distribution. Packet. Reading time between two consecutive packet calls. reading time mean. 12 sec. File size mean. 120,000 bytes. -38-.
(48) α ⋅k File size distribution Limited Pareto with α = Pareto PDF: α +1 x. k = 1858 ,. If X is a Pareto distributed random. m = 10,000,000 bytes. variable then packet sizes are computed as P = min( X , m) . Parameters are not independent. Table 4.3 Data Source Model. Type. Requirements. Value. RT. required transmission rate. 12.2k bps. required BER. 10-3. maximum delay tolerance. 0.01 sec (20 TTI). maximum packet dropping ratio. 1%. minimum required transmission rate. 1.35k bps. required BER. 10-6. NRT. Table 4.4 The QoS Requirements of RT and NRT Service. 4.1.3 Parameters Setting of SA In the thesis, the SA parameters are determined by criterions suggested by [15], which states as follows (I) The value of Tmax The values of Tmax is determined to satisfy the criterion that the probability of accepting a worse neighbor state should be larger than 80 % at the initial stage, and it is set to 1120 according to (16). exp (∆U min / Tmax ) ≥ 80% .. (16). (II) The value of Tmin The value of Tmin is determined by the criterion that the probability of accepting a -39-.
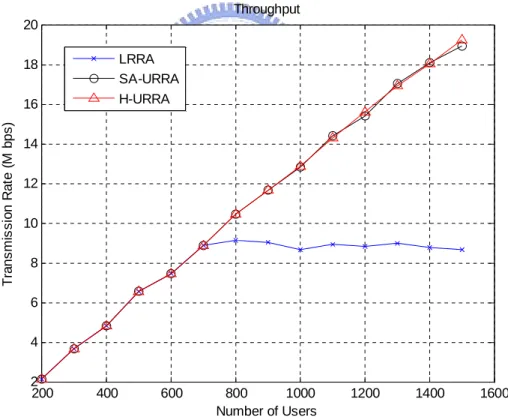
(49) worse neighbor state should be less than 0.01% at the final stage, and it is set to 1 according to (17). exp (∆U max / Tmin ) ≤ 0.01% .. (17). (III) The number of iterations at each temperature level, Lmax It is suggested that the number of iterations should be set to 100 times of the number of variables that the SA algorithm try to optimize. In the thesis, it is set to 100 ⋅ N , where N is the number of variables.. (IV) The decrement rate of temperature, γ In order to escape from being trapped at the local optimum, It is suggested that γ should be set larger than 0.85. In the thesis, it is set to 0.9.. 4.2 Performance Evaluation In this thesis, the LRRA, SA-URRA, and H-URRA algorithms are simulated for performance comparison. First, system throughput is measured for evaluating transmission efficiency. Second, the satisfaction of RT and NRT users is measured for evaluating the capability of QoS provisioning. For evaluating the satisfaction of RT users, three aspects are considered. The first is to observe the mean delay of all RT users’ packets, the second is to observe the packet dropping ratio of all RT user’s packets, and the last is to observe the ratio of RT users whose packet dropping ratio exceed the required threshold. For evaluating the satisfaction of NRT users, two aspects are considered: the first is to observe the mean transmission rate among all NRT users, and the second is to observe the ratio of NRT users whose transmission rate is lower than the QoS requirement. In the following simulations, the number of NRT users are fixed at 100, and the number of total users increases from 200 to 1400。 Figure 4.1 shows the relationship between user number and system throughput. In this figure, the three algorithms have the same throughput when the user number is less than 700. However, the throughput of the LRRA algorithm saturates when the user number is larger. -40-.
(50) than 700; on the other hand, the throughputs of the SA-URRA and the H-URRA algorithms still incline with the increasing of user number. Two reasons can be used to explain this phenomenon. First, the RT traffic model generates only one packet in ON period at each TTI, but a subcarrier can transmit 3 packets at most at each TTI if 64QAM is used. Second, the LRRA algorithm always allocates subcarriers to the users having best link gains though the other users are suffering from starvation; on the other hand, the SA-URRA and the H-URRA algorithms allocate subcarriers to users having higher utility values. Notably, a higher utility value mean the user may have more un-fulfilled transmission request or more packets in buffer, aside from better ling gain. As a result, the SA-URRA and the H-URRA algorithm improve the system throughput by transmitting packets with higher modulation. Throughput 20 LRRA SA-URRA H-URRA. 18. Transmission Rate (M bps). 16 14 12 10 8 6 4 2 200. 400. 600. 800 1000 Number of Users. 1200. 1400. 1600. Fig. 4.1 Average Throughput per TTI In the simulation environment, the RT voice model generates 0.5 packet per TTI and the NRT WWW application model generates 0.3 packet per TTI, in average. Beacuse each. -41-.
(51) subcarrier can transmit 3 packets per TTI if 64QAM is used, the ideal maximum RT users is calculated by (299*3-100*0.3)/0.5; as a result, the ideal maximum user number could be as high as 1834. The satisfaction of RT users and NRT users is observed separately in Fig. 4.2-4.6. Figure 4.2 and Figure 4.3 depict packet delay and packet dropping ratio for RT users’ packets, respectively. In Fig. 4.2, the delay of the LRRA algorithm is lower than those of SA-URRA and H-URRA algorithms when user number is less than 700, but rapidly ascends when the user number is larger than 700. In Fig. 4.3, the packet dropping ratio of the SA-URRA and the H-URRA algorithms are almost zero, while the packet dropping ratio of the LRRA algorithm rapidly increases from 0 when the user number is larger than 700. Fig.4.4 shows the ratio of un-guaranteed RT user over all RT users. Obviously, the LRRA algorithm cannot provide the QoS guarantee for all the RT users when the user number is larger than 700, while the SA-URRA and the H-URRA algorithms can until the user number reaches 1100. Mean Packet Delay of RT Users 25 LRRA SA-URRA H-URRA. Delay Time (msec). 20. 15. 10. 5. 0 200. 400. 600. 800 1000 Number of Users. 1200. 1400. Fig. 4.2 Mean Delay per Packets of RT Users. -42-. 1600.
(52) Packet Dropping Ratio of RT Users 0.7 LRRA SA-URRA H-URRA. 0.6. 0.5. 0.4. 0.3. 0.2. 0.1. 0 200. 400. 600. 800 1000 Number of Users. 1200. 1400. 1600. Fig. 4.3 Packet Dropping Ratio of RT Users Unguaranteed Ratio of RT Users 0.7 LRRA SA-URRA H-URRA. 0.6. 0.5. 0.4. 0.3. 0.2. 0.1. 0 200. 400. 600. 800 1000 Number of Users. 1200. 1400. Fig. 4.4 Un-guaranteed Ratio of RT Users -43-. 1600.
(53) Figure 4.5 shows the average transmission rate of all NRT users. For the three algorithms, the average transmission rate decrease as user number increases, but the minimum required transmission rate is guaranteed. However, Fig. 4.6 shows that, for the LRRA algorithm, un-guaranteed NRT users does not appear until the user number is larger than 500, whereas the un-guaranteed NRT users do not appear until the user number exceeds 1300 for both the SA-URRA and H-URRA algorithms. Notably, the LRRA algorithm does not make any compensation for an unsatisfied NRT user but allocate the radio resources to a NRT user having best link gains with higher probability; consequently, some NRT users may suffer from lower transmission rate though the measured average transmission rate for all NRT users is higher than the required QoS. Average Transmission Rate of NRT users 11 10. Transmission Rate (k bps). 9 8 7 6 5 4 3 200. LRRA SA-URRA H-URRA 400. 600. 800 1000 Number of Users. 1200. 1400. Fig. 4.5 Average Transmission Rate of NRT Users. -44-. 1600.
(54) Unguaranteed Ratio of NRT Users 0.7 LRRA SA-URRA H-URRA. 0.6. 0.5. 0.4. 0.3. 0.2. 0.1. 0 200. 400. 600. 800 1000 Number of Users. 1200. 1400. 1600. Fig. 4.6 Un-guaranteed Ratio of NRT Users From the simulation results shown in Fig. 4.1 - Fig. 4.6, the SA-URRA and H-URRA algorithms obviously outperform the LRRA algorithm in terms of system throughput and QoS satisfaction of all users. The proposed utility function (9) is designed to consider transmission efficiency by the rate-power function (10) and the priority function (12) and to make a compensation for unsatisfied users to prevent from starvation by the QoS function (11) so the SA-URRA and the H-URRA algorithm can achieve better system throughput under satisfying users’ QoS requirements. Figure 4.7 compares the SA-URRA and the H-URRA algorithms by the objective function value measured in long-term statistics. Although the SA-URRA can obtain an optimal X to maximize the objective function U at each TTI, while the H-URRA can only obtain a suboptimal X to approach the maximum objective function value, the SA-URRA and H-URRA algorithm surprisingly have almost the same performance in each performance evaluation. The interesting results come from the QoS function embedded in the utility function. The main goal of the QoS function is to make. -45-.
(55) a compensation for unsatisfied users whose QoS requirements are not fulfilled. The unsatisfied cases are most likely caused by the suboptimal radio resource allocation at previous TTI. In the next TTI, the QoS function will makes the compensation; that is, the QoS function acts like a negative controlling factor in the utility function. As a result, the performance of the suboptimal H-URRA algorithm approaches that of the optimal SA-URRA algorithm in the long-term statistics evaluation. Objective Function 6000 SA-URRA H-URRA. 5000. 4000. 3000. 2000. 1000. 0 200. 400. 600. 800 1000 Number of Users. 1200. Fig. 4.7 Value of Objective Function. -46-. 1400. 1600.
(56) Chapter 5 Conclusions Chapter 5 Conclusions. I. n this thesis, a URRA framework is proposed to allocate subcarriers, rate, and power. Two service types of user are considered in here: one is the RT user having on-off. voice traffic model, and the other is the NRT user having WWW Pareto traffic model. The URRA framework can be divided into two phases by different allocation principle. The first is QoS Fulfillment Phase which allocates subcarriers to all users according to their utilities, and the second is Throughput Maximization Phase which allocates subcarriers to specific NRT users according to their link gains. In QoS Fulfillment Phase, the utility function consists of rate-power function, QoS function, and priority function. In order to find an optimal subcarrier allocation vector to maximize the objective function, the SA-URRA algorithm is first proposed. However, the SA-URRA algorithm takes much time to reach a stable state with high computational complexity. Alternatively, the suboptimal H-URRA algorithm is then proposed with less computational complexity, compared to the SA-URRA algorithm. In the simulation results, the SA-URRA and the H-URRA algorithms are compared to a conventional LRRA algorithm. Observing the system throughput and the satisfaction of users, we can conclude that the SA-URRA and the H-URRA algorithms have better performance than the LRRA algorithm does because the utility function of these two algorithms are designed by considering transmission efficiency and compensation for unsatisfied users. Consequently, the SA-URRA and the H-URRA algorithm can get better system throughput and user’s QoS requirements are satisfied. In addition, the H-URRA algorithm has almost the. -47-.
(57) same performance as the SA-URRA algorithm. Furthermore, the framework of the URRA framework can be extended with the additional considerations of other radio resource management issues. Accompanying with a well-designed call admission control (CAC) scheme, the URRA framework would accommodate appropriate number of users so that the users’ QoS requirements can be easily fulfilled. In a multi-cell environment, the inter-cell interference (ICI) will arise if subcarriers are shared among all cells. To solve this problem, the URRA framework can be accompanied with a well-designed dynamic channel allocation (DCA) scheme to mitigate the ICI effect.. -48-.
數據
+7
相關文件
無線射頻識別 (Radio Frequency Identification, RFID) 系統近年來越來越普及,應用範圍如供
無線射頻識別 (Radio Frequency Identification, RFID) 系統近年來越來越普及,應用範圍如供
無線射頻識別 (Radio Frequency Identification, RFID) 系統近年來越來越普及,應用範圍如供
無線射頻識別 (Radio Frequency Identification, RFID) 系統近年來越來越普及,應用範圍如供
無線射頻識別 (Radio Frequency Identification, RFID) 系統近年來越來越普及,應用範圍如供
Local, RADIUS, LDAP authentication presents user with a login page. On successful authentication the user is redirected to
無線射頻識別 (Radio Frequency Identification, RFID) 系統近年來越來越普及,應用範圍如供
無線射頻識別 (Radio Frequency Identification, RFID) 系統近年來越來越普及,應用範圍如供
